Sample results

For each genome, your report should include a table with one row and two columns as shown below.
Each table should include the name of the species, the map, a small table with the TSB data, and links to your .fea, .tsv and .ods files.

Genus species


region


(f-c)/(f+c)
A
f(1:5) = 5
c(1:5) = 0
 1.0
B
f(6:10) = 1
c(6:10) = 4
-0.6


Genus_species.fea
Genus_species.fea.tsv
Genus_species.fea.ods
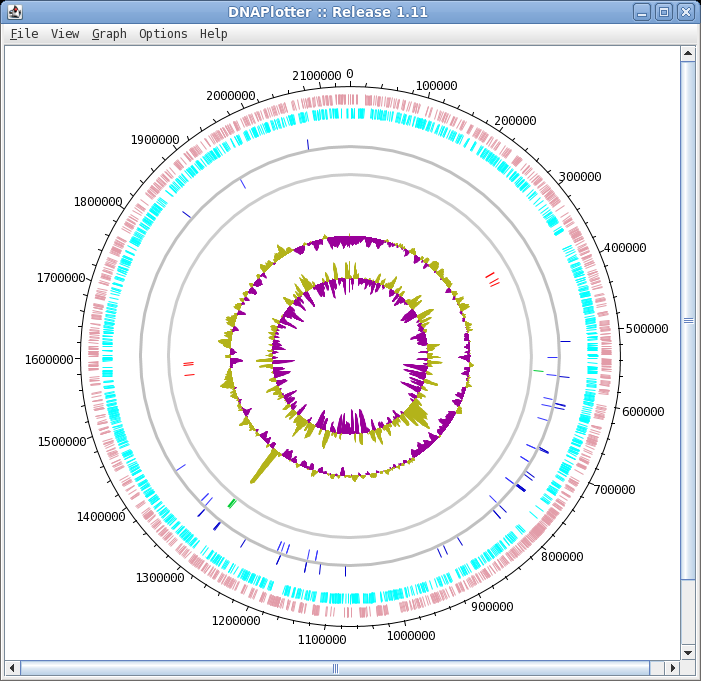


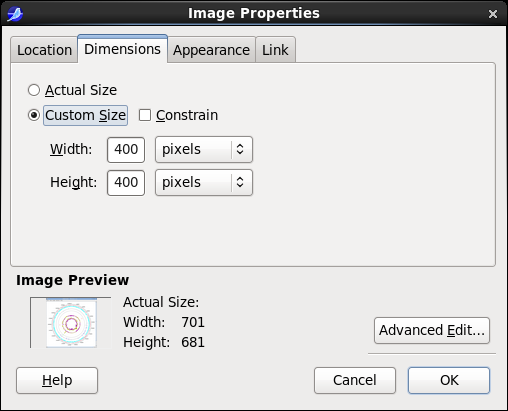
When you import each map, use the Dimensions tab to set the size of the image displayed on the page. A width of 400 pixels should be a good compromise between making the image fit, and still being able to see details.