Lecture 12, part 3 of 3
| PLNT4610/PLNT7690
Bioinformatics Lecture 12, part 3 of 3 |
| Prokaryotes |
Eukaryotes |
| smaller genomes and fewer genes | much larger genomes and more genes |
| more likely to have completely sequenced and annotated genomes | less likely to have completely sequenced and annotated genome |
| almost all genes present in single copies | many genes are in multigene familes |
| genes seldom have introns | genes almost always have introns; many genes have splice variants |
| haploid |
genomes
may be polyploid |
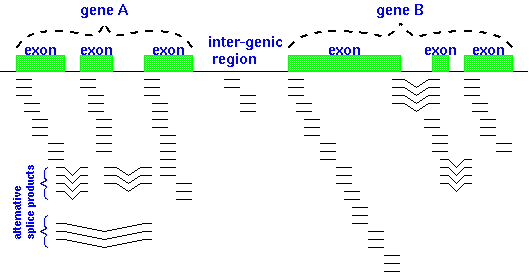 The illustration at right shows RNA-seq reads
aligned to two eukaryotic genes A and B. Reads that span part of
an exon are shown as single lines, whereas reads that include
parts of two adjacent exons are indicated by V-shaped lines. The
presence of introns being spliced out of pre-mRNA transcripts
means that alignment programs have to check to see whether a read
contains part of the 3' end of one exon and part of a 5' end of
another exon.
The illustration at right shows RNA-seq reads
aligned to two eukaryotic genes A and B. Reads that span part of
an exon are shown as single lines, whereas reads that include
parts of two adjacent exons are indicated by V-shaped lines. The
presence of introns being spliced out of pre-mRNA transcripts
means that alignment programs have to check to see whether a read
contains part of the 3' end of one exon and part of a 5' end of
another exon.| Pre-processing
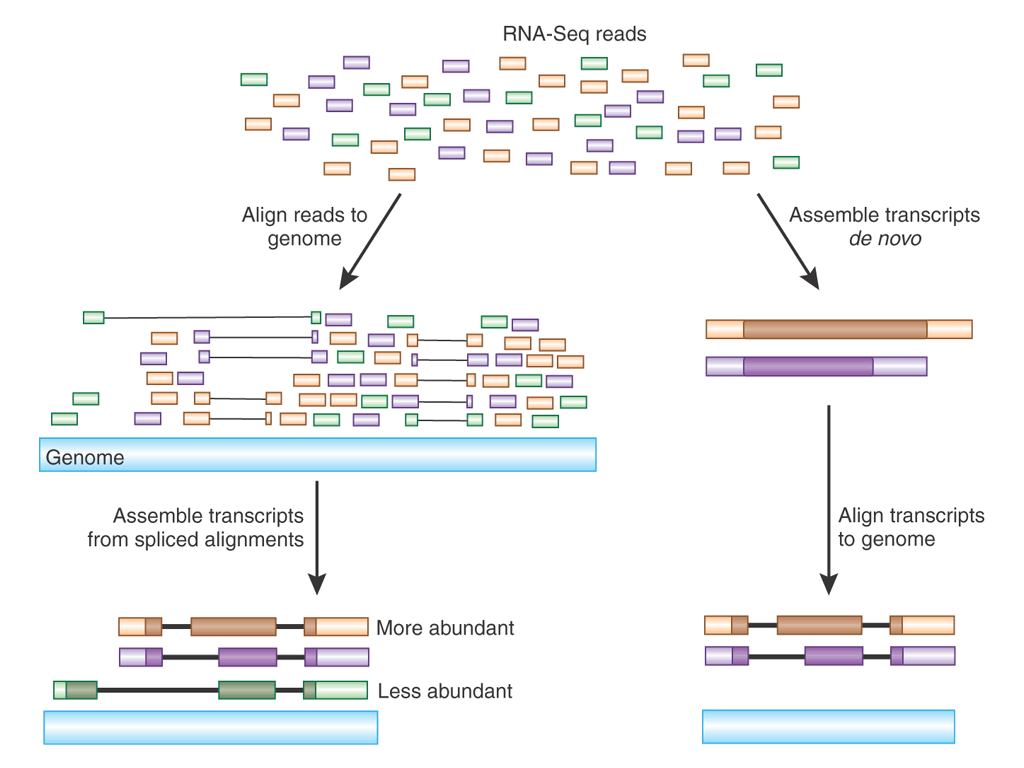
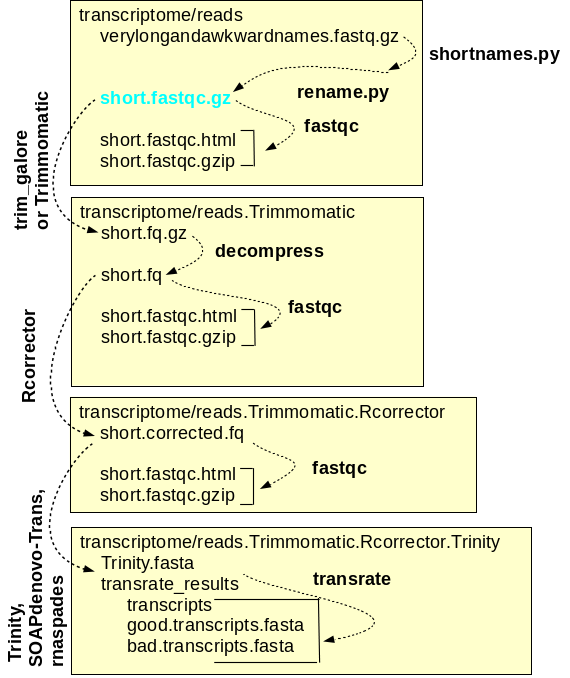
and assembly of reads A simplified workflow for transcriptome assembly is shown at right. Transcriptome assembly is carried out within the transcriptome directory, and for each major step, a separate subdirectory is used. Raw read files are saved in the reads directory, and symbolic links to these files, with short, meaningful names, are created. Sequencing adaptors are removed from the raw reads by Trimmomatic and the files containing the trimmed reads are saved in reads.Trimmomatic. The trimmed reads are used as input by Rcorrector, which corrects errors in the reads and writes the corrected reads to the reads.Trimmomatic.Rcorrector directory. At each step, FASTQC is run to check the properties of the reads. Finally, the assembly itself is done using programs such as Trinity which produces contig files and scaffold files. For each assembly, transrate produces a reports with extensive statistics that can guide the choice of which assembly is best, or which assemblies should be repeated with different a parameters for improvement. |
 |
| WARNING! Do not use DNA read
correction programs to correct RNA reads. DNA read correction programs like pollux assume equal k-mer frequencies for all k-mers. RNA read correction programs like Rcorrector require that k-mer frequencies are similar within a transcript, but recognize that because each transcript occurs at a different level, each transcript will have different k-mer frequencies. Strongly expressed transcripts will have high k-mer frequencies, while weakly expressed transcripts will have low k-mer frequencies. |
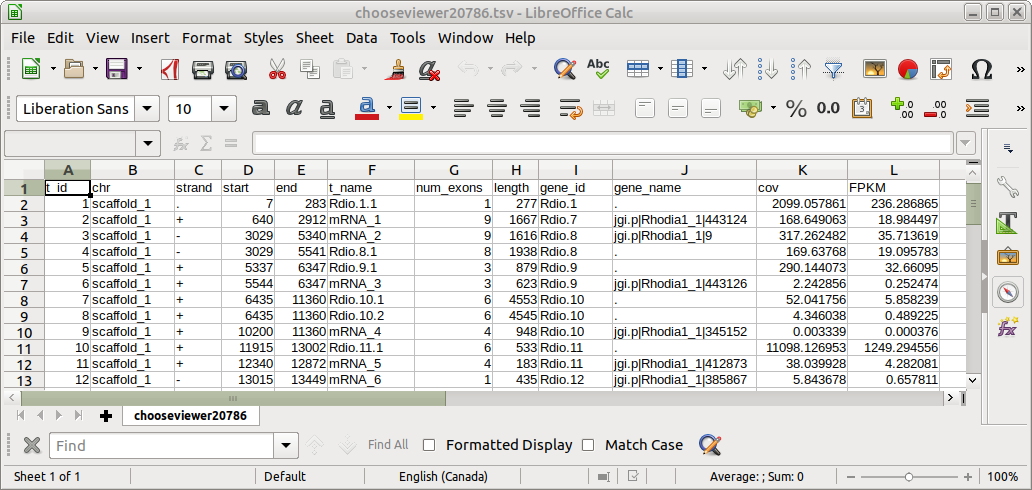
The final transcriptome assembly can now be used to generate gene expression data from the corrected reads. This tutorial implements the Hisat, Stringtie, Ballgown gene expression pipeline. Hisat-build creates files that index the features in the annotated genome, so that reads can be mapped to features. Mapped reads are written to .bam files. For each read file, hisat2 maps reads to the genome. Next, stringtie assembles the reads into transcripts, including alternative splicing products. Transcripts mapped to genomic locations are written to .gtf files. Transcripts from all sets of reads are merged into a single .gtf file by stringtie --merge. The final step is to generate tables of gene expression values. stringtie -B reads the mapped reads from the .bam files and the mapped transcripts from the .gtf files, and writes tables of FPKM values to comma-separated value files that can be read by the BioConductor R package for further analysis. |
 |
C : number of mappable reads on a feature
L : Length of feature (in kb)
N : Total number of mappable reads (in millions).
Not all reads can be mapped to a specific gene.
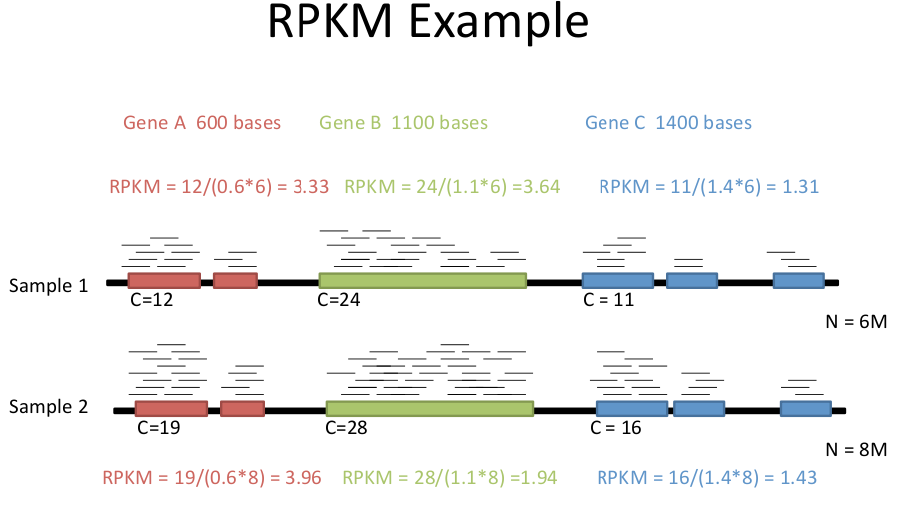
F : number of mappable fragments on a feature. There are usually two reads for a fragment with paired end reads. Each pair of reads counts as a fragment.Ballgown creates a file for each set of reads with FPKM values and other statistics for each gene.
L : Length of feature (in kb)
N : Total number of mappable reads (in millions)
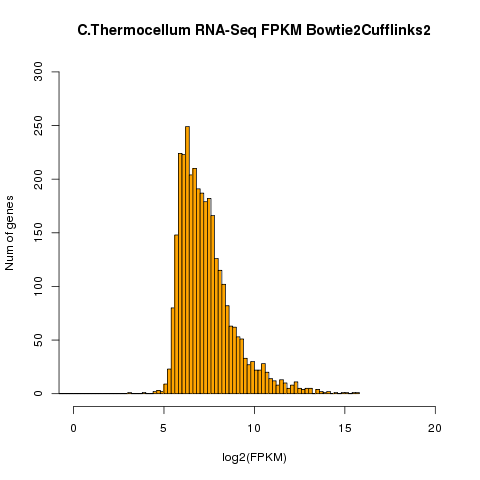
| Example of distribution of genes for a given
FPKM. RNAs from Clostridium thermocellum grown in exponential phase culture were assembled in a BowTie-TopHat Cufflinks pipeline. FPKM is represented as the log2 of FPKM. The number of genes expressed at a given FPKM level are represented as bars on the Y-axis. |
 |
|
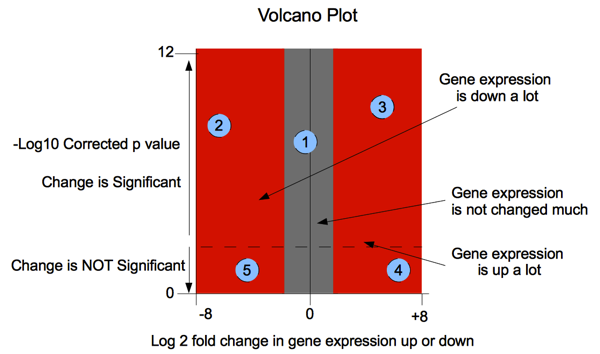
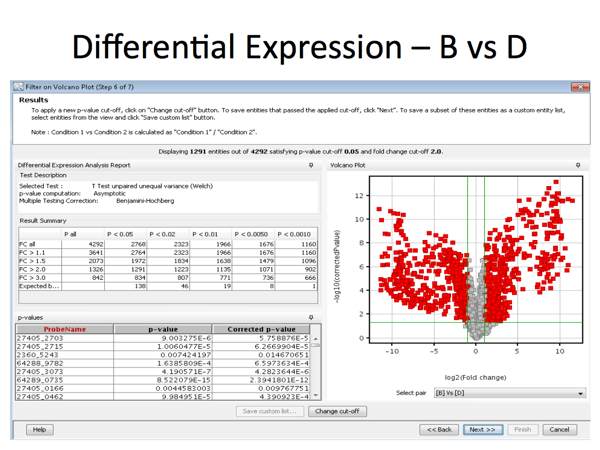
In the diagram below: Probe 1: a statistically significant result (consistent across the experimental replicates) showing little change in expression. Probe 2: a large decrease in gene expression that is also statistically significant (replicates match well) Probe 3: a large increase in gene expression that is also statistically significant, (replicates match well) Probe 4: a large increase in gene expression but one that
is not statistically significant because the replicates of
the experiment did not match well ie. observed change is
less than the variance between replicates. Probe 5: a large increase in gene expression but one that
is not statistically significant because the replicates of
the experiment did not match well |
 |

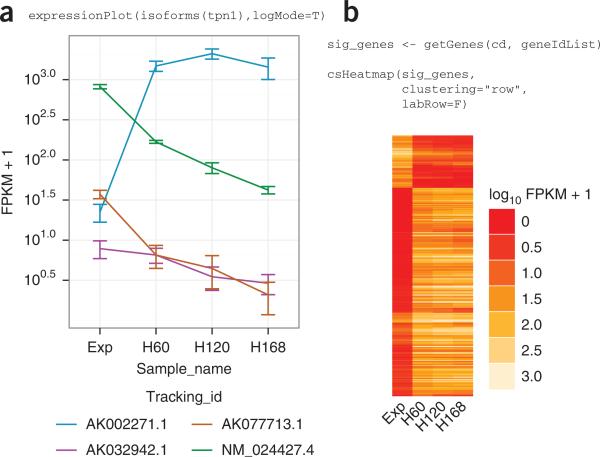
| Output from CummeRbund. a) CummeRbund can generate expression profiles for single genes. In this example, FPKM levels for four different tropomyosin I genes are shown in four different samples, with replicates, at four stages of differentiation in myoblast cells in mouse muscle tissue. b) Clustering of gene expression in myoblast cells over a differentiation timecourse in mouse muscle tissue. |
 |
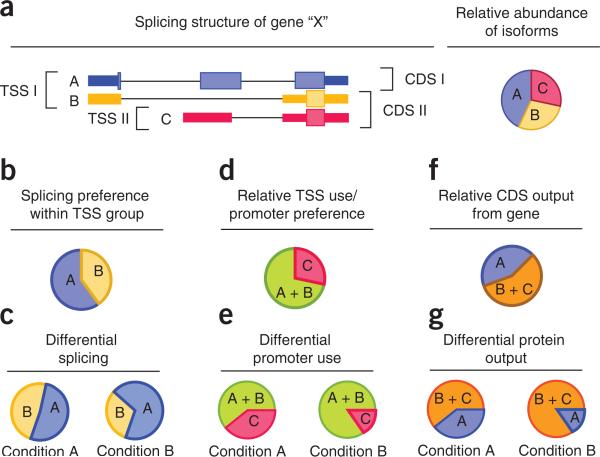
| a) Map of a hypothetical gene with two
different Transcription Start Sites (TSS) and three splice
variants. b - e) Detection of variants make it possible to separately examine differential promoter use and differential splicing, in different conditions. f, g) Since different proteins would also be generated by these splice and transcription variants, the proteome may be affected to |
 |
 Unless otherwise cited or
referenced, all content on this page is licensed under
the Creative Commons License Attribution
Share-Alike 2.5 Canada Unless otherwise cited or
referenced, all content on this page is licensed under
the Creative Commons License Attribution
Share-Alike 2.5 Canada |
| PLNT4610/PLNT7690
Bioinformatics Lecture 12, part 3 of 3 |