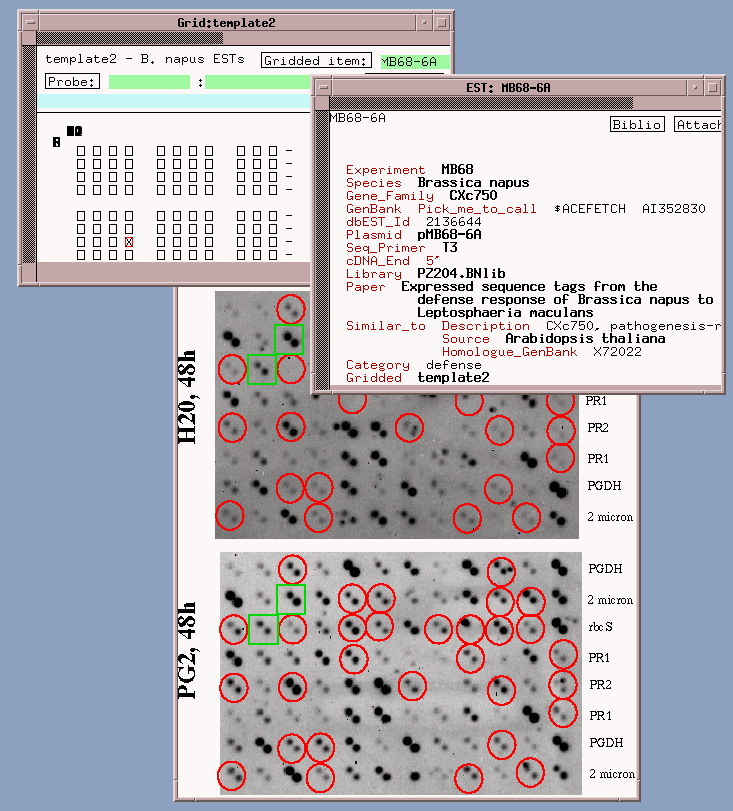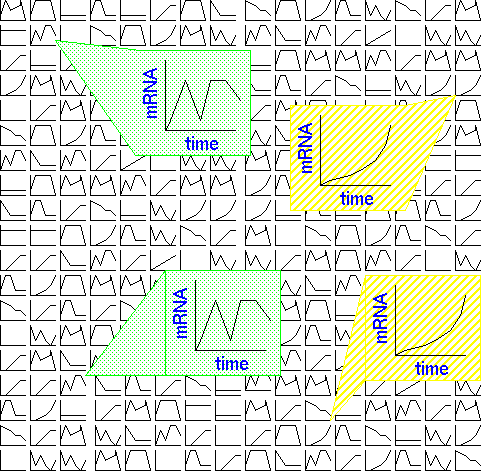

The goal is to obtain gene expression curves for all genes in the array, in which the expression of each gene is plotted versus time, during the first 5 days postinoculation. It is during this period that resistance or susceptibility is determined, in a given interaction.

I
 |
|
 |