 Satellite images of Manitoba’s Great Lakes
Scroll down to view
the latest images of the lakes.
I post
satellite images of Lake Winnipeg and microphotographs of the lake’s algae on
this web site from time to time, as new images or samples become
available. If you would like to be
informed whenever a new image is posted, please let me know by email at GregMcCullough@shaw.ca
You can go back in time a little by
clicking on these links to earlier images of the lake – summers
of
2003, 2004 and
2005 – pictorial records of summers of intense algal productivity.
 Or try this page>>>
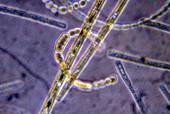
Hedy Kling’s microphotographs of algae
for some remote sensing
at the other end of the
size scale.
Hedy can be reached via her web site
Algal Taxonomy and Ecology Inc.
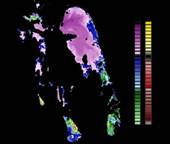
For current maps of suspended solids concentration and of surface algal blooms on Lake Winnipeg, check out >>> http://www.noetix.ca/WaterQuality/
The
site is operated by Noetix Research of Ottawa, and
displays maps created using algorithms that I have developed in cooperation
with the Department of Fisheries and Oceans.
It will be updated with new maps weekly, or as often as cloud-free
satellite images are available. The
service is funded by the Canadian Space Agency and for the next couple of years
at least, is completely free to users.
Disclaimer: These
pages were originally begun for the convenience of members of the Lake Winnipeg Research Consortium
in planning scientific missions.
Although the content and opinions expressed herein have been formed at
least partly in the course of many conversations with Consortium researchers,
and with others, I am solely responsible for all the words – whether
interesting, helpful, inciteful, misleading or
possibly just plain wrong. (Well, not for
the microphotography in the linked pages – those are all Hedy’s
work.) If any of the images on these
pages bring to mind thoughts, ideas, questions, whatever – email them to me if
you like, via my email address above.
Unless I’m inundated, I’ll try to answer; I seem to be endlessly
fascinated by these lakes.
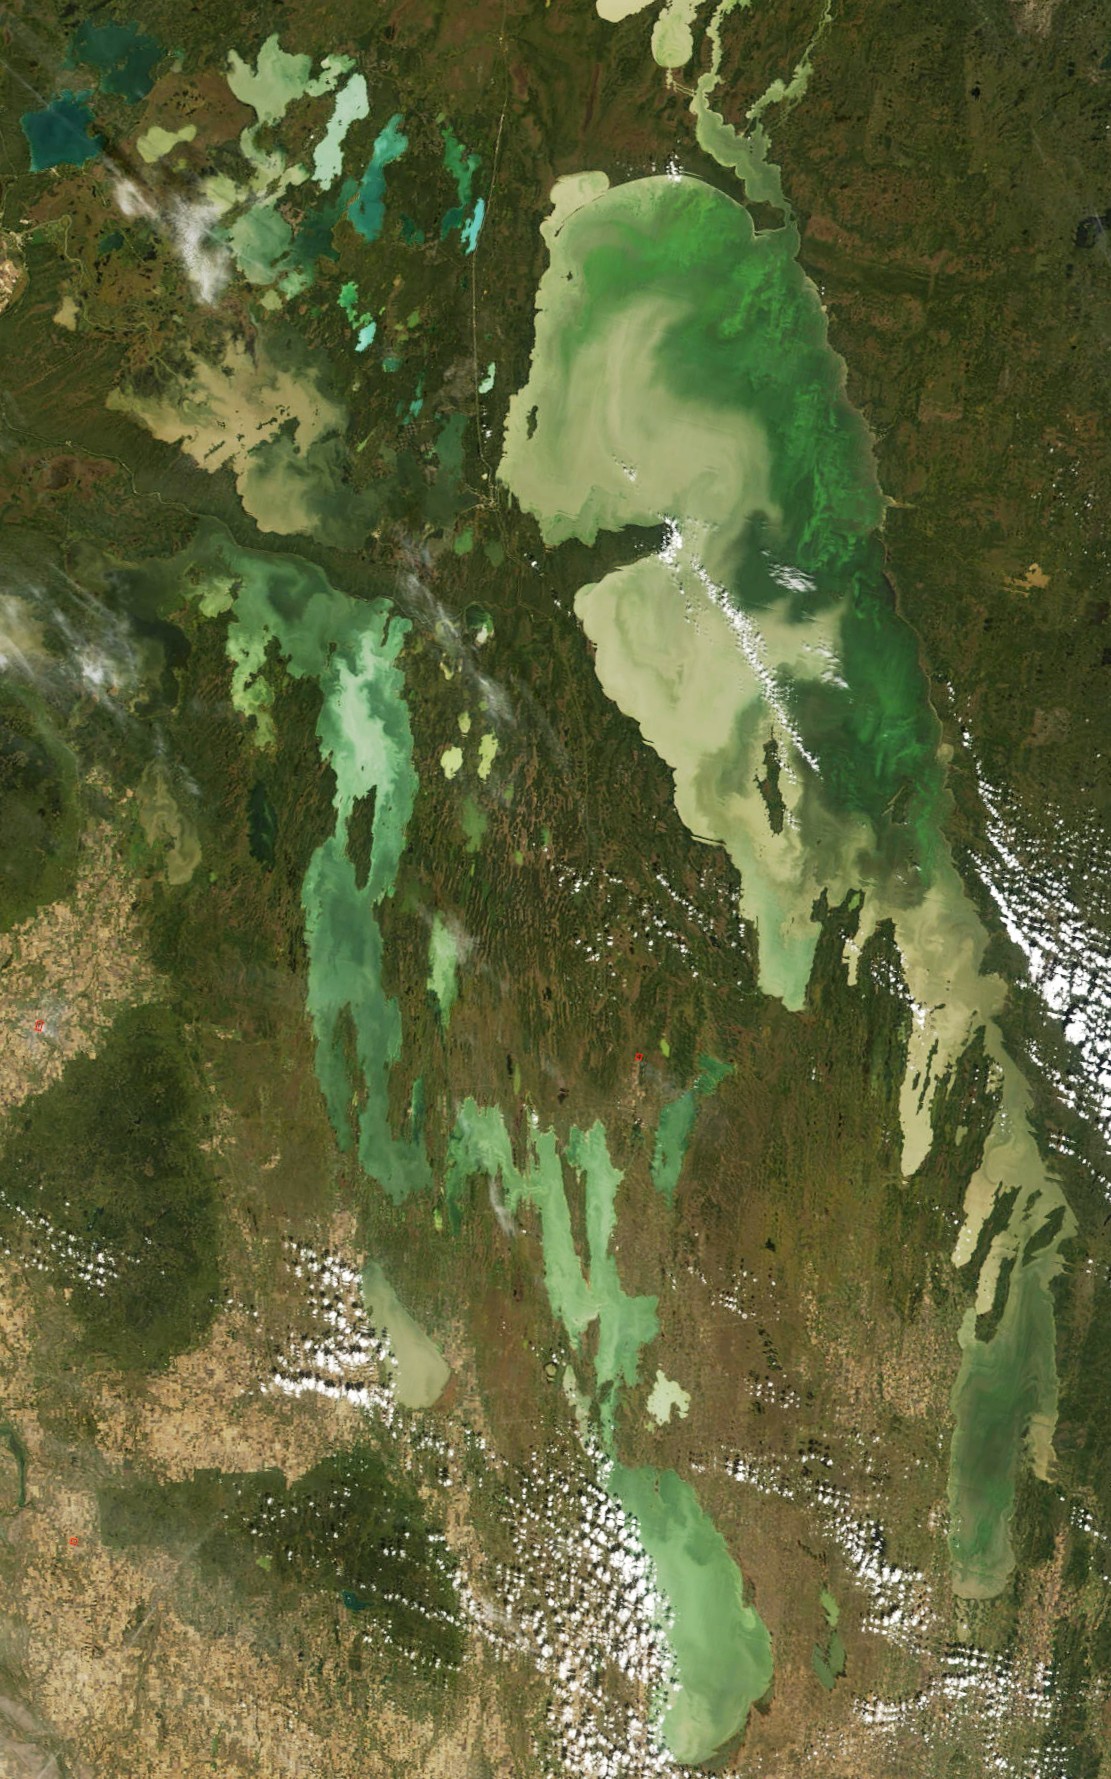
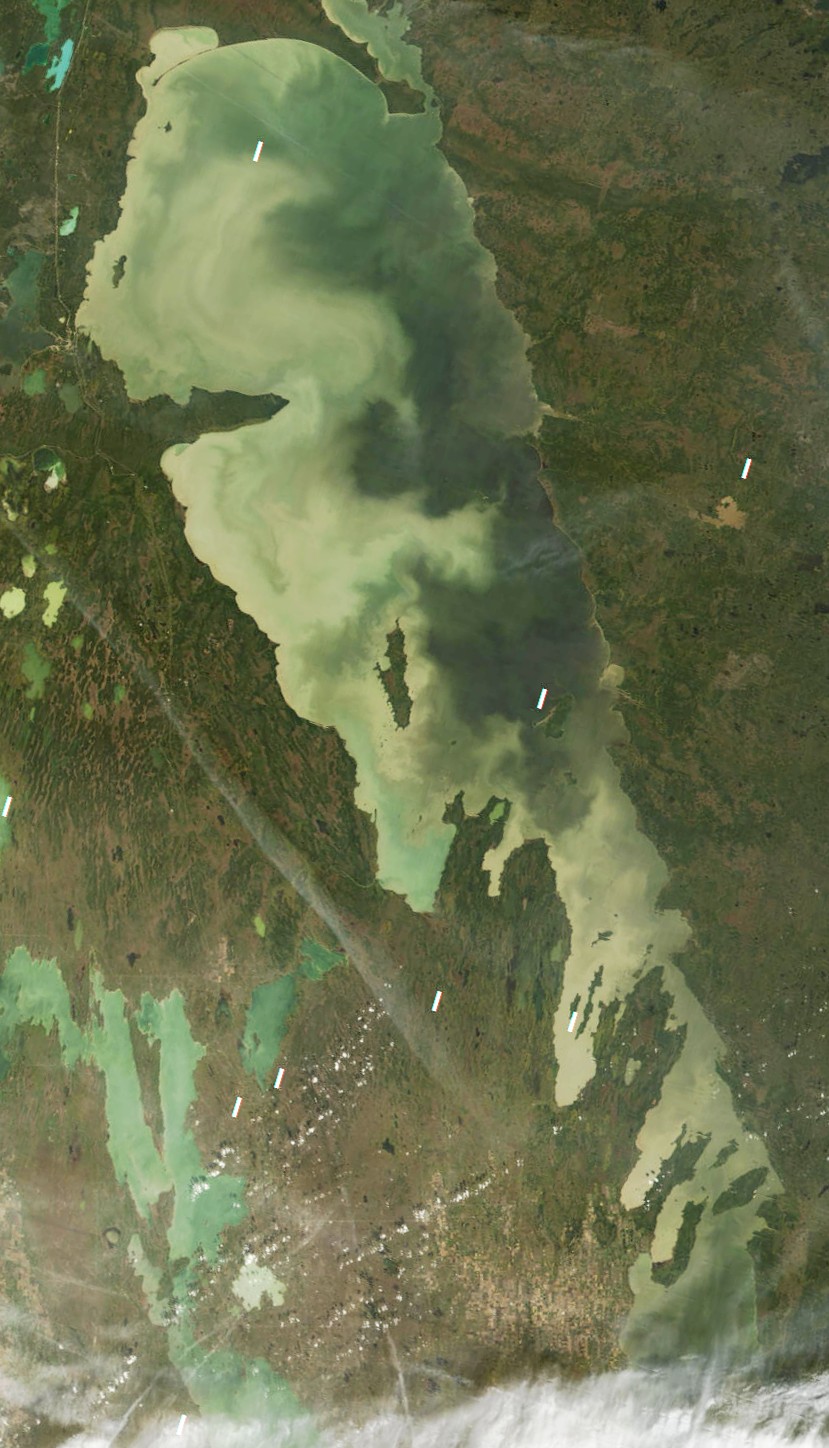
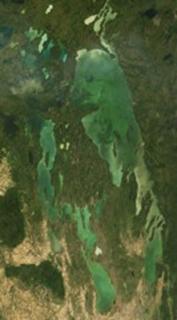
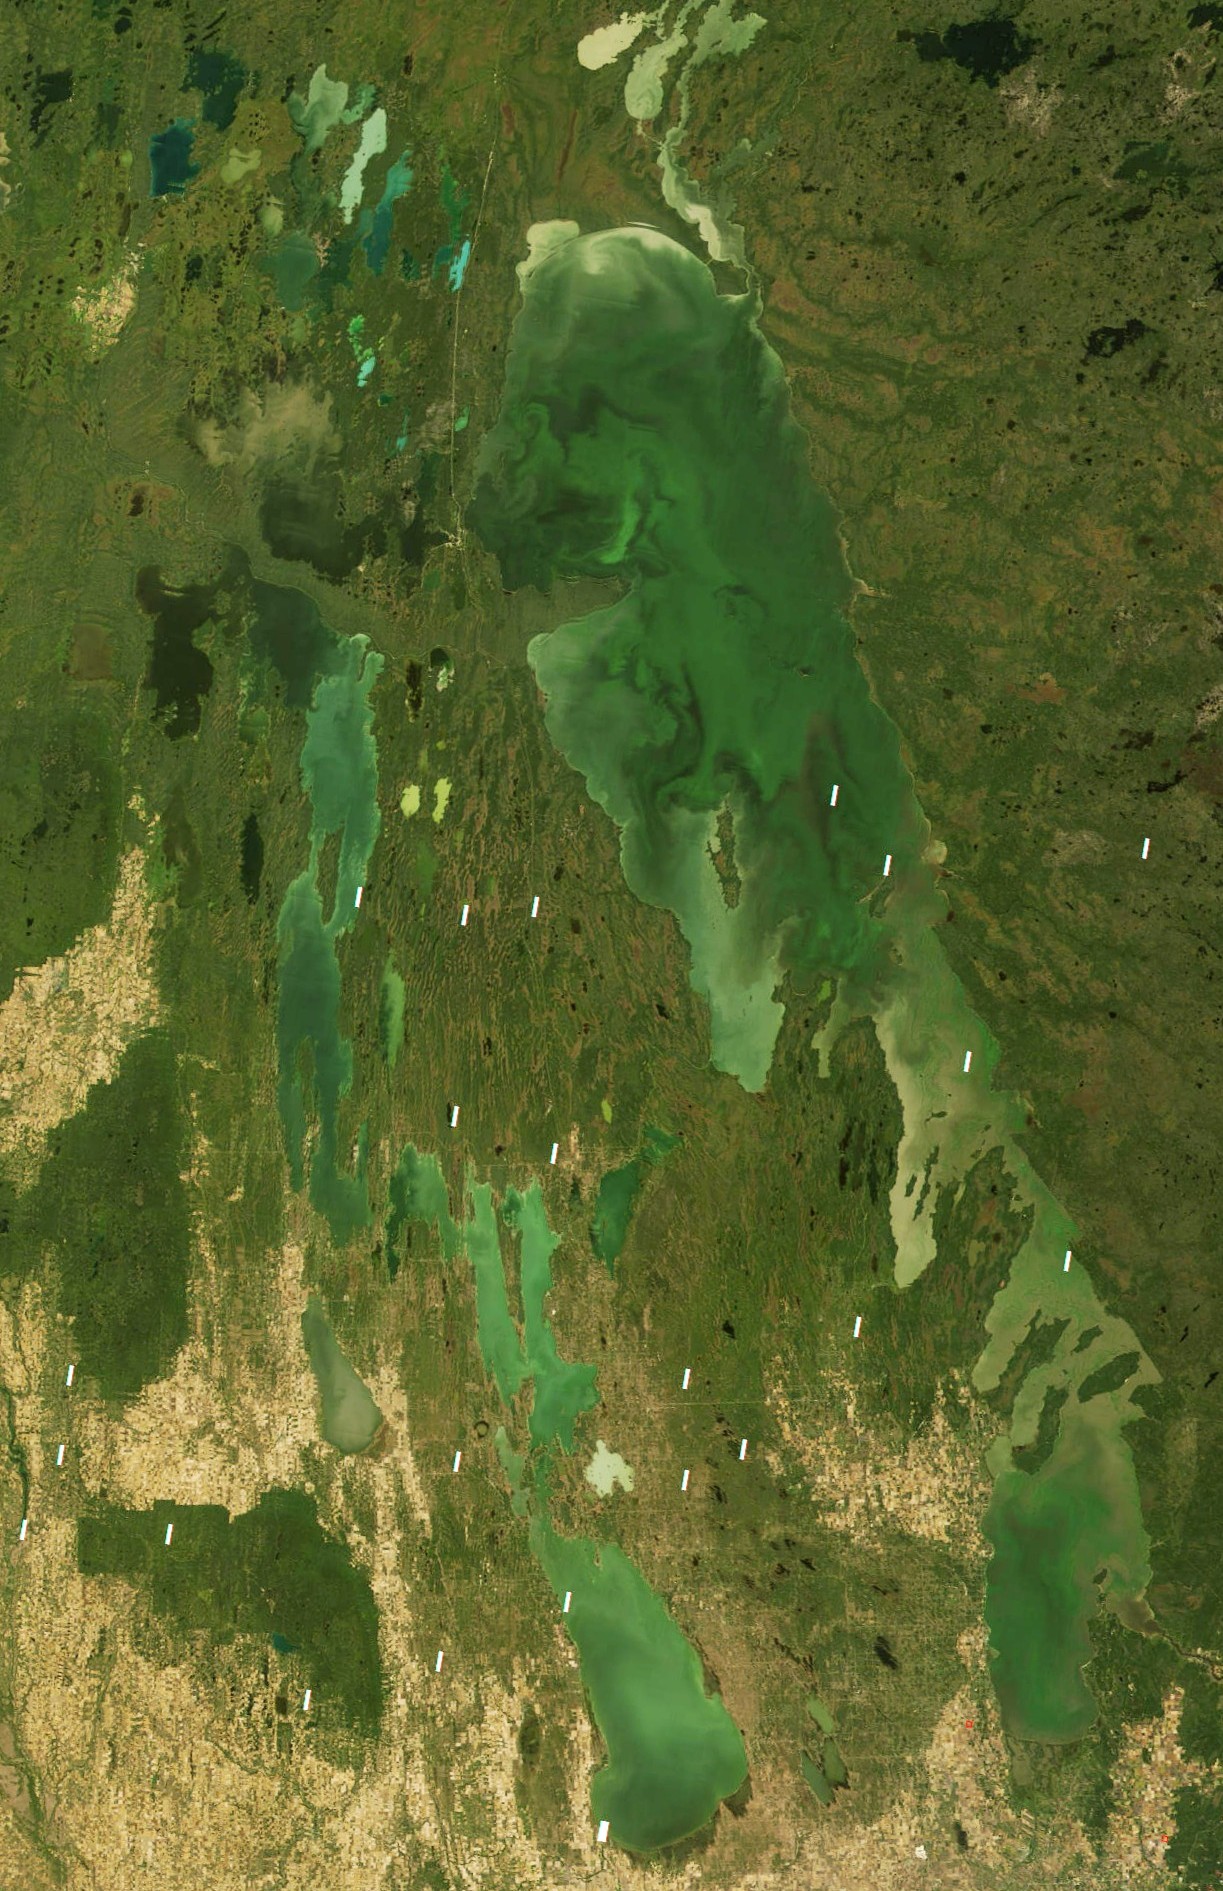
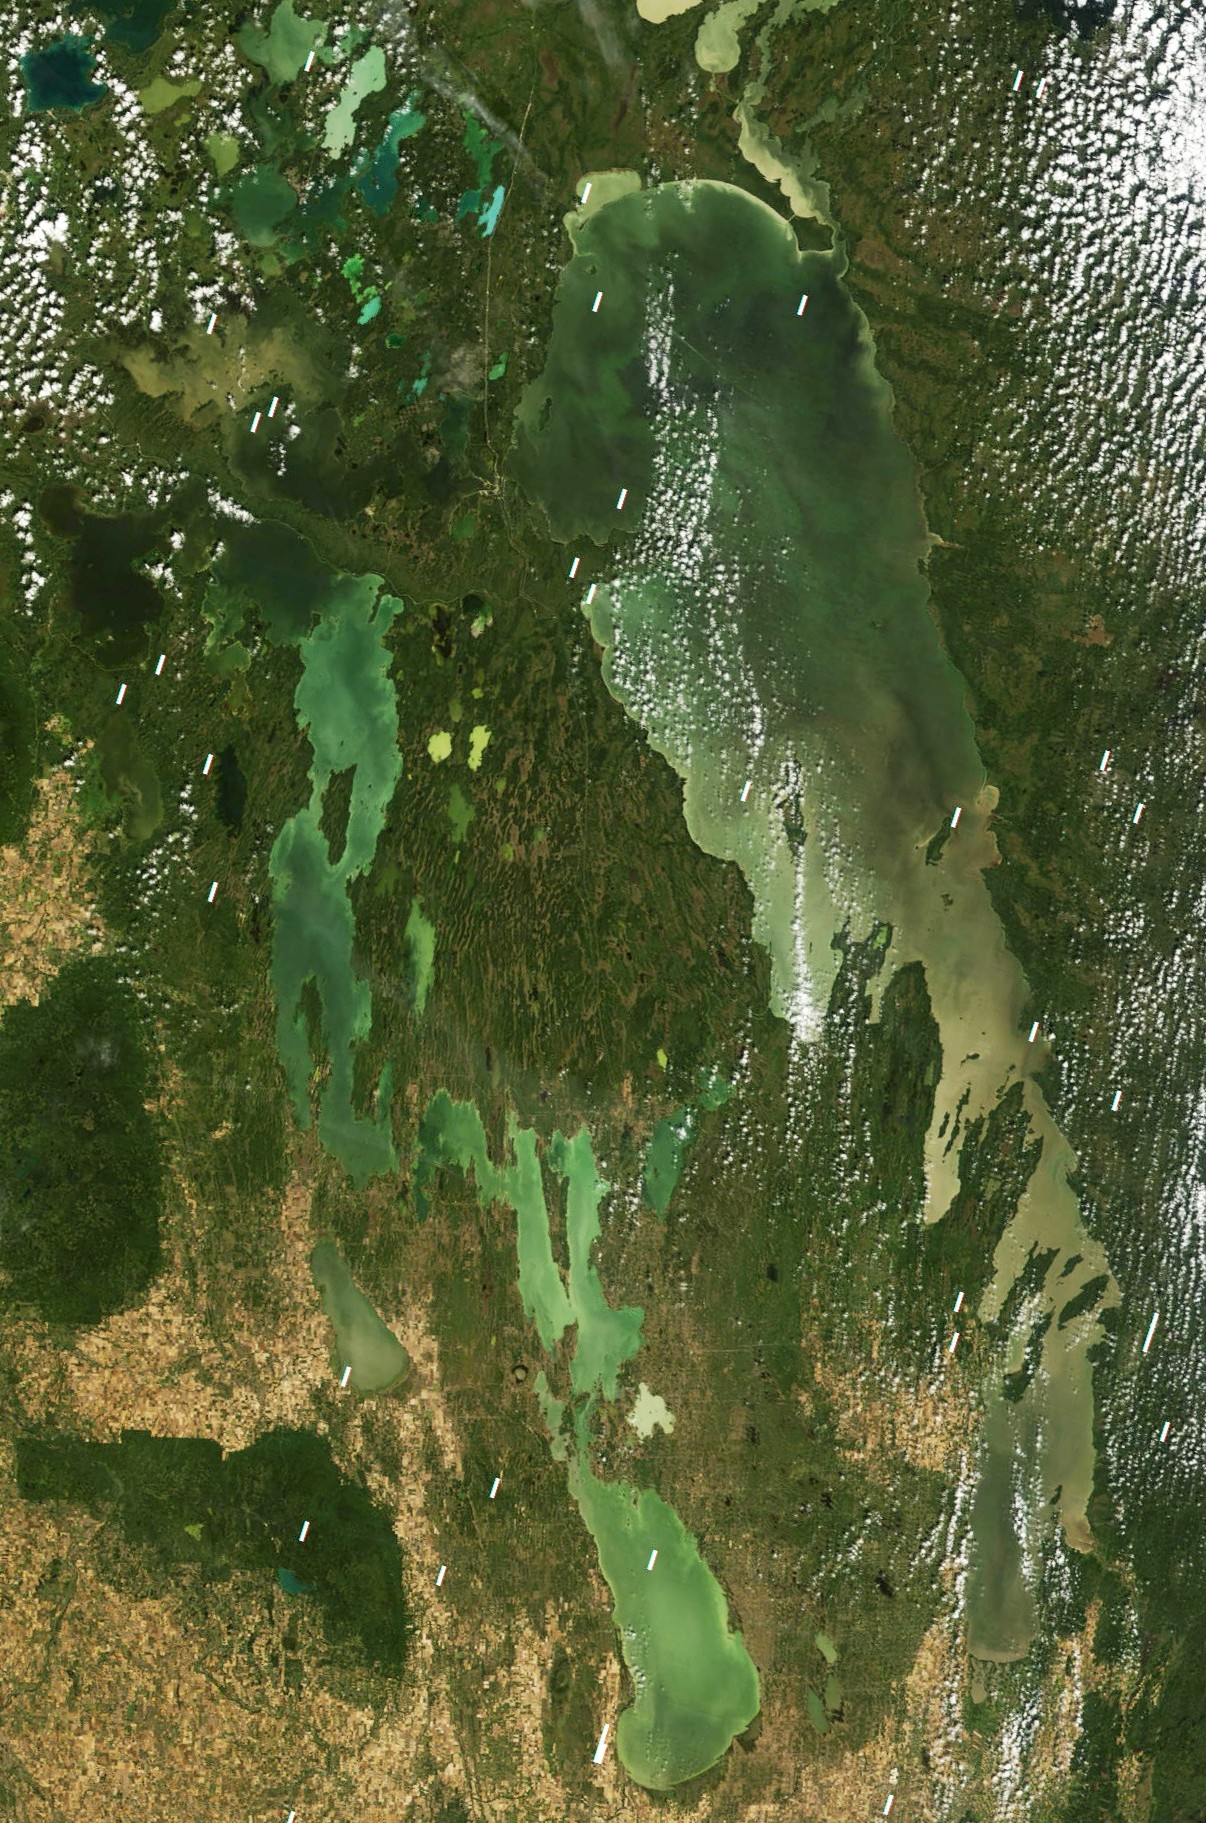
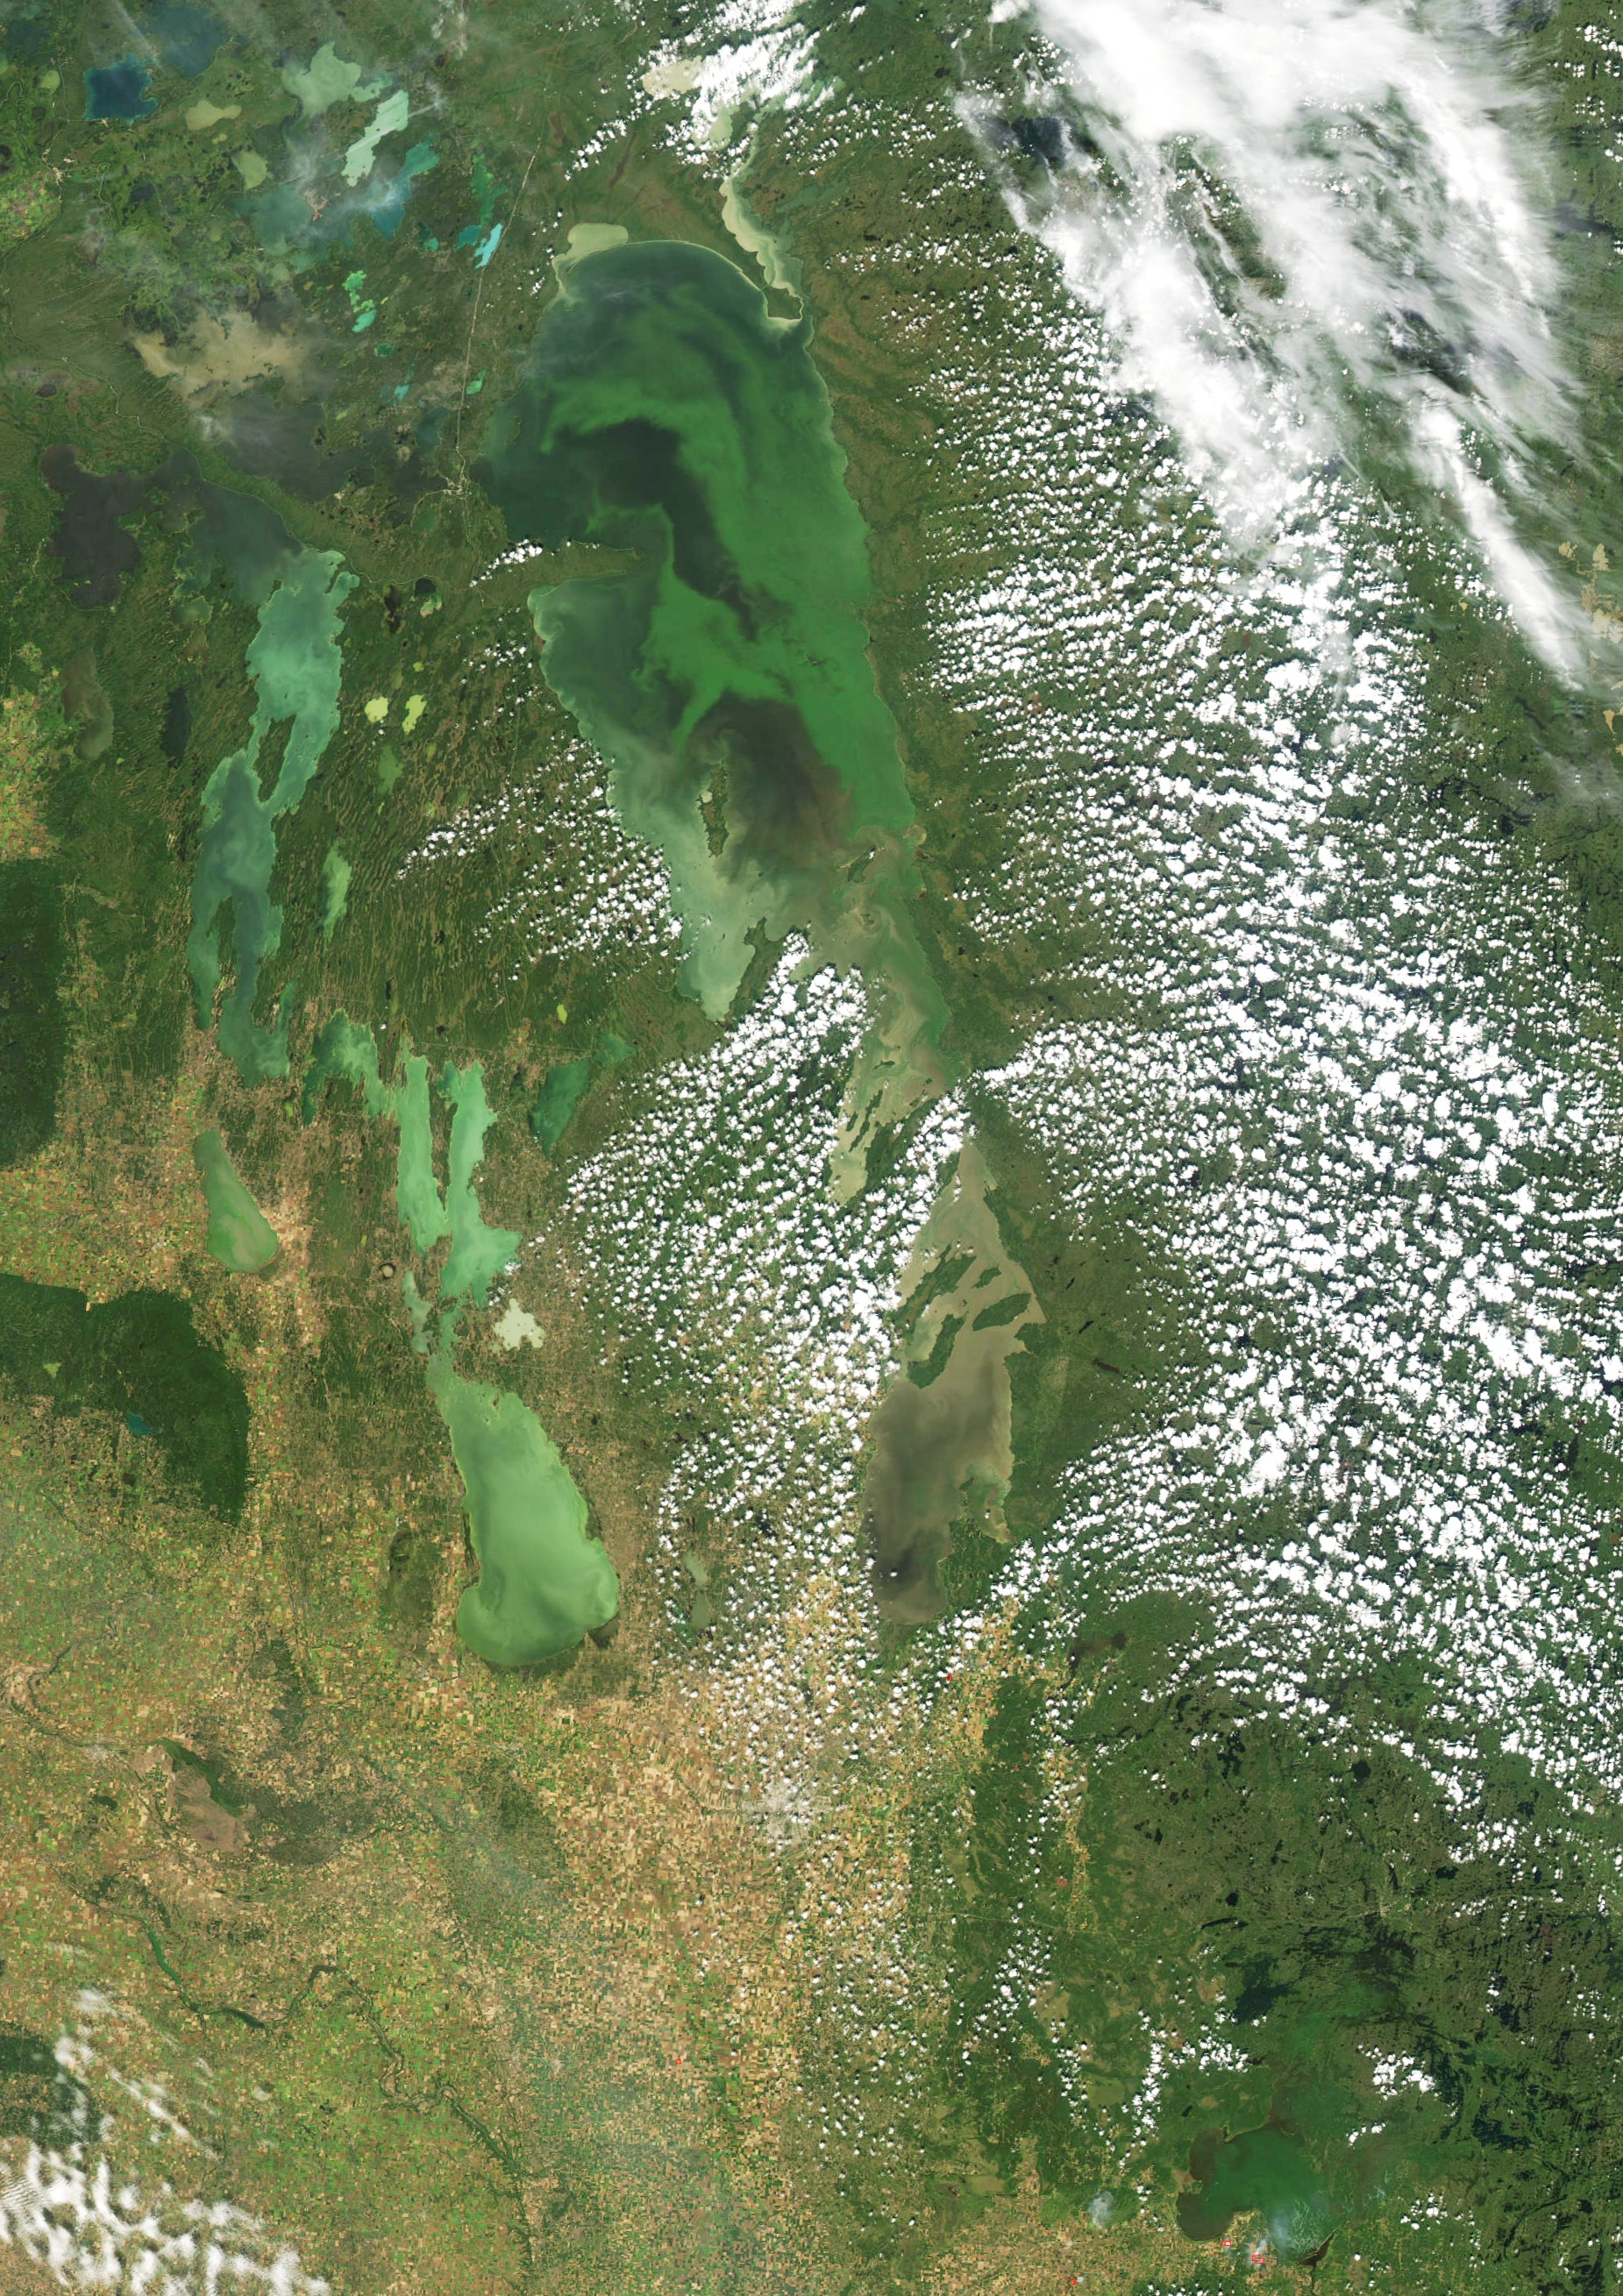
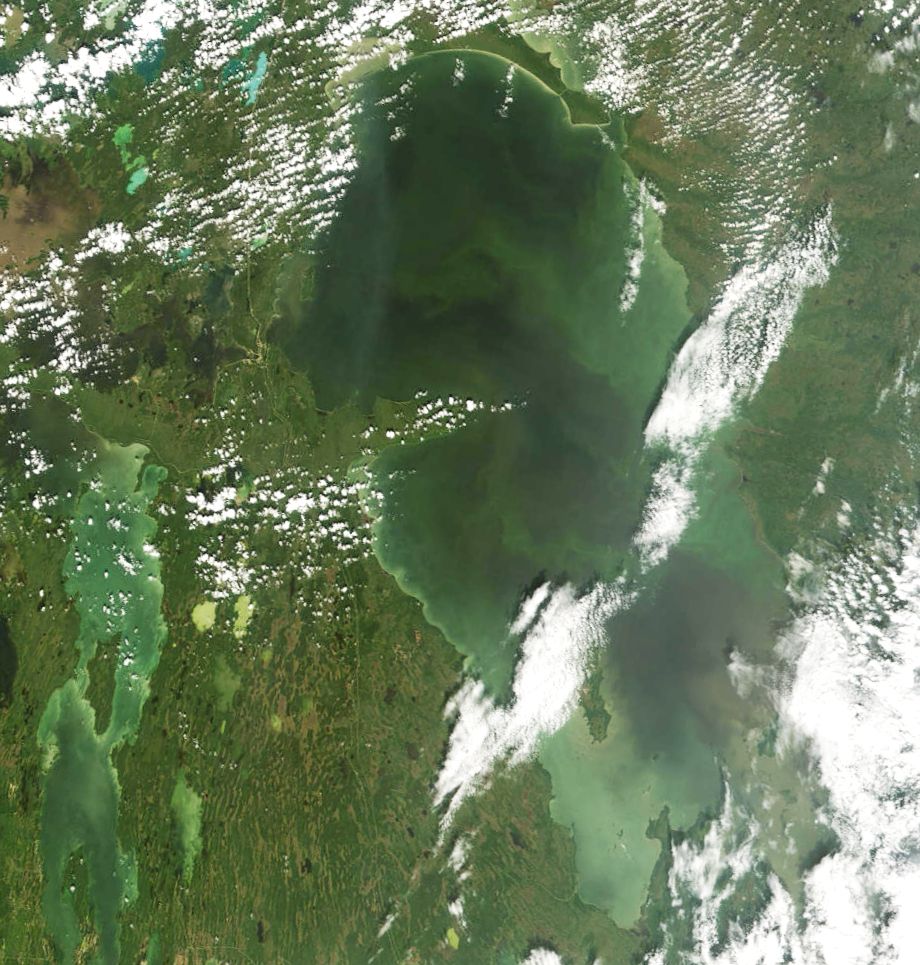
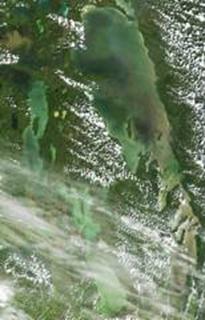
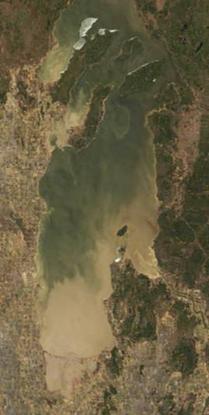
The satellite images on this page were recorded
by the Moderate Resolution Imaging Spectroradiometer (MODIS) now orbiting
aboard two of NASA’s satellites, Terra and Aqua. Unless otherwise noted, the actual colour
renditions were prepared by the MODIS Rapid Response Team out of the University
of Maryland who provide near-real time colour composite images on their web
site http://rapidfire.sci.gsfc.nasa.gov/realtime/ -- except that I have changed the tone curve to emphasize colour
differences in the lake, at the expense of brighter areas like clouds.
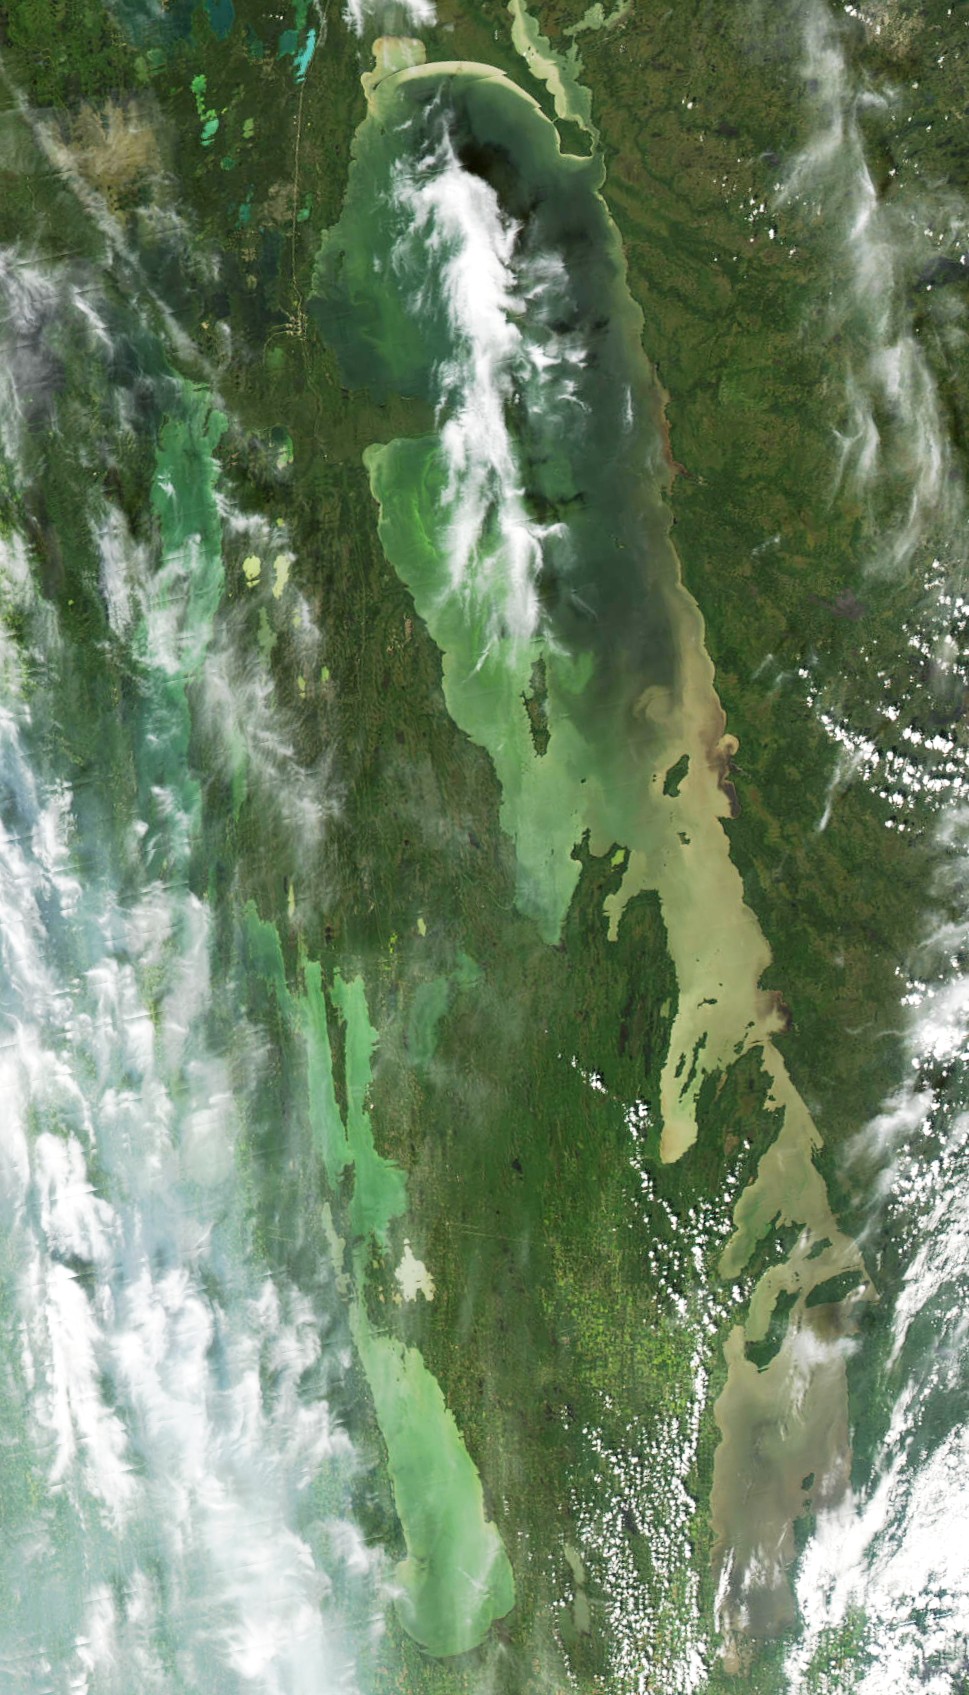
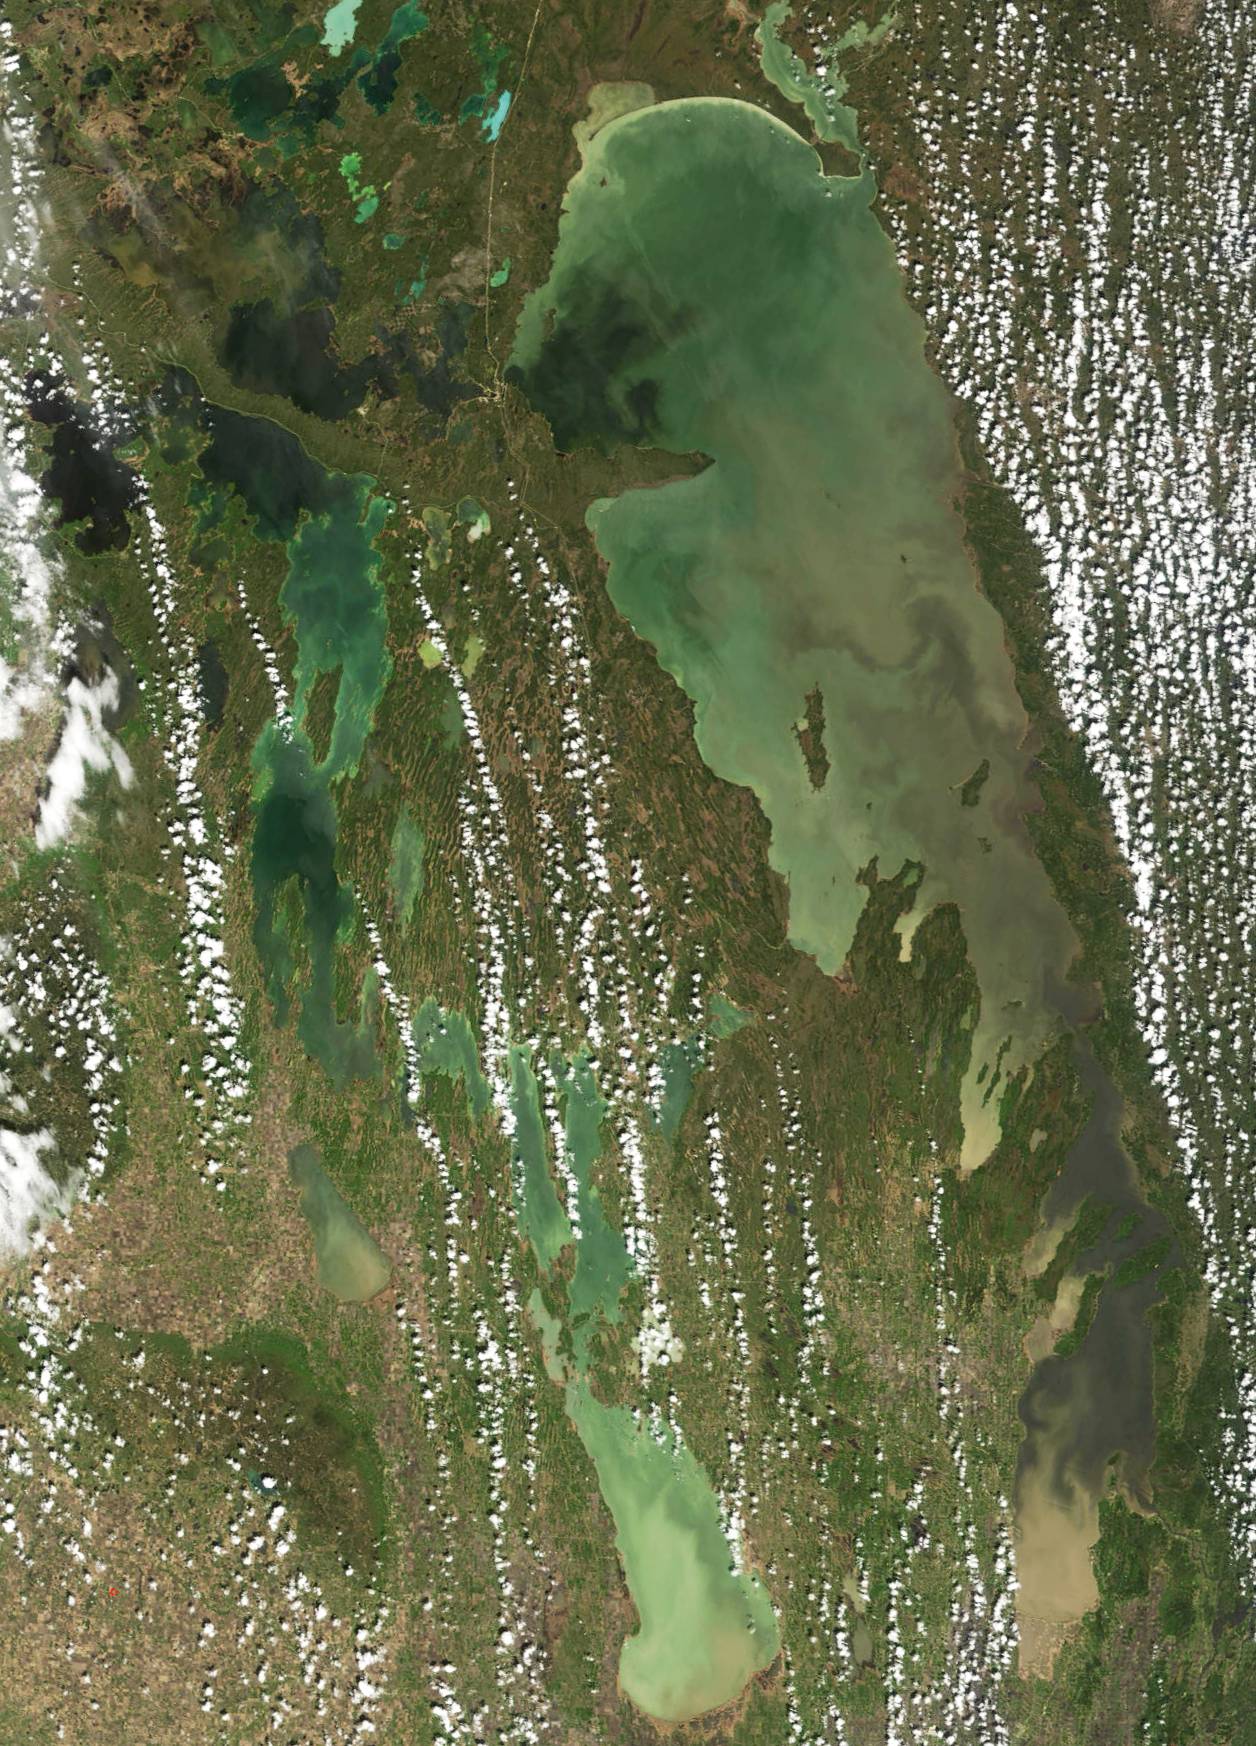
They are RGB colour composites of MODIS 250-m
resolution data with Channel 1 (670 nm) displayed as red, and Channel 4 (565
nm) as green and Channel 3 (479 nm) as blue, i.e. approximating colour as
people perceive it, except with the colour contrast a bit exaggerated. The brightest greens in the water in these
images are indicative of algal blooms
(see for instance the bright greens at the north end of the lake in this image
recorded on the 3rd of August
2004) but a bit of "greenness" is not necessarily due to algae at
all. That's because as the lake varies
from clear thru low to moderate to high mineral sediment concentration, the
change in relative spectral attenuation of light in the water column causes
reflected colours to shift from dark blue-black (clear water, most of the
incident light absorbed, only a bit of blue reflected) through darker
blues to green to the greenish-browns
and tan (turbid water, reflecting a wide mixture of colours,
"brownish" to our eyes).
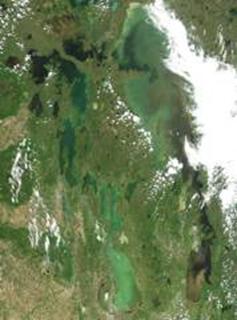
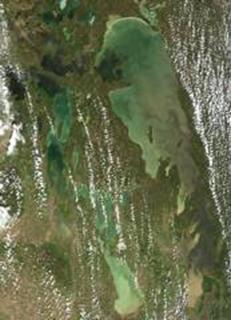
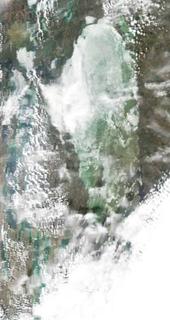
Click on
each underlined date below to view a larger copy of the image.
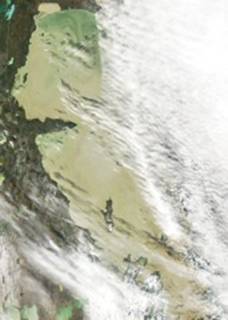
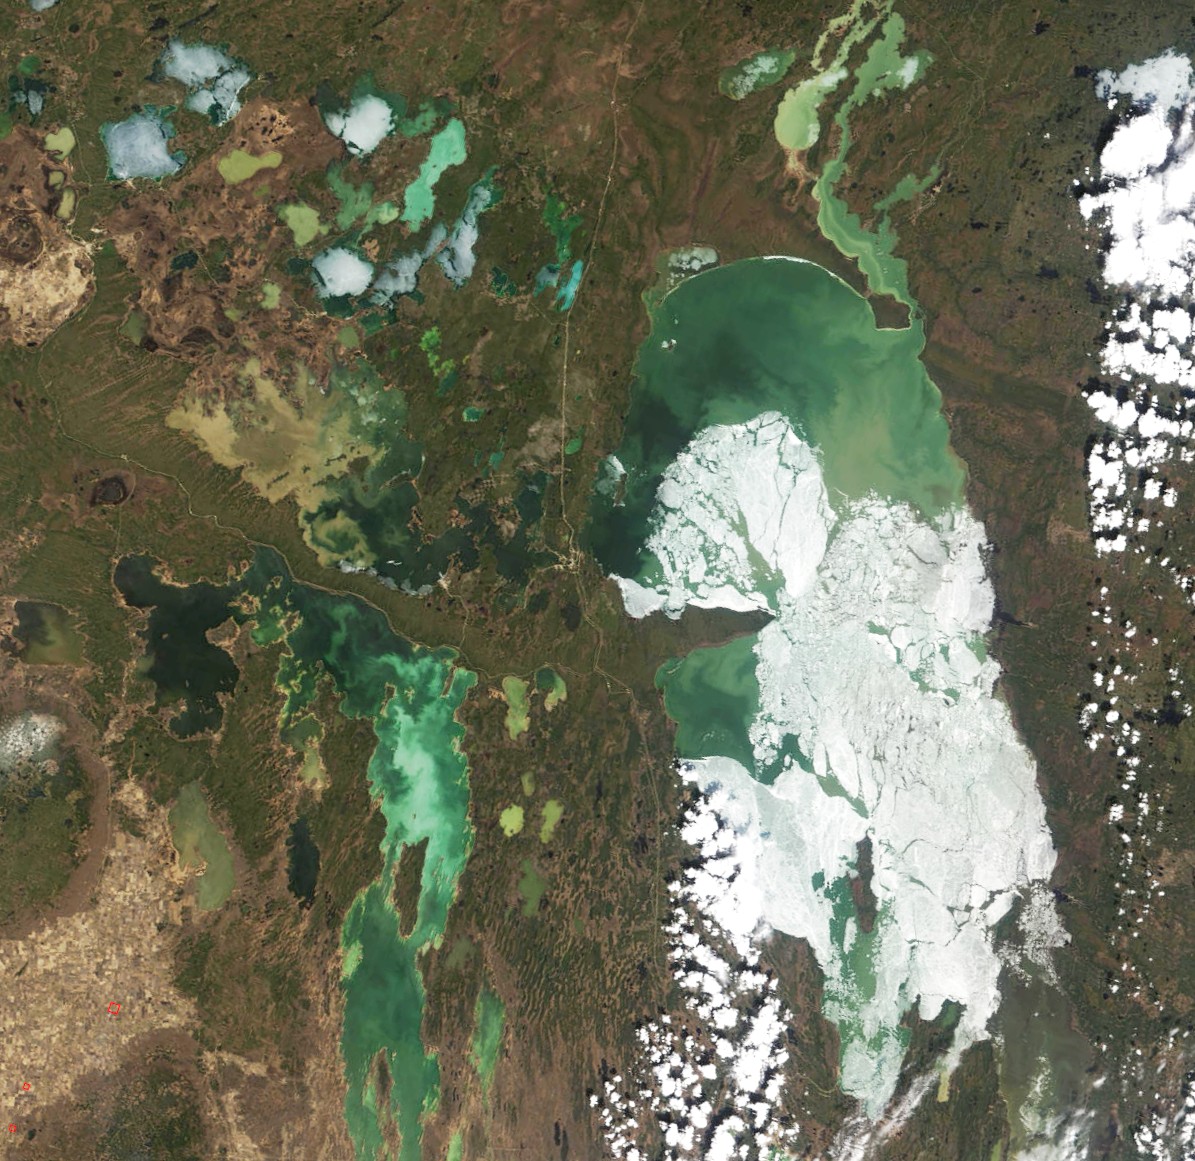
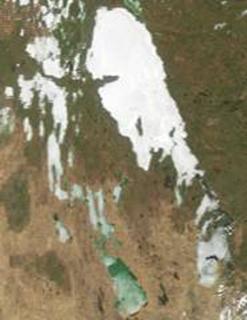
13:20 19 July 2007 12:25 20 July 2007 14:00 22 July 2007
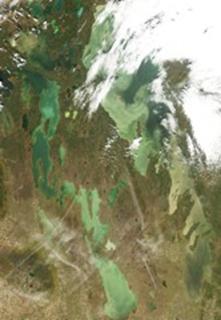
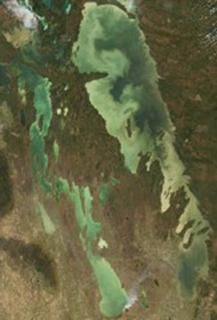
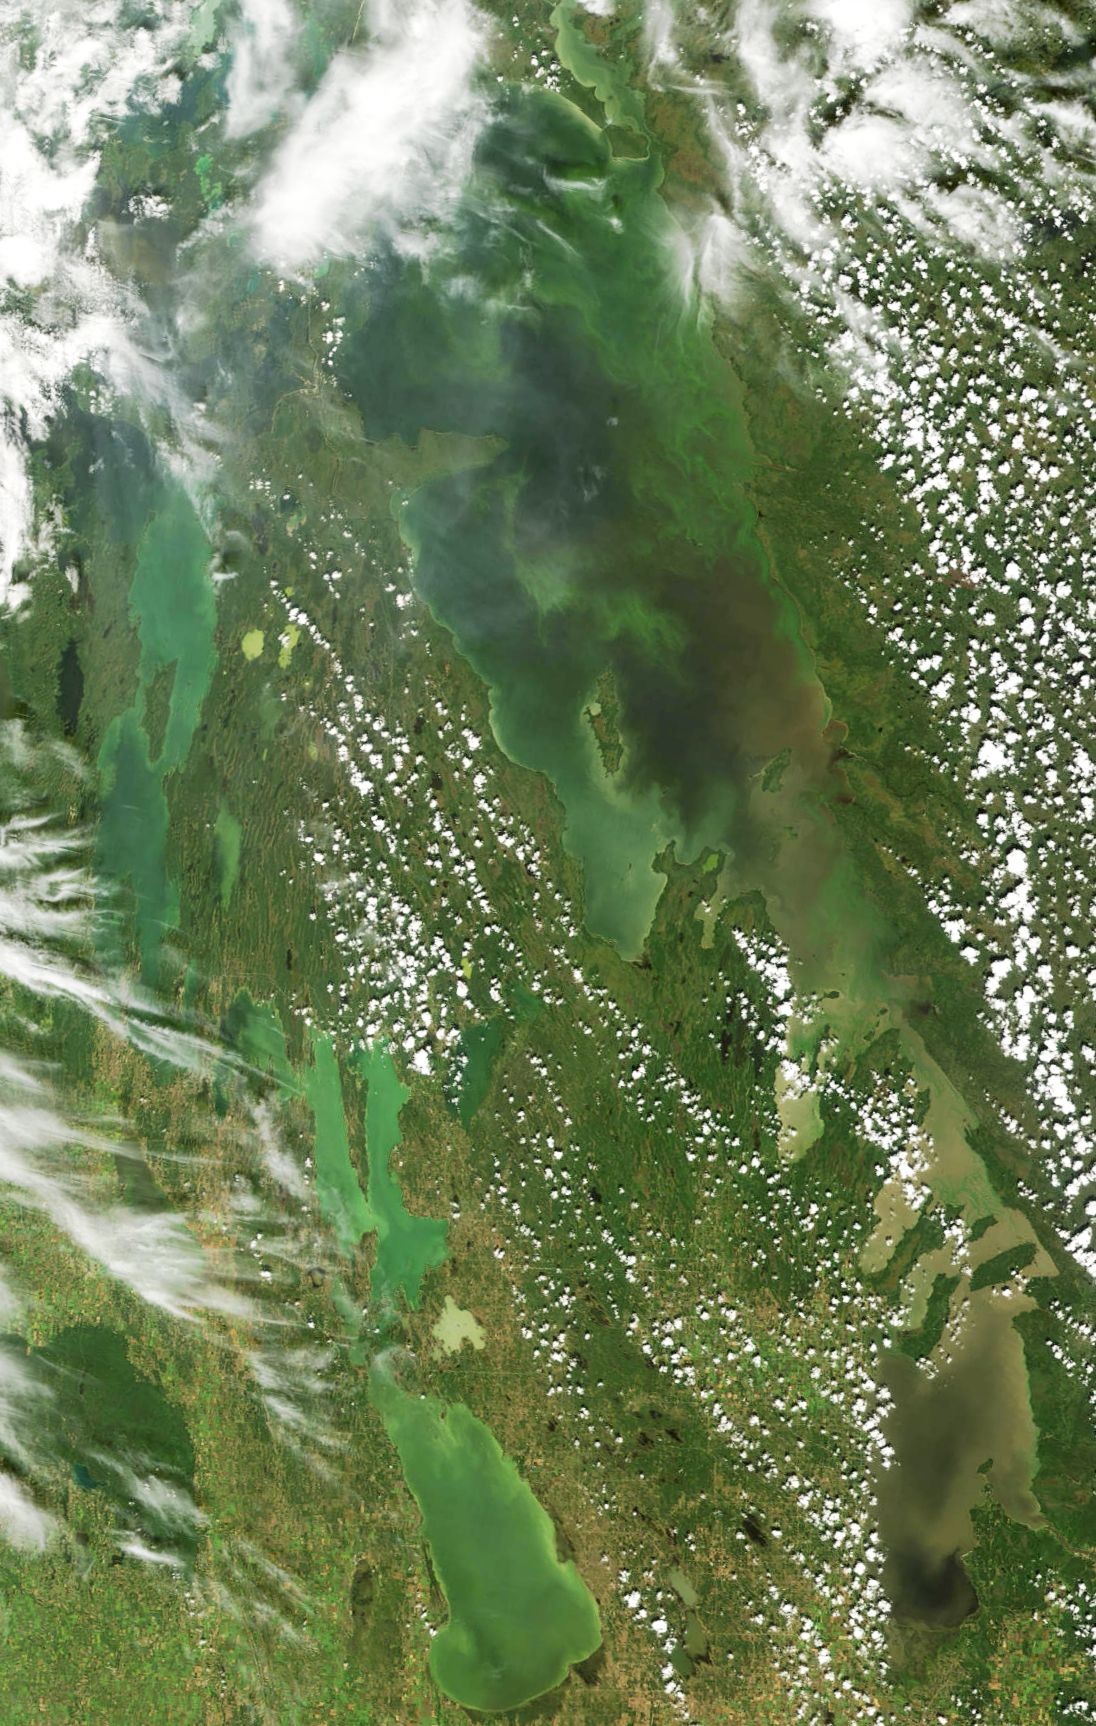
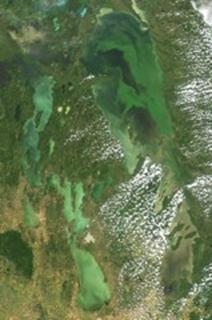
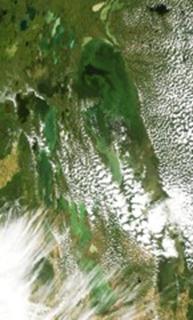
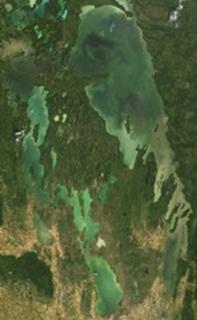
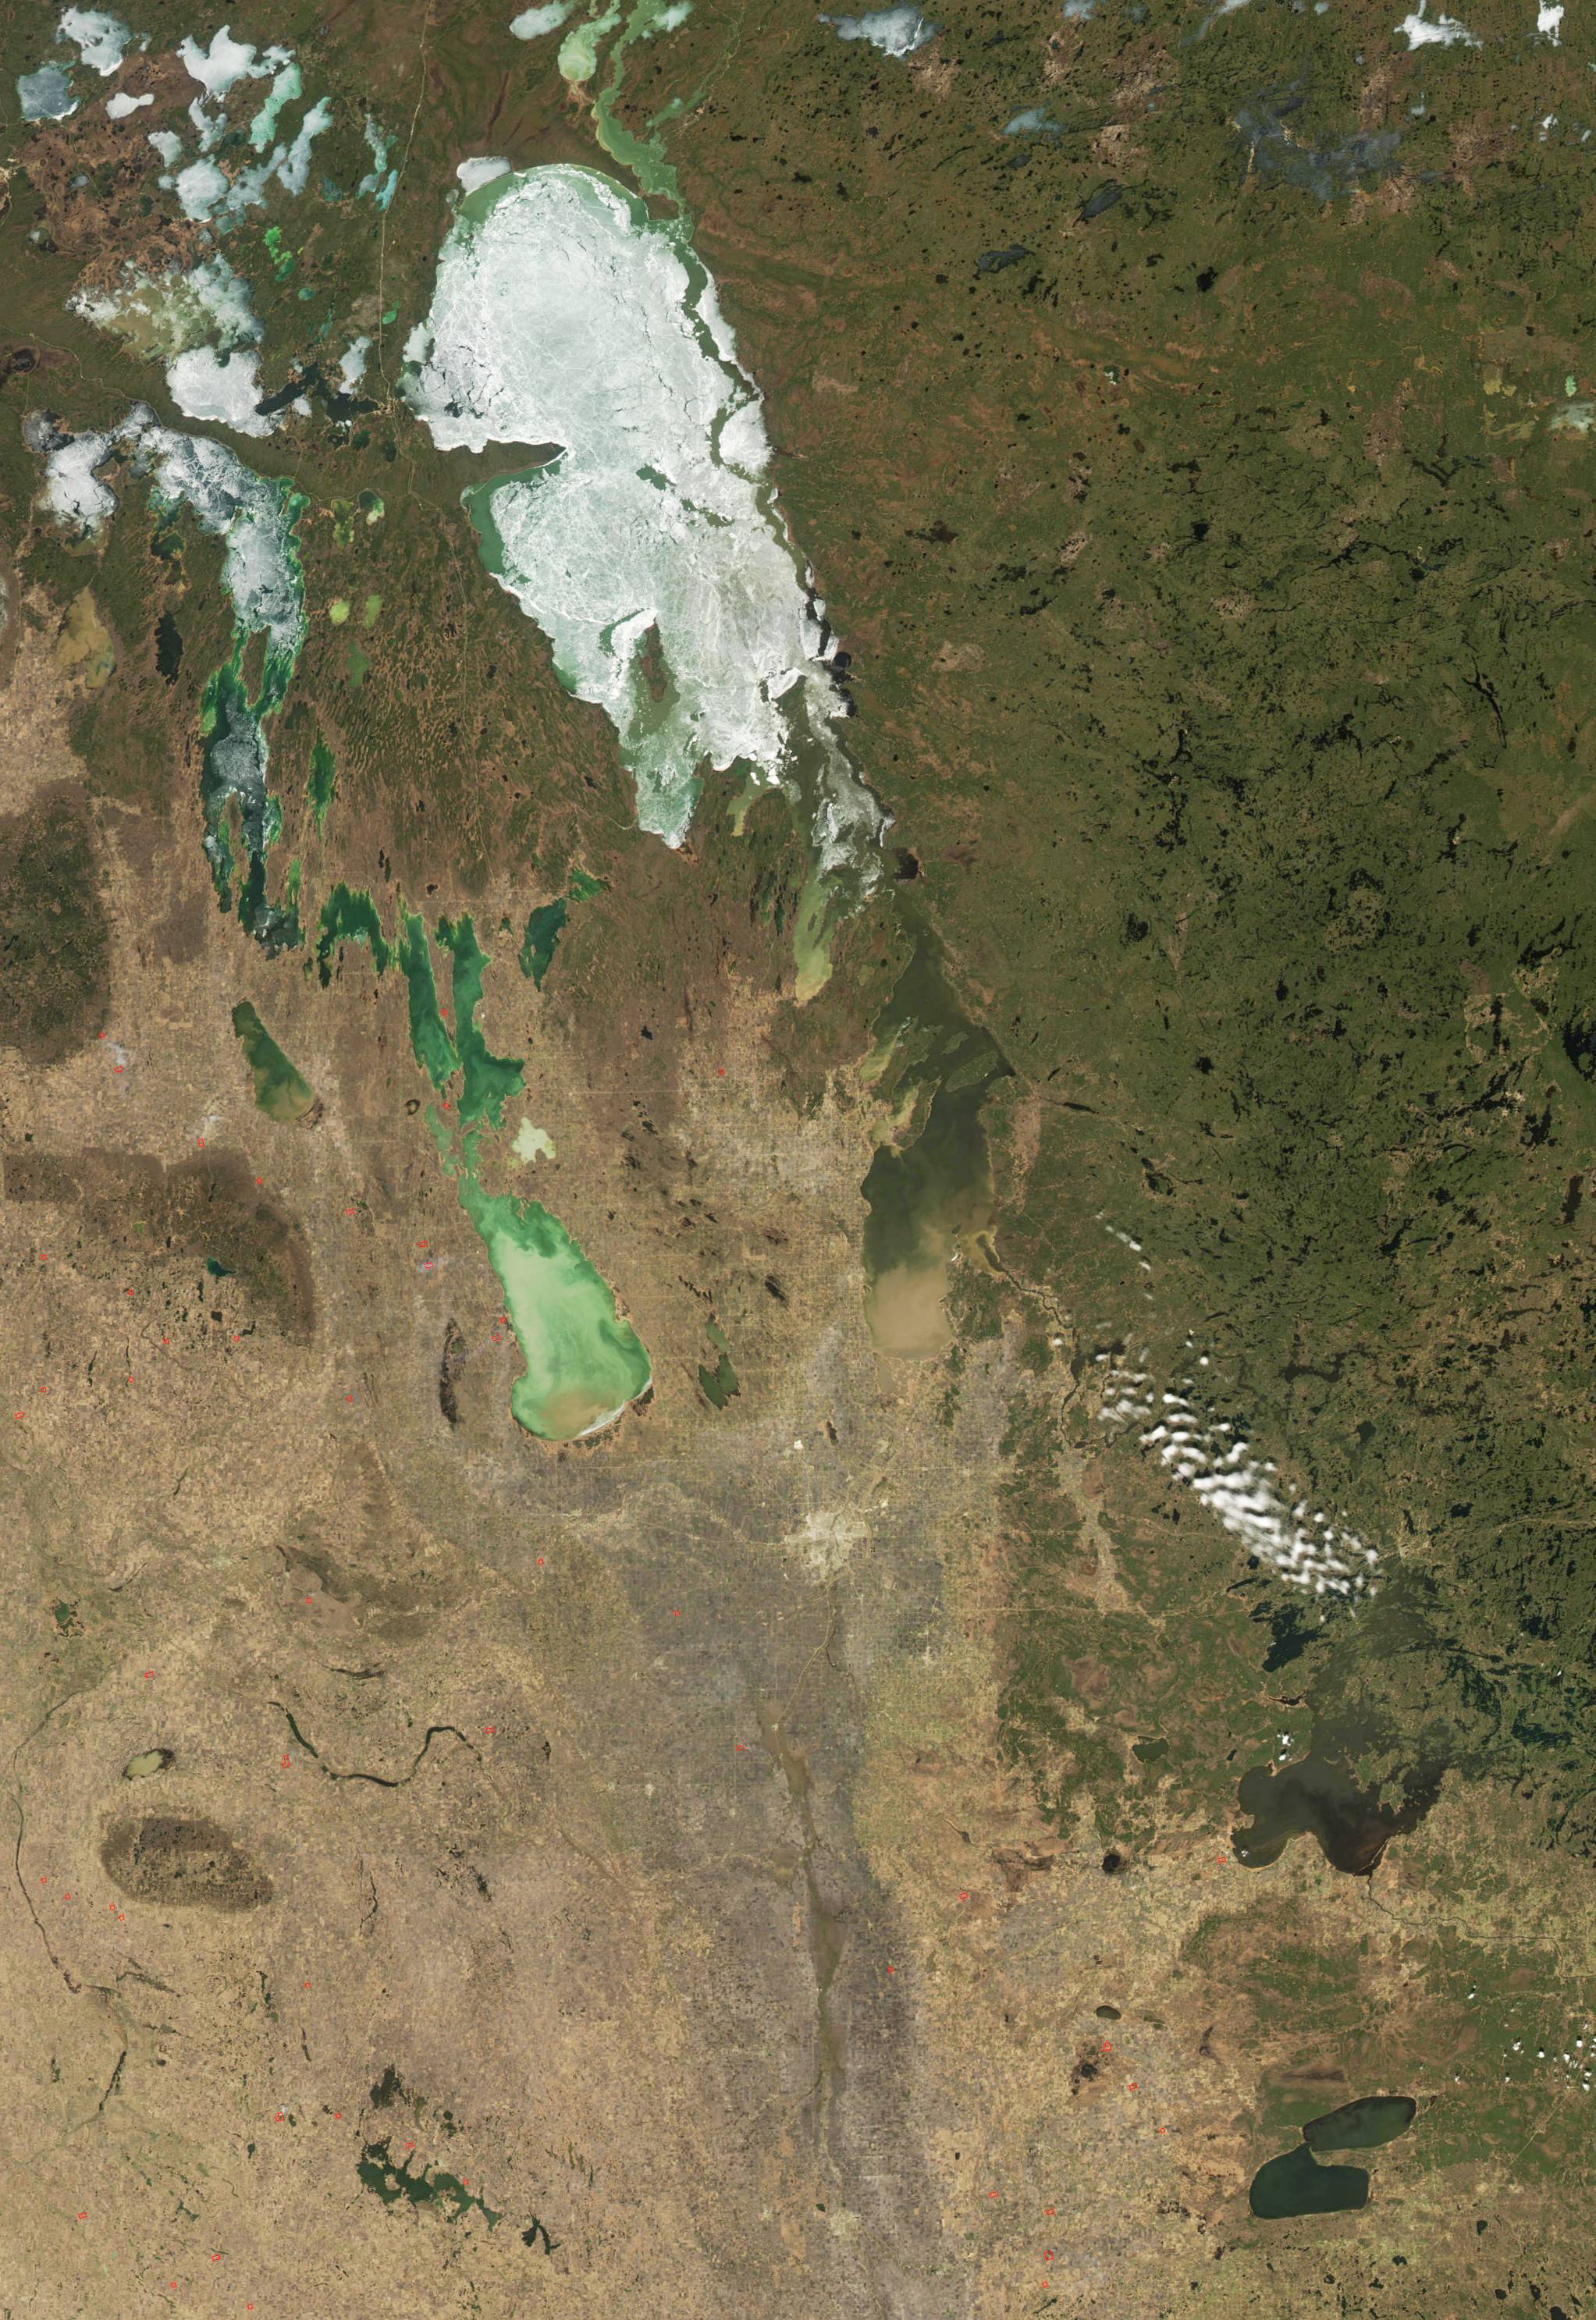
The
first surface blooms of summer are starting to develop now – look for the very
bright yellow-green in the North Basin, south of Long Point and just to the
left of the clouds on the 22nd of July, above. Judging by the widespread green covering most
of the eastern half of the North Basin on the 19th, extensive
surface blooms will probably develop there in the next few days – if it remains
as hot as today – in the mid-30s (Celsius) and the lake is calm enough. You can see bright green in the more turbid
water in Fisher Bay in the Narrows region, and along the east shore of, and to
the north of Grindstone Point.
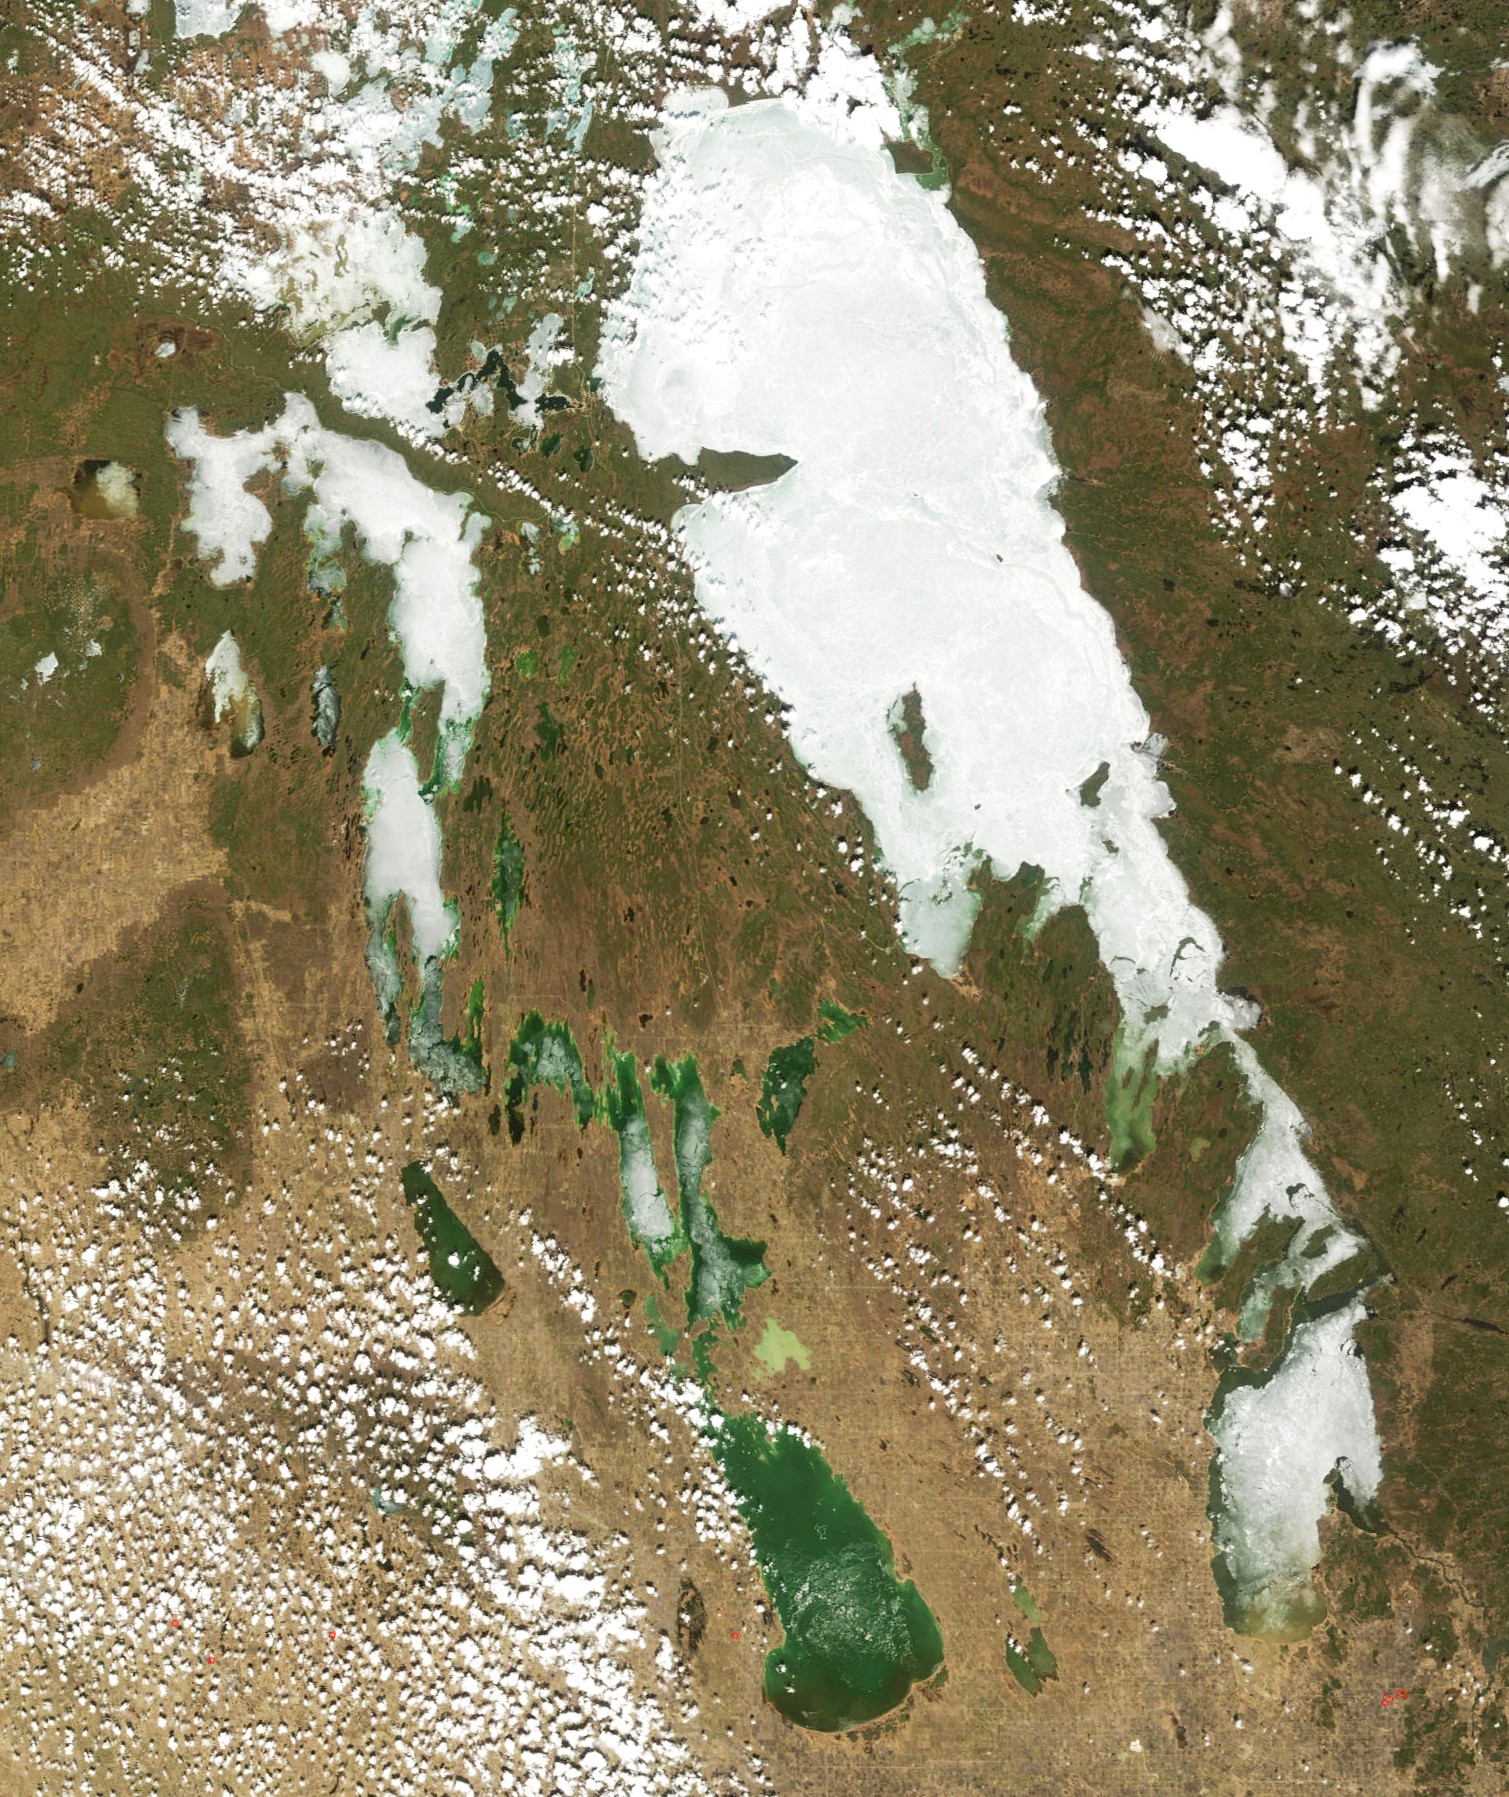

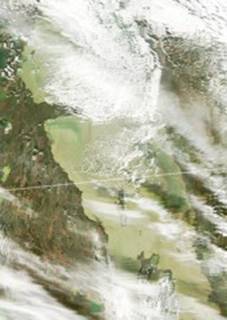
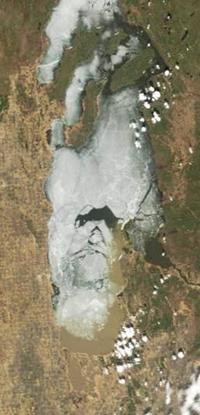
A
lot of ice has disappeared from the South Basin over the last couple of
days. Its been warm, but not especially
warm. Wind was surely a bigger factor. We’ve had NW and NNW winds up to 30-45 km/h a
few times over the last few days – a few gusts over 60 km/h. The winds probably explain the muddy water
along the SE shore of the South Basin, too – muddier than we might have
expected so soon after the ice broke up.
What’s left in the South Basin looks really rotten; it will go
quickly. The winds had an effect on the
North Basin, too. Still lots of ice
there, but leads have opened up where wind-shifted ice came up against
islands. That’s what would have created
that great open lead from the end of Long Point to the east shore. It follows a winding path, but that path goes
right through Sand and Georges Island out there in the centre of the basin. Ice to the north was too solid to be pushed
south through the islands, but there must have been enough open water and weak
ice at the south end so that everything south of the islands could be shifted a
few kilometres by the wind. And so a
great crack opened up right across the lake.
There must have been some great grinding and cracking to be heard.

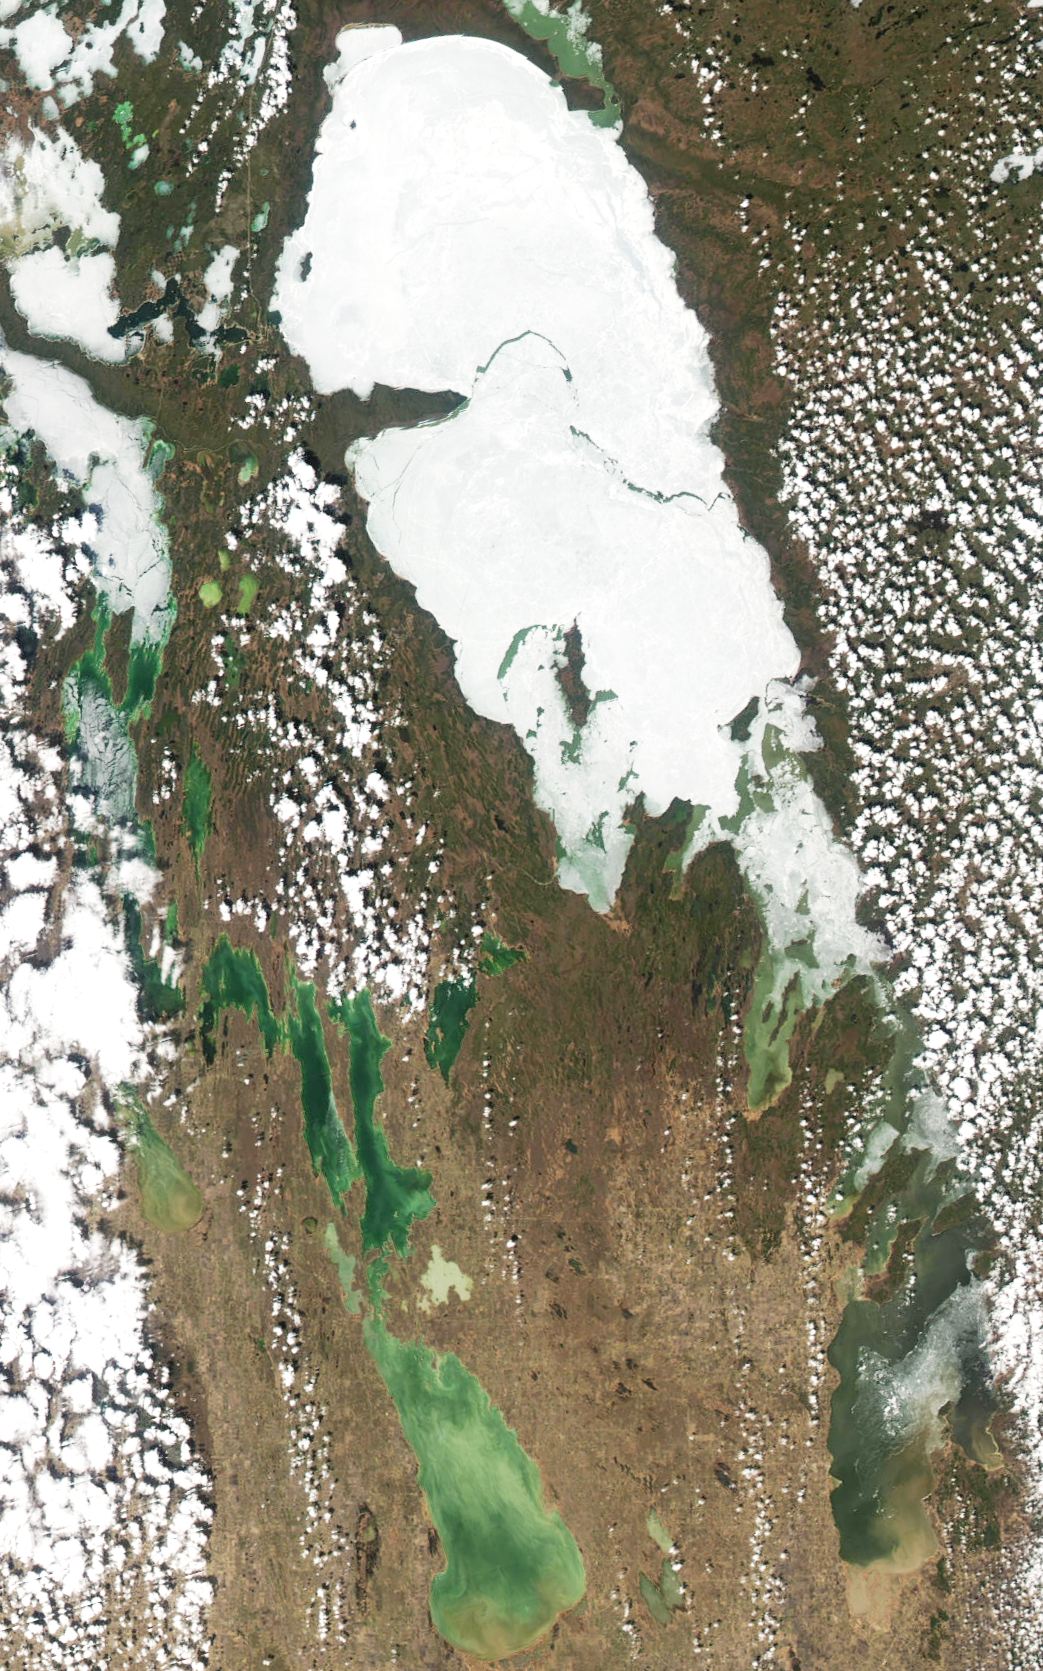
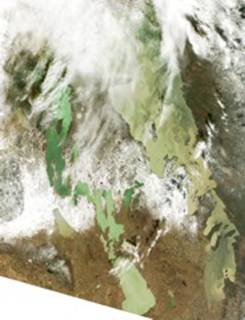
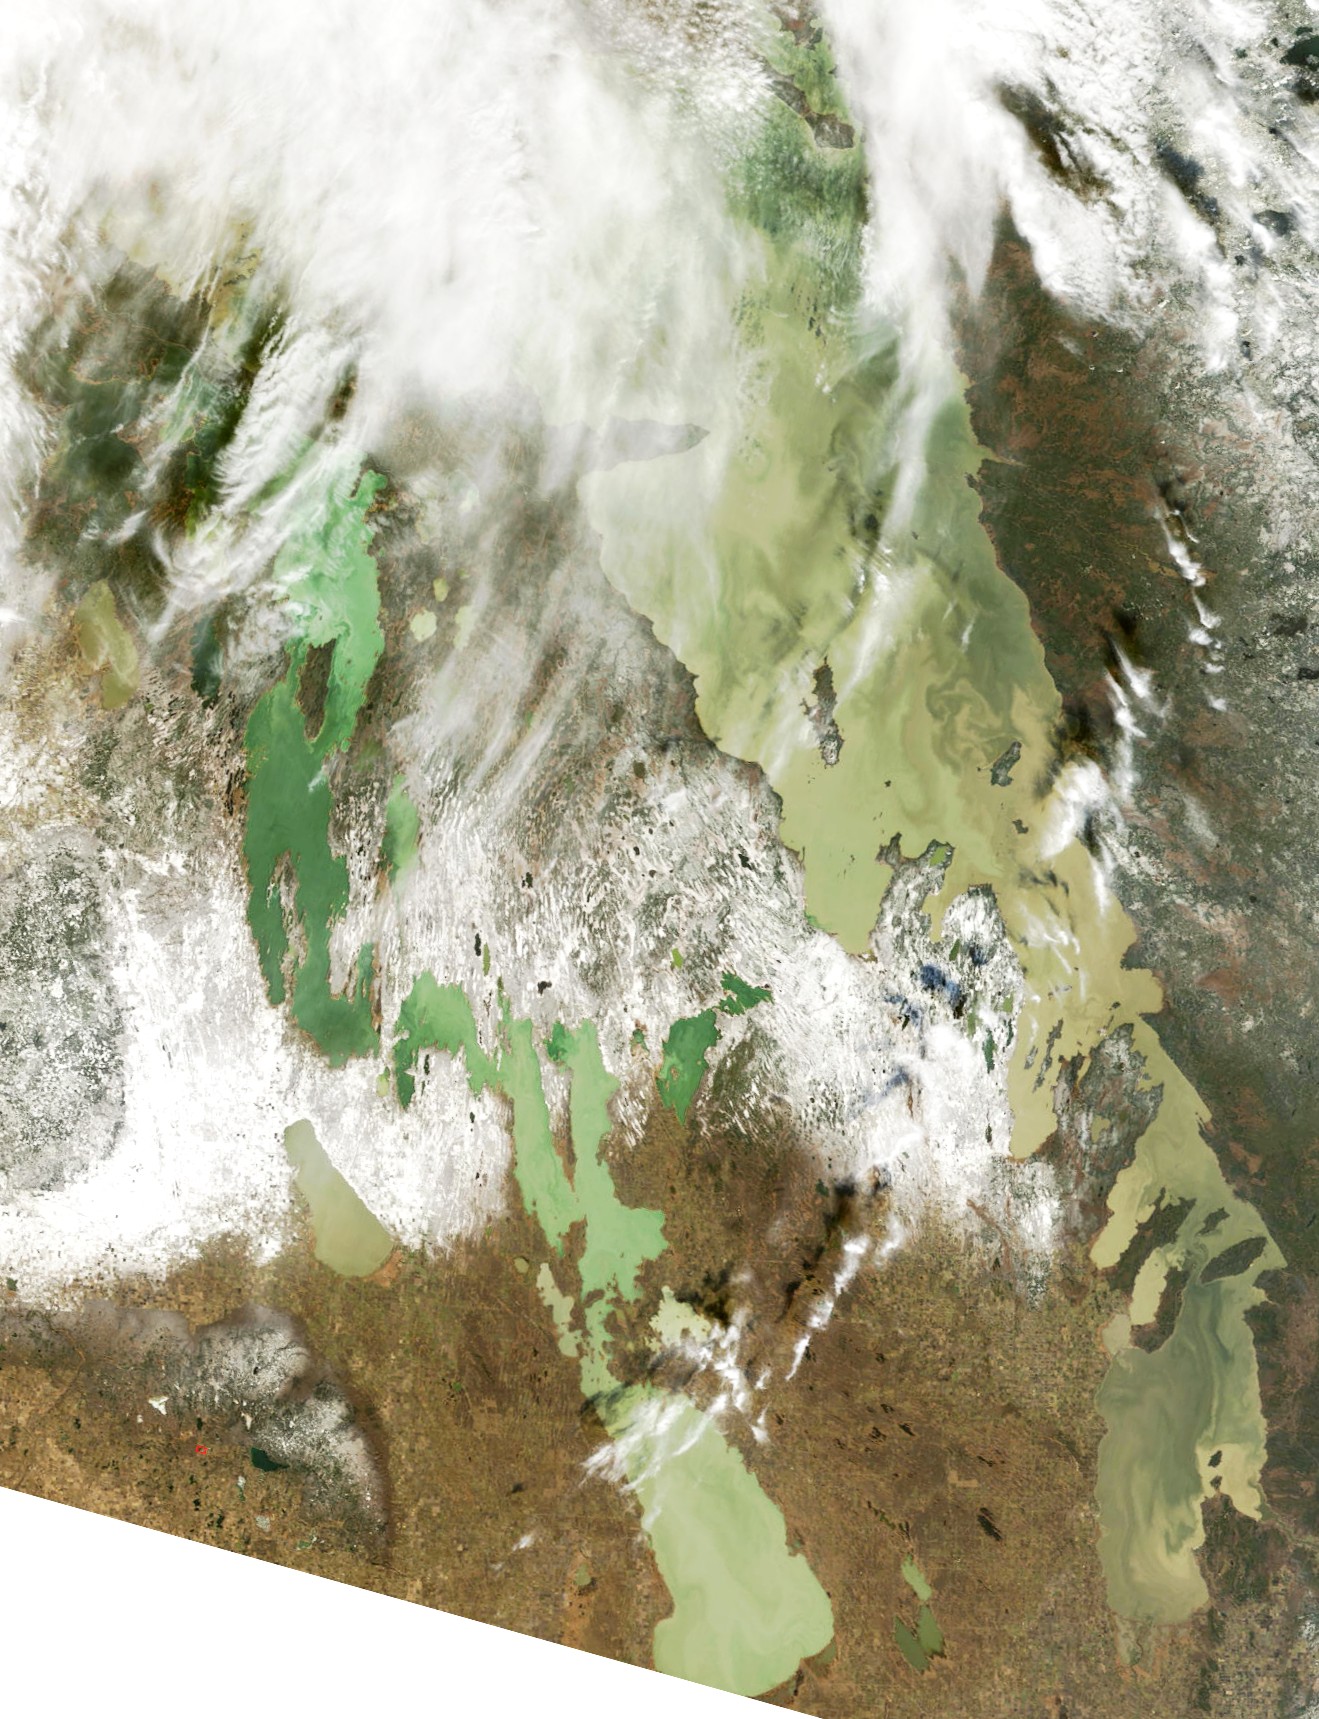
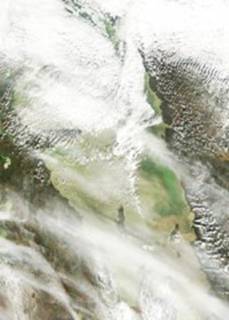
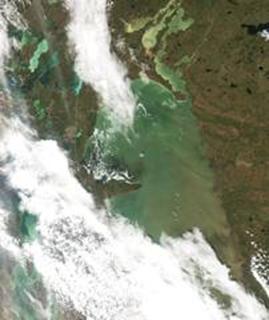
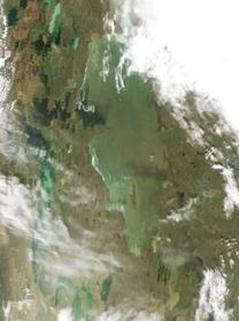
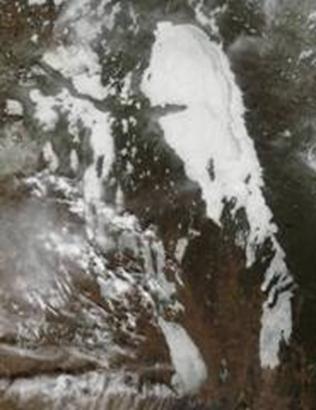
24&29 April 2007
12:40 29 April 2007
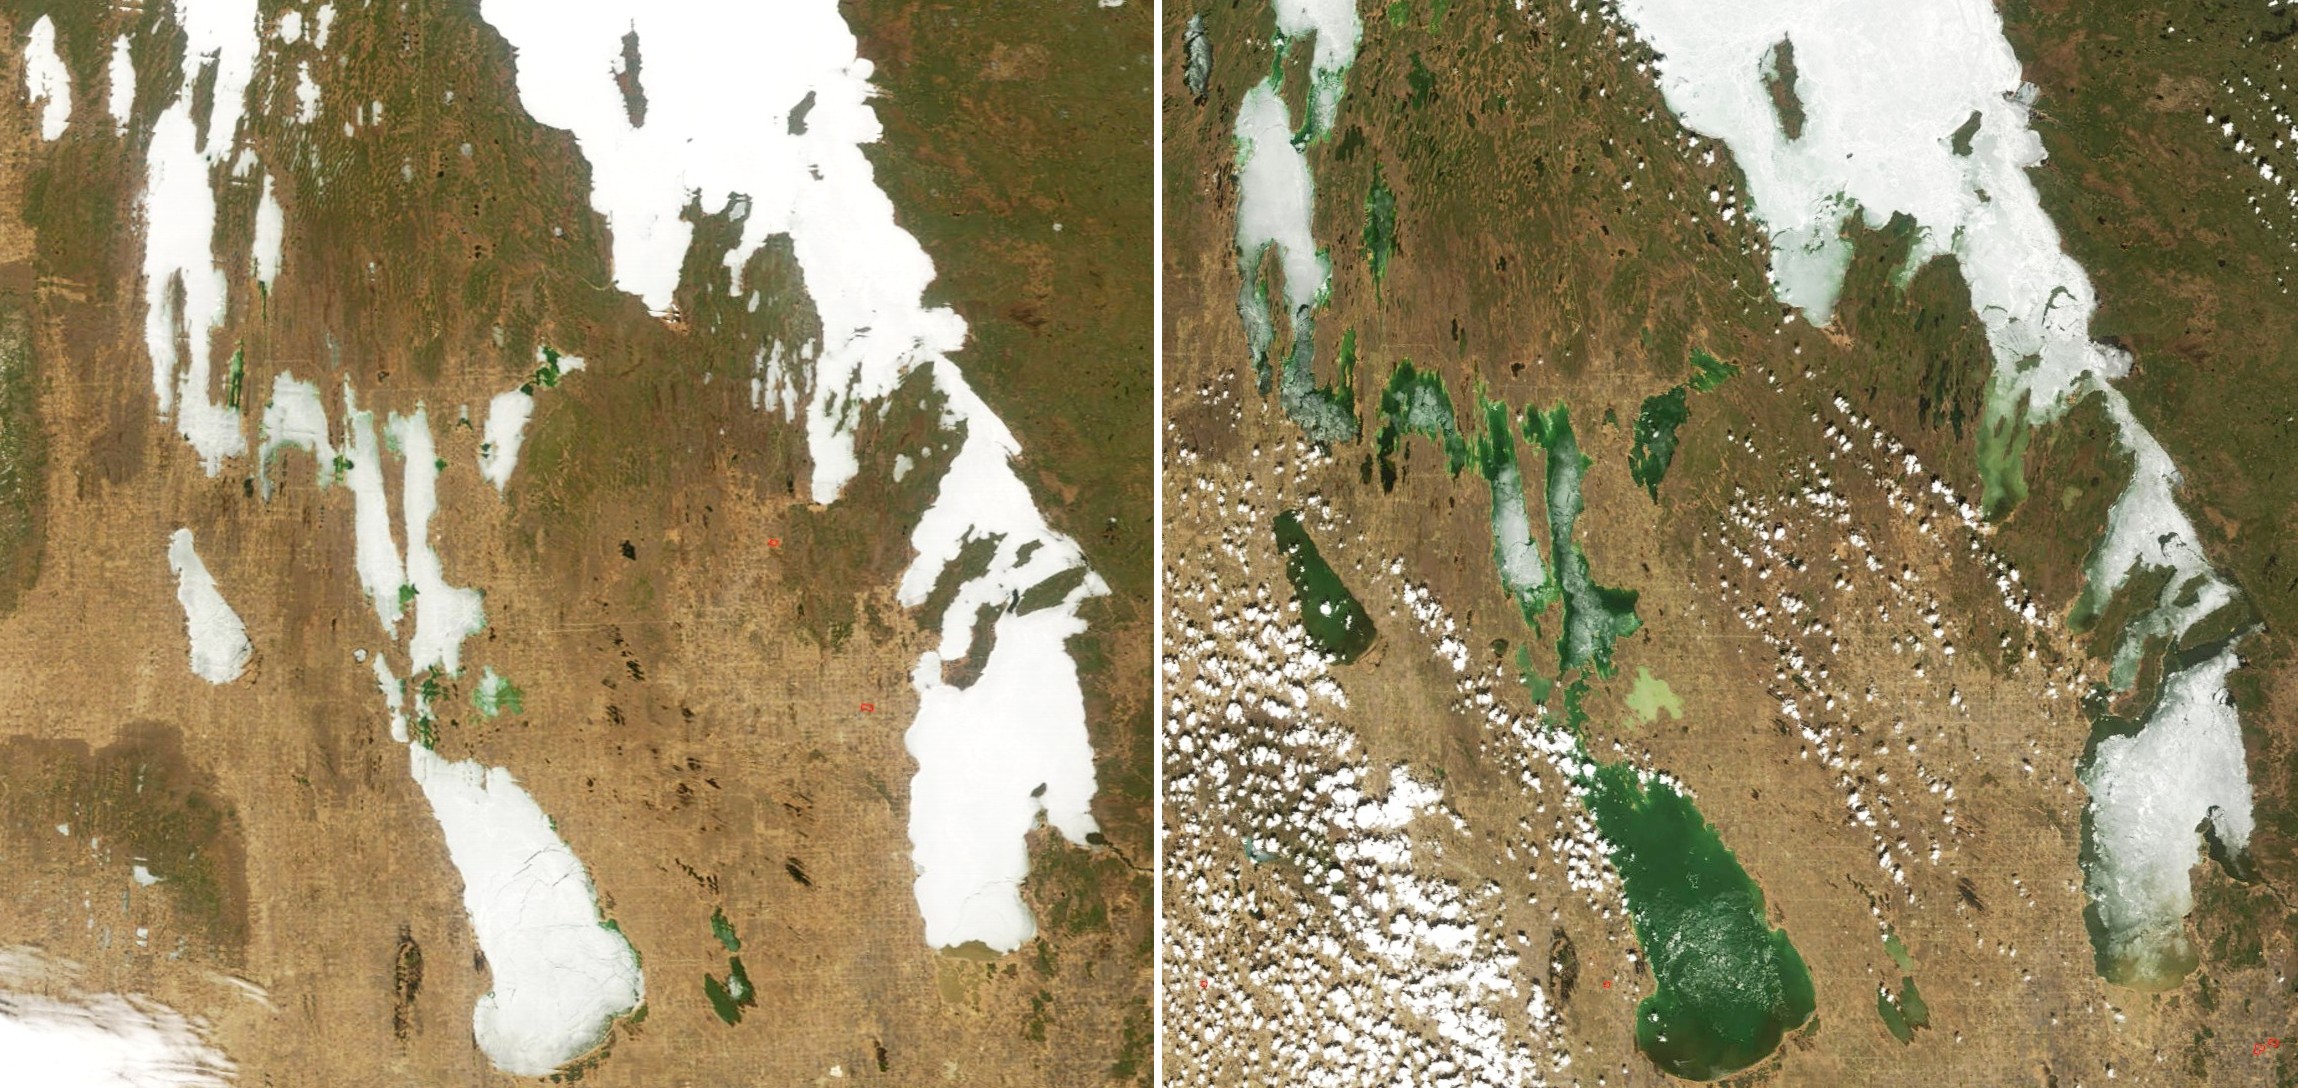
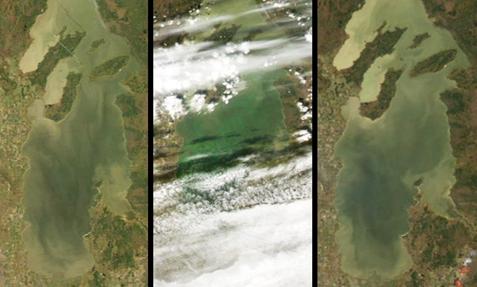
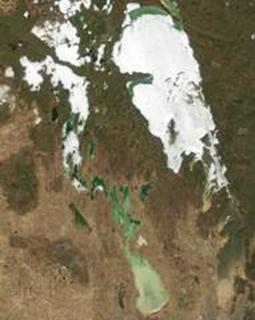
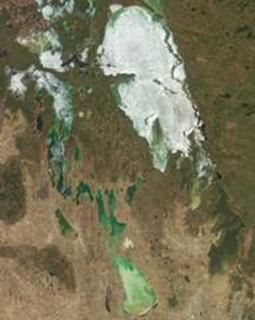
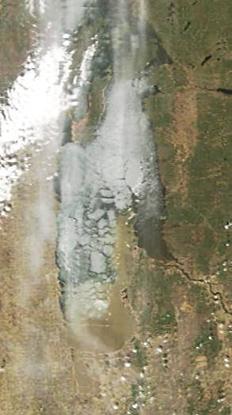
Breakup of the ice cover on the South
Basin started in earnest this week. It’s a little later than in last year and the year before
– in both 2005 and 2006 the South Basin
was open by the 24th of April (scroll down to the bottom of this page for
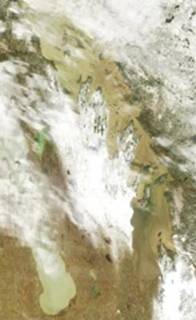
some images). On the 24th
this year (image on the left) the only open water visible was a patch a few
kilometres wide at the south end, where the Red River has been flowing in for
the last couple of weeks, and another in the channels on either side of Black
Island. These open early because
relatively strong currents there melt the ice from below, thinning it so that
it melts earlier than in the open lake.
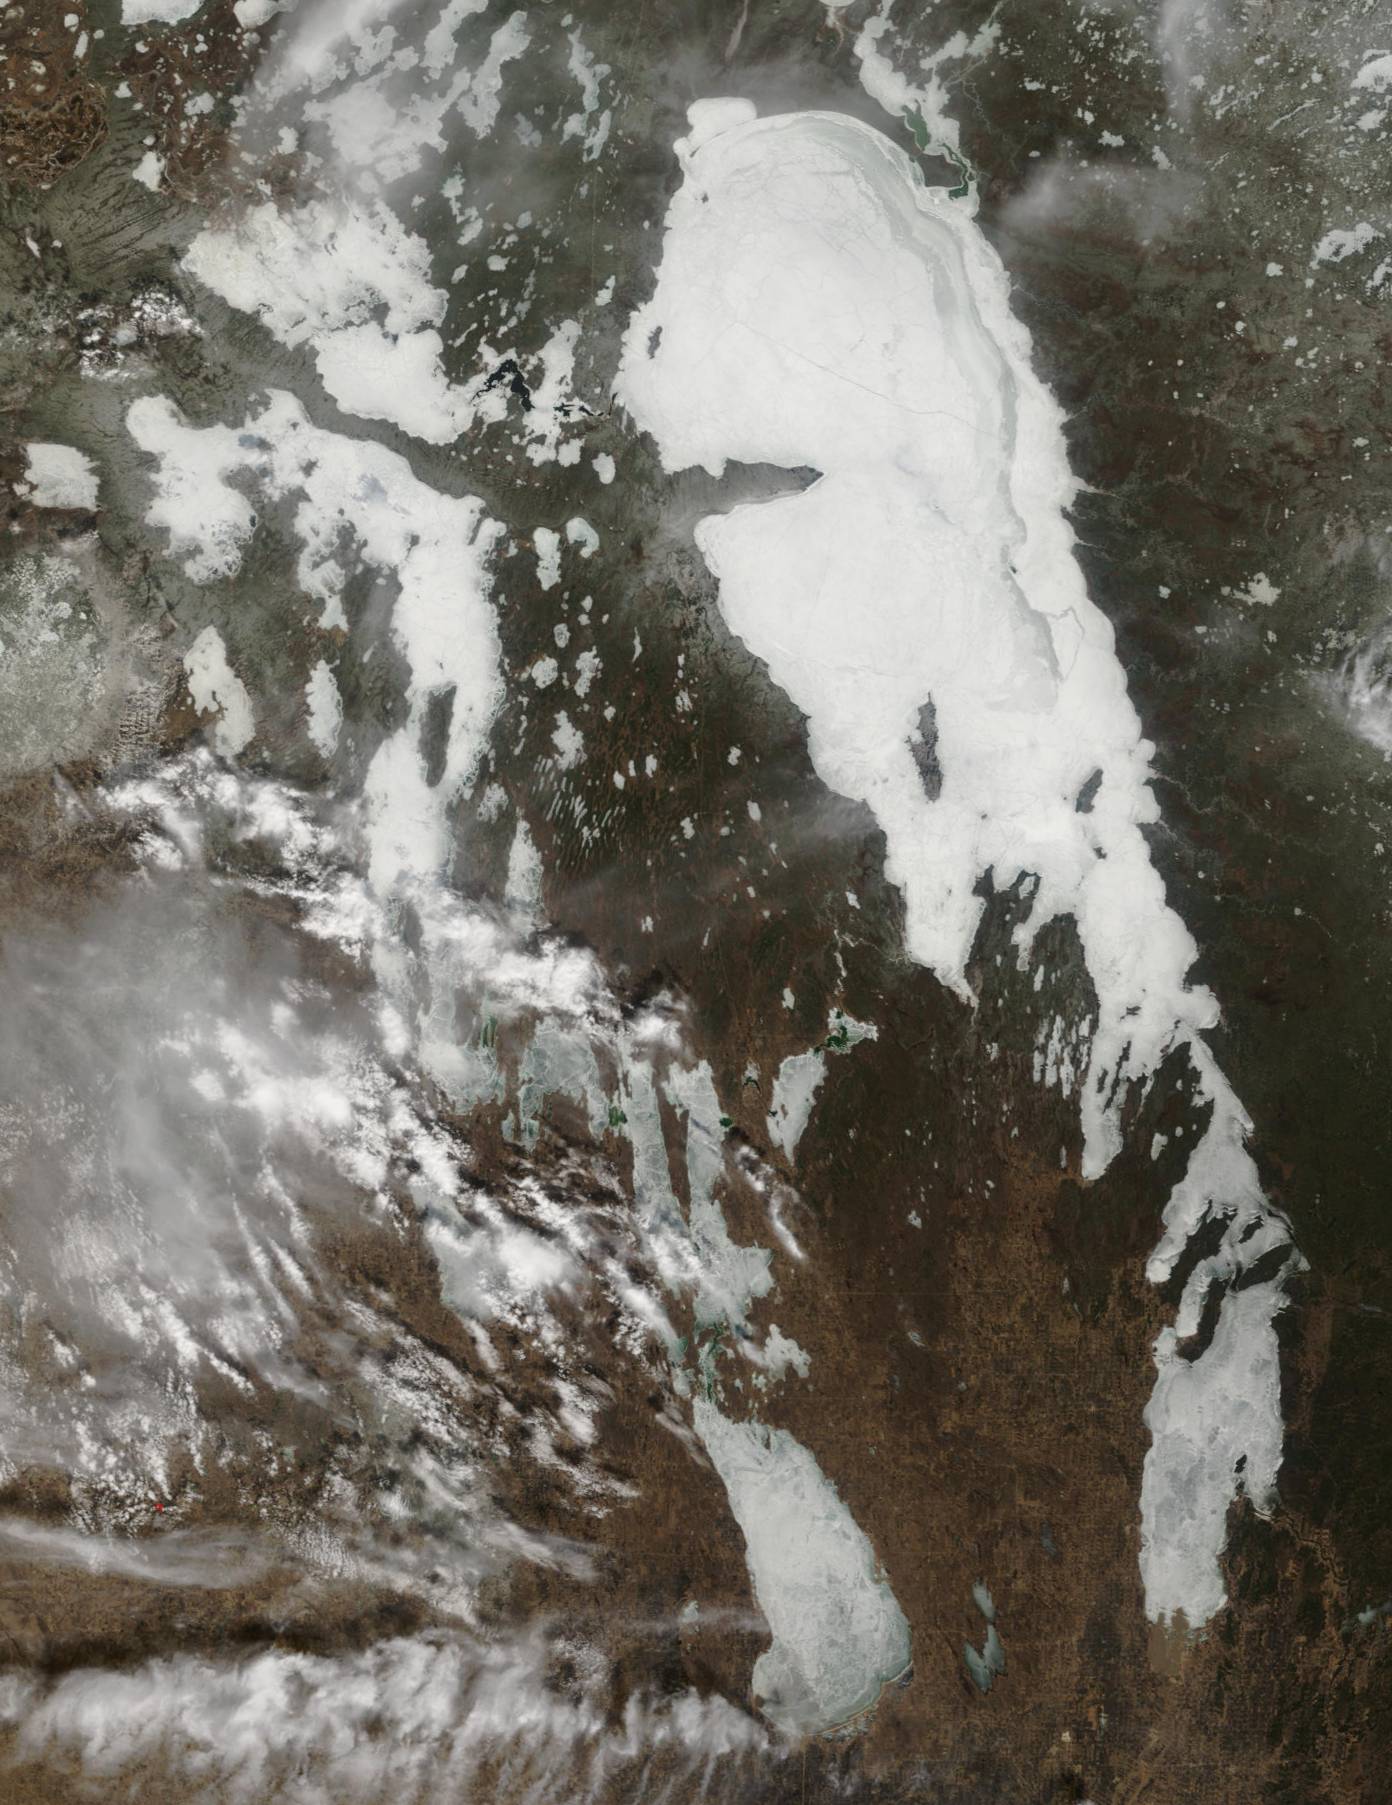
But by today, the 29th (centre and left images) there was
lots of open water: most of Traverse Bay
at the mouth of the Winnipeg River, a wide lead along the west shore from the
Red River to Hecla, and in shallow bays, like Washow
and Fisher Bays, along the west side of the Narrows region. There’s quite a bit of open water around the
outlet, too (near Warren’s Landing) – and a bit around the mouth of the Saskatchewan. And most of Lake Manitoba opened up over the
last few days. Only some really rotten
ice left in the middle of the South Basin.
So another open water season begins.
11:50
18 November 2006
13:40 25 November 2006
Ice
has formed over most of both the North and South Basins through the last
week. This is not unusual in Lake
Winnipeg. Although autumn cooling begins
a little earlier in the north, there is a deeper reservoir of water to cool
there – more heat to be lost before freezing can begin – so that the two basins
tend to freeze over within a few days of each other. From records kept by weather observers from
1945 to 1991, on average first ice has been observed on the South Basin on 11
November, the basin is completely frozen over by 27 November, and the entire
process usually takes a little over two weeks in any given year. But there’s a lot of variability: In the same record of observations, first ice
was observed as early as 27 October and last open water as late as 17
December. Anyway, the satellite images
above indicate that although the process may be taking less time this year than
average, the time of year is pretty much the norm. (Though if you look back to 2004 and 2005 on
this web site, you’ll see that it’s happening a little earlier than in either
of those years.)
By
the way, if you look carefully at the shape of the western boundary of the new
ice in the North Basin on18 November, you’ll see that it matches the shape of
the west shore. It looks to me like the
first ice formed along the shore, but was torn free by westerly winds to create
a 10-km broad open lead. By 25 November,
the western edge of the ice sheet had been carried another 10 km to the east,
to where it now sits locked in place by new ice stretching right across to the
east shore. The narrower lead along the
west shore of the South Basin probably has much the same history.
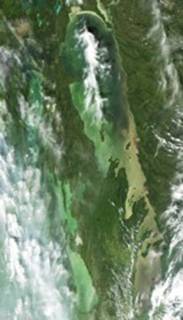
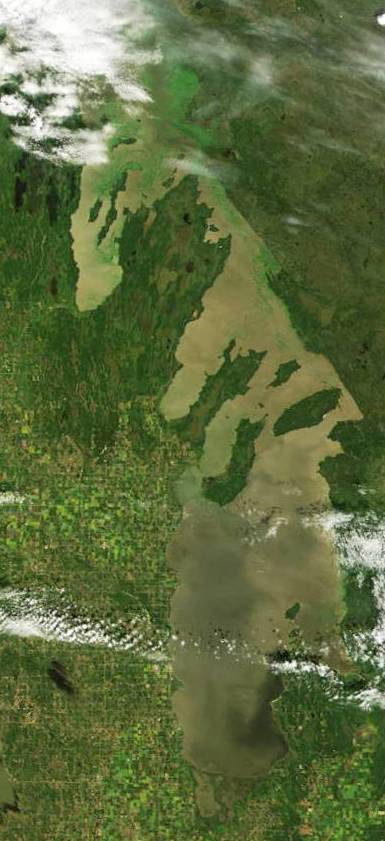
12:40 26 October 2006 You can still see the bands of colour that
developed in the South Basin during the strong winds of more than a week
ago. Water from north of Hecla was
carried far into the basin – stirred, but not yet mixed. And you can see the Winnipeg River water
pushing back – a dark patch at the head of Traverse Bay that wasn’t there on
the 14th. If you look very closely, you can also see a
thread of dark water carried through the Netley Marshes – the channel of the
Red River, which remains clearer than the lake.
The marshes themselves appear a lighter brown – light reflecting from
with fine sediment that has been mixed up from below – and not carried in by
the Red, which is more often the case, especially for the western ponds, which
are directly fed by the waters of the Red.
The sediment from the recent storms has only just begun to settle
out. The marsh ponds may well not clear
until after the ice forms and protects their surfaces from the energy of the
wind overhead. Of course, the same goes
for the really turbid regions on Lake Winnipeg.
In this image, you can also see some of the spatial heterogeneity in the
form of interfingering plumes developed by the winds over the North Basin. In particular, you can see the traces of jets
that penetrated westward from relatively clear, greenish water along the east
side – north of Berens Island – into the browner, more turbid water further
offshore. (One is a roughly hammer-head
shape – the clearer water pushed first westward and then deflected north and
south. Similar shapes have appeared in
other plumes – look back at the 29th
of August 2005 when relatively clear Saskatchewan River water carried
eastward beyond the tip of Long Point was split into two huge gyres north and
south.)
12:20
14 October 2006 14:05 14
October 2006 13:00
15 October 2006
14:45 15 October 2006
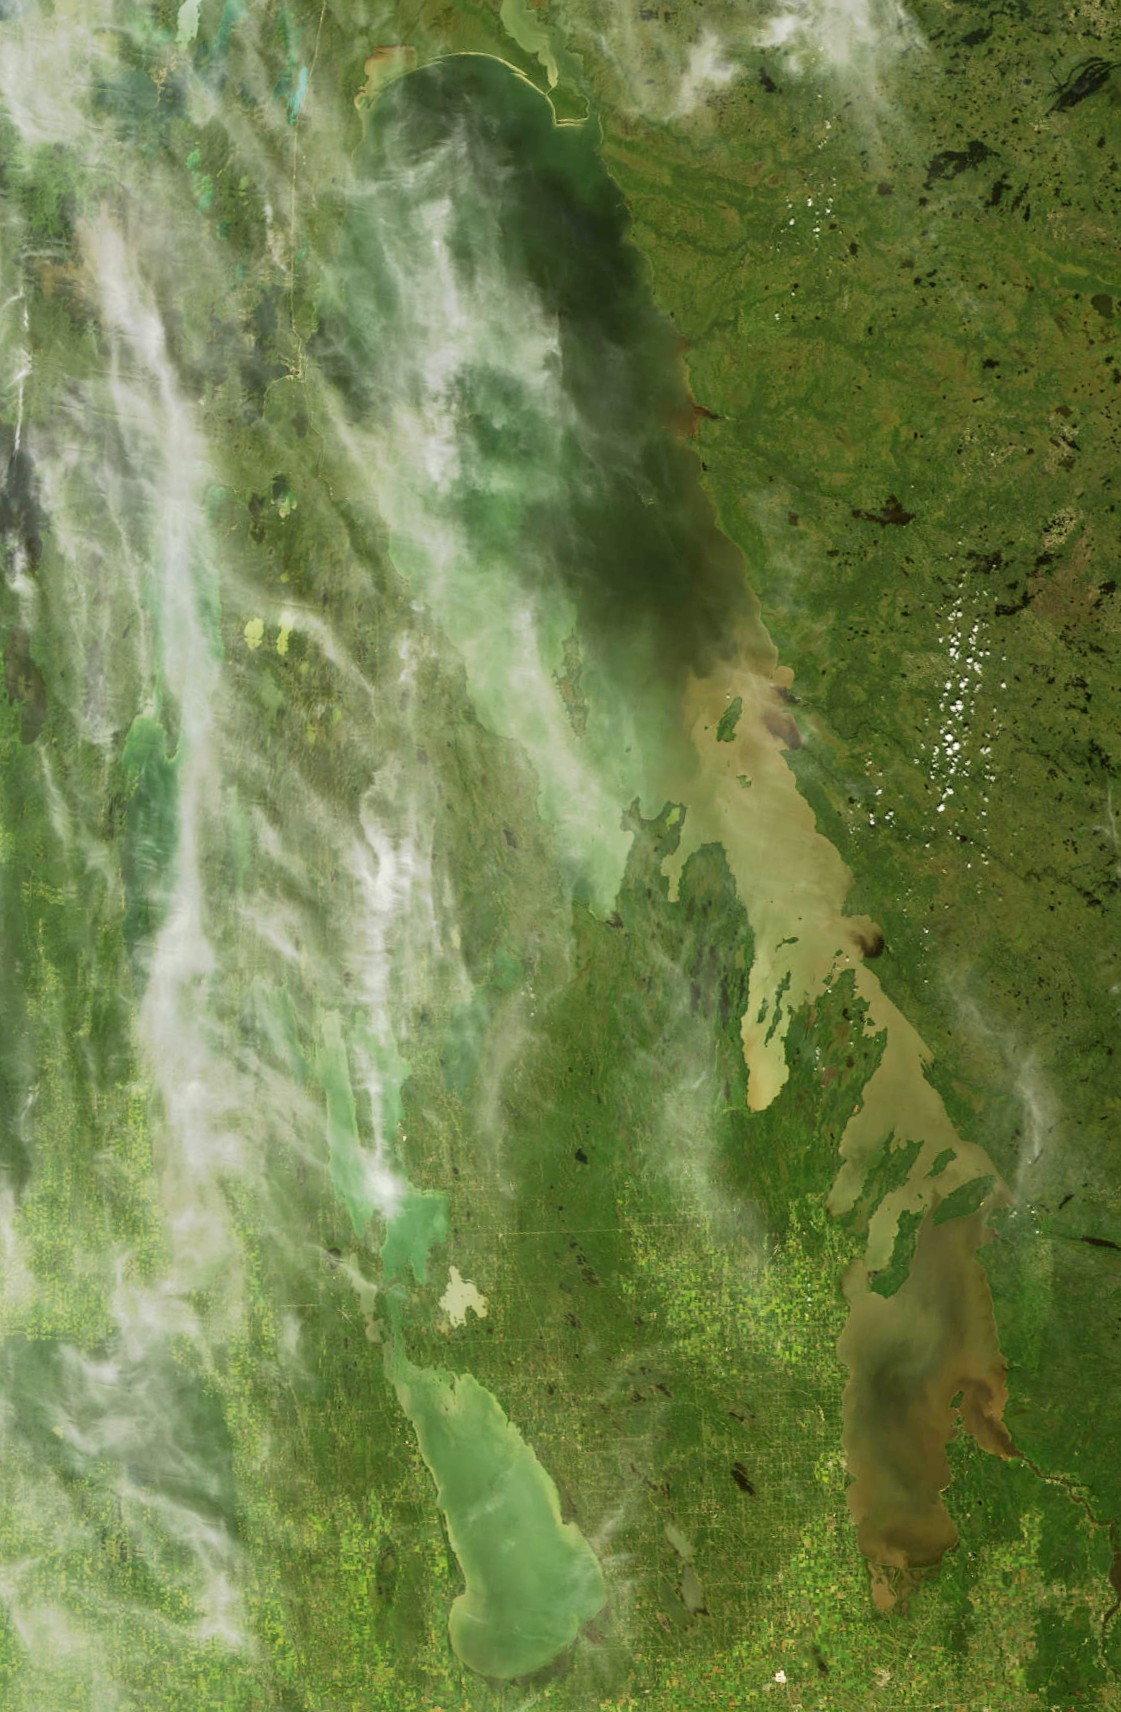
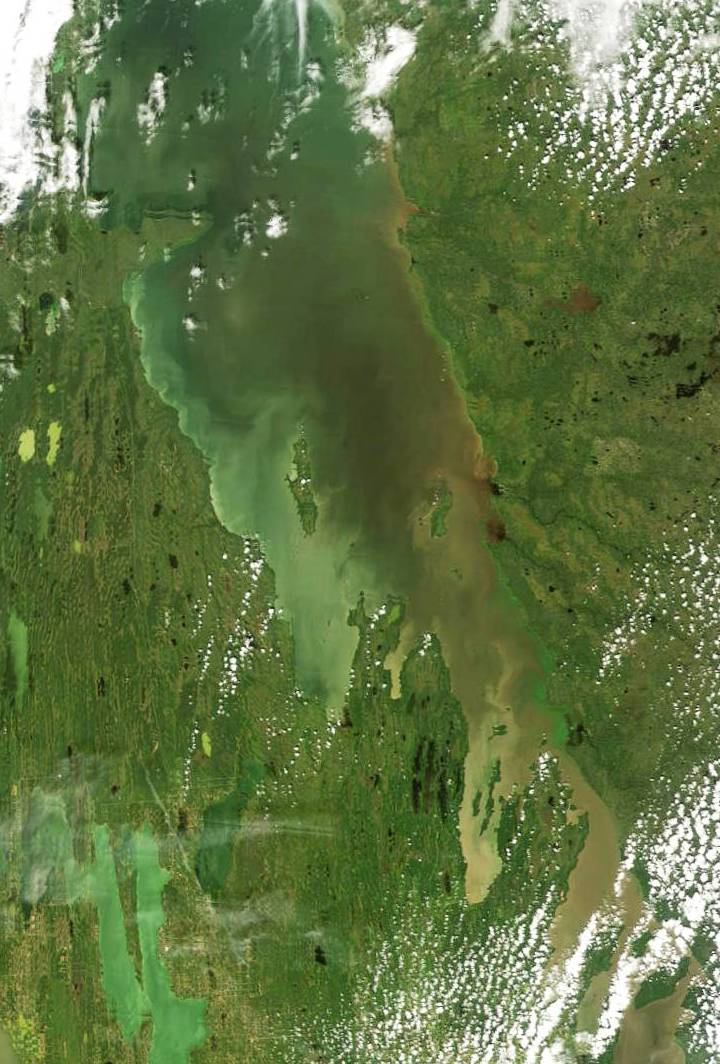
The
colour of Lake Winnipeg was dramatically changed last week. Sustained northwesterly
winds blew in excess of 40 km/h most of the 12th and 13th,
and remained high for several days after.
Silt and clay from shore erosion and bottom resuspension has turned
the South Basin a deep, rich brown – only just distinguishable (in colour,
though obviously not in texture) from the fallow land to the southwest. (And much of the land to the southeast of the
South Basin is snow-covered – snow that developed from water taken from the
lake as the winds passed over it.) Most
of the North Basin is a smooth pale brown – rich with silts and clays, probably
eroded from the bottom in shallower regions in the western part of the basin
and spread widely across the basin by currents developed as the lake’s surface
was tilted by the winds. Some of the
greenish bits – those along the north shore, and along the south shore of Long
Point – both in the lee of the winds – suggest that deeper water has upwelled to replace the surface waters carried southwards
by the winds. Rather than show you the
wind record (you can find it at http://weatheroffice.ec.gc.ca/canada_e.html),
I have copied some water level charts from Environment Canada’s hydrometric
archive (http://www.wsc.ec.gc.ca/products/main_e.cfm?cname=products_e.cfm)
– see below. On the night of the 12th/13th,
the level dropped roughly 0.6 m at Montreal Point, near the north end of the
lake, and rose 0.5 m at Berens River, near the south end of the North
Basin. It peaked a few hours later at
Pine Dock in the Narrow, and then, of course, continued to flow southward into
the South Basin – causing a peak almost a day later at Breezy Point at the
south end of the lake. Most of the South
Basin was raised over 2 m in the 4 days from a low on the 10th to a
peak late on the 13th. The
last rapid rise, roughly 1 m on the 12th and 13th,
(averaged between Pine Dock and Breezy Point) carried over 3 cubic kilometres
of water through the Narrows in roughly 20 h – that’s over 40,000 cubic metres
per second. For comparison, that’s 10X
the highest daily mean flow in the 1997 flood.
There must have been very strong currents passing through the channels
around Black Island – you can see lines of flow preserved in the coloured bands
of water stretching south from these channels.
Small wonder that in one of them – the eastern one – is the deepest hole
in the lake.
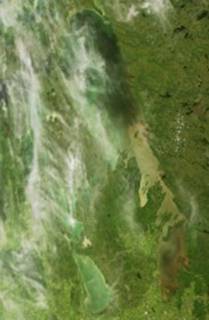
14:35 1 October 2006 14:10 5 October 2006
Two
images from this week, with enlargements of the South Basin, below. For local readers: there was a mention of the fire near St. Ambroise, in the marshes at the south end of Lake Manitoba,
in this morning’s Free Press. You can
see the smoke at the bottom of the image on the right.
South
Basin on 1, 3 and 5 October 2006: Al
Kristofferson told me that the Namao ploughed through thick algae in traversing
the South Basin on the 3rd of October, and where it appears through
the clouds, it is indeed quite green looking on the 3rd – indicating
a surface bloom. Most of the basin is
relatively dark in the other two images above, the 1st and the 5th,
indicating relatively clear water, but not showing much algae. I included another graph of winds that helps
explain the apparent change. High winds
on the 1st and 5th have mixed the algae down into the
water. They are still there – as they
have been since early August – but not so apparent on these images. Surface blooms quickly develop and disappear depending
on whether turbulence in the water column lets them rise to the surface, as bluegreen algae will do when they have the chance.


13:05 20 September 2006 12:55 22 September 2006
Strong
northeasterly winds (sustained winds of 25-35 km/h
over several days, blowing mostly from 50-70o azimuth – see the
chart above with data from the Environment Canada weather station at Grand
Rapids) two weeks ago must have disturbed the western side of the North Basin
to the bottom – stirring bottom sediments up into the water column. Compare the broad light tan-coloured region
north and south of Long Point in recent images above with the colours in the
image below (10
September). Surface blooms of algae formed up all along
the eastern side of the North Basin on the 20th -- where the water
was relatively clear of suspended silt and clay – i.e. where it could grow and
reproduce in the deeper sunlit layer of water.
In contrast, no surface blooms are apparent in the very turbid water on
the west side.
Although
surface blooms in the South Basin are not so intense as earlier this summer,
there was still a lot of algae in the water there last week – much of the basin
is still pretty green. Some of you may
have seen the pictures below. They were
taken on Grand Beach – along the east shore of the South Basin – in early
August, when one was published in the Winnipeg Free Press. The photographer, Lori Volkart,
kindly offered to let me show them on this site.
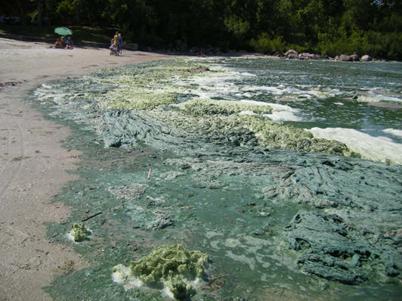
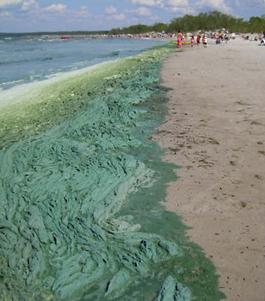
Blue-green
algae washed up on Grand Beach, early August 2006.
The widespread surface blooms of
blue-greens that so coloured the lake on the 3rd
and 4th are not apparent in these images. Still, there is a lot of green in the
water. In much of the South Basin, the
water looks pretty clear (dark, in these images) – but there is a greenish
tinge in the darkness. Whether surface
blooms re-develop really depends on the weather now. If we slip into warm autumn, and relatively
calm, then surface blooms could still form up; they’ve formed as late as early
October in previous years (e.g. see the middle image in this set: 27, 30
September & 6 October 2004).
12:25
3 September 2006 13:05
4 September 2006
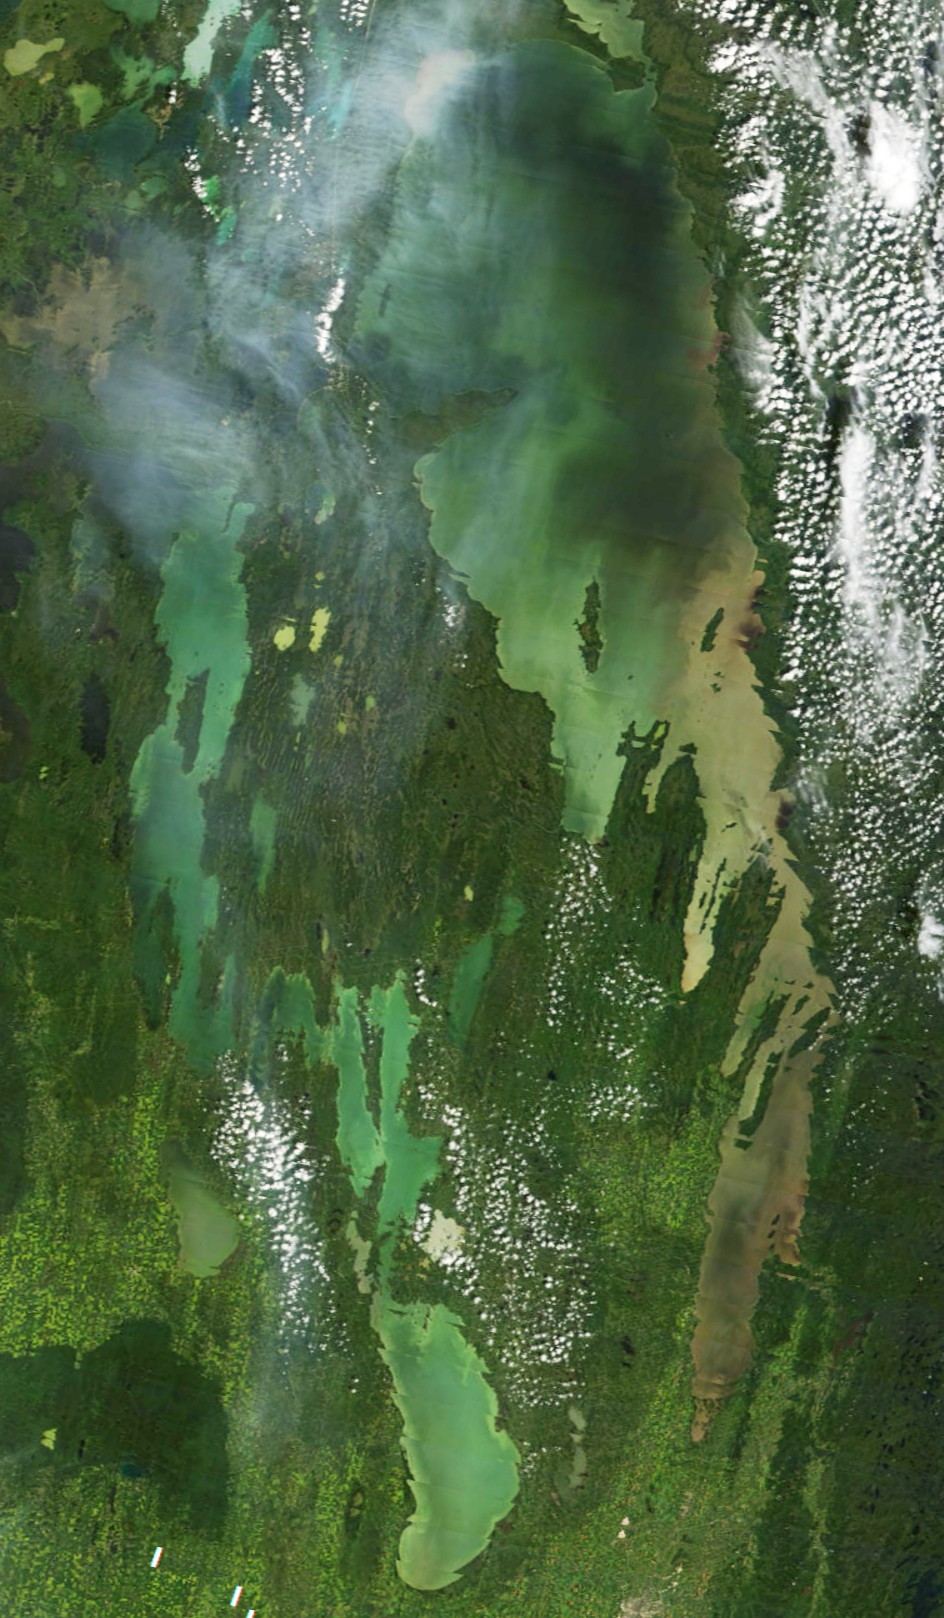
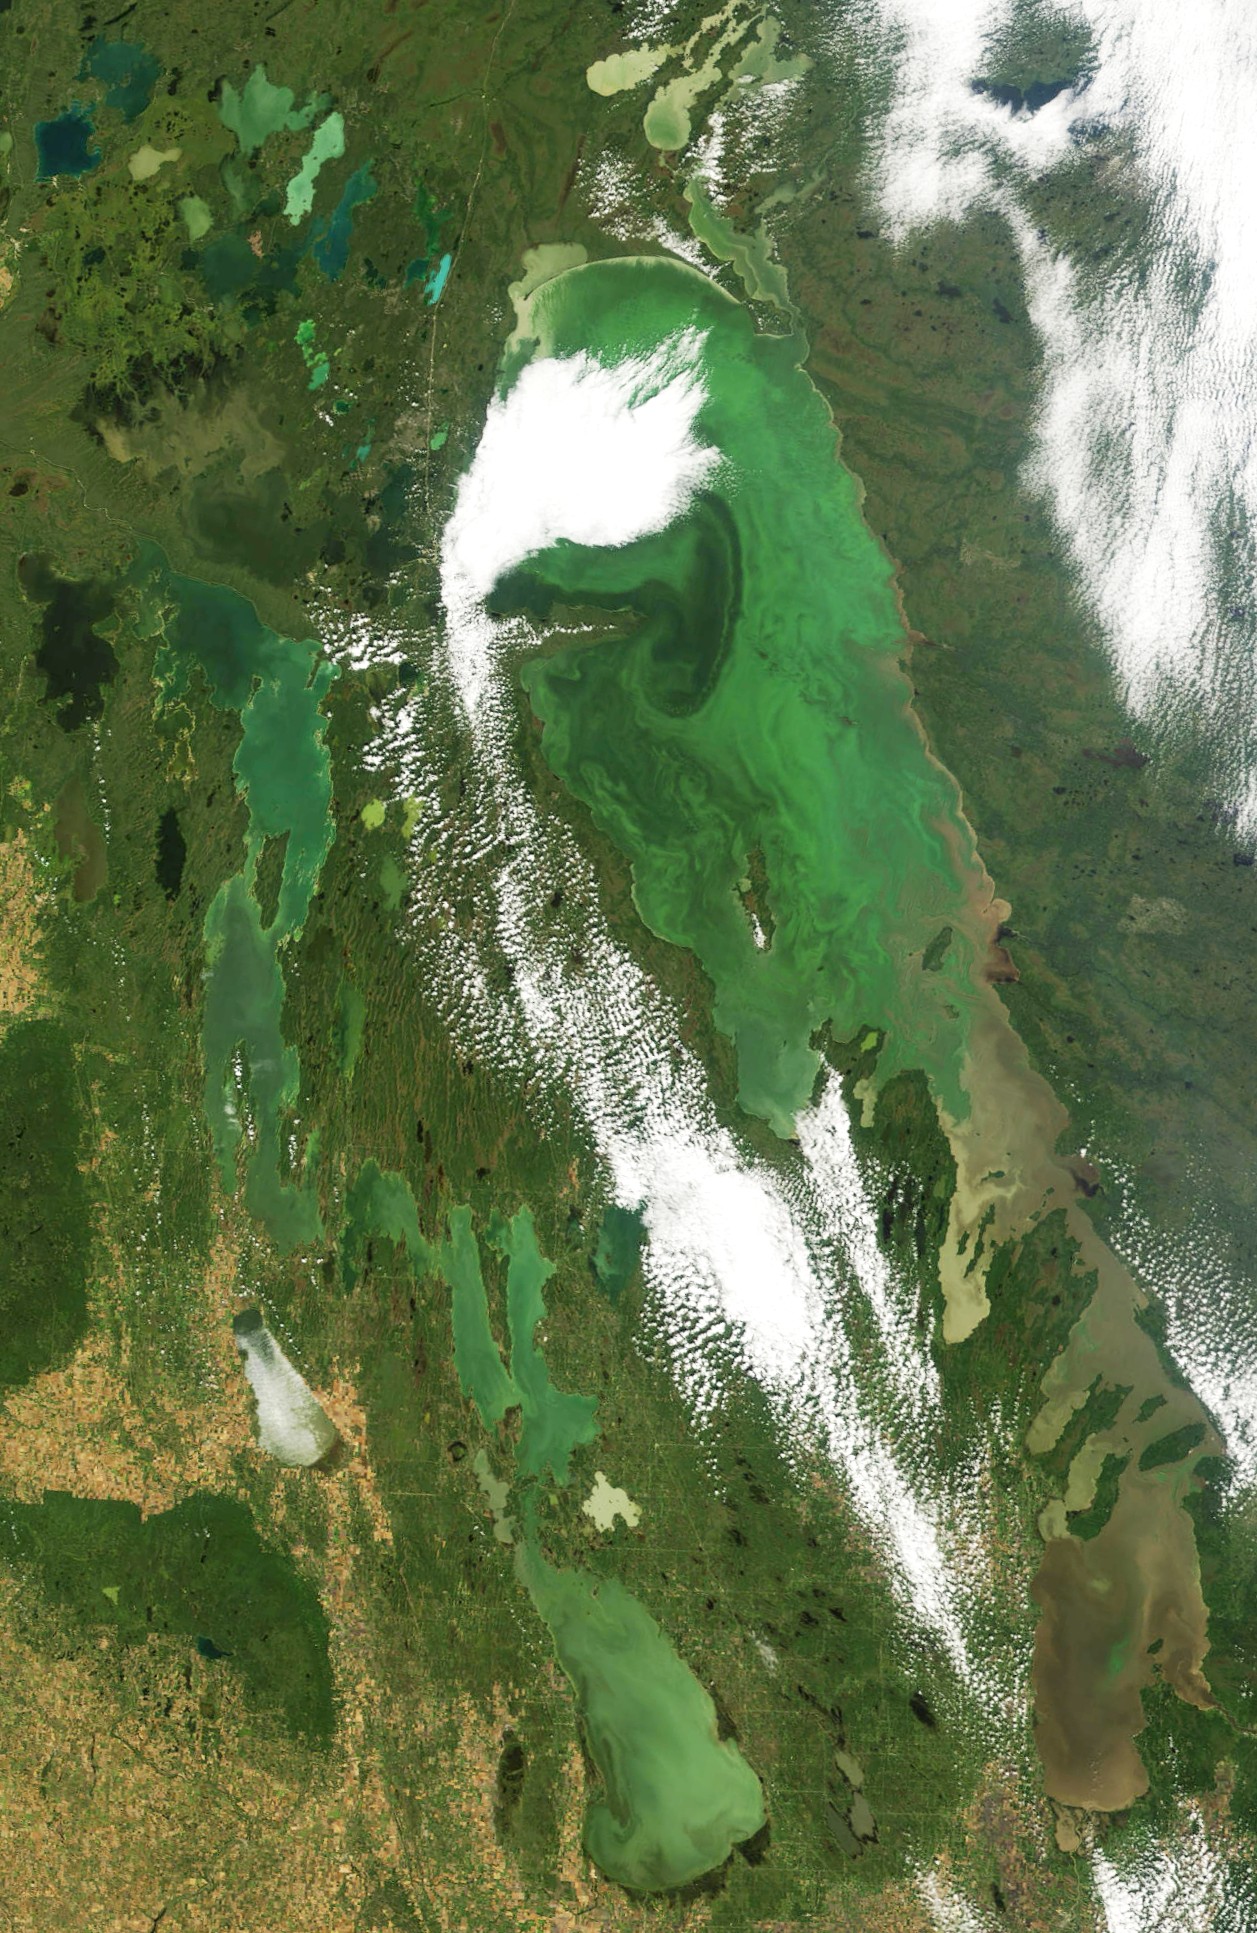
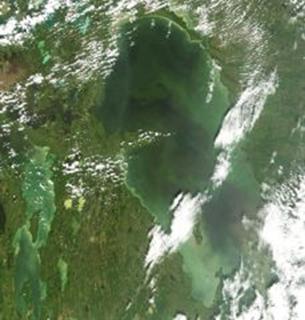
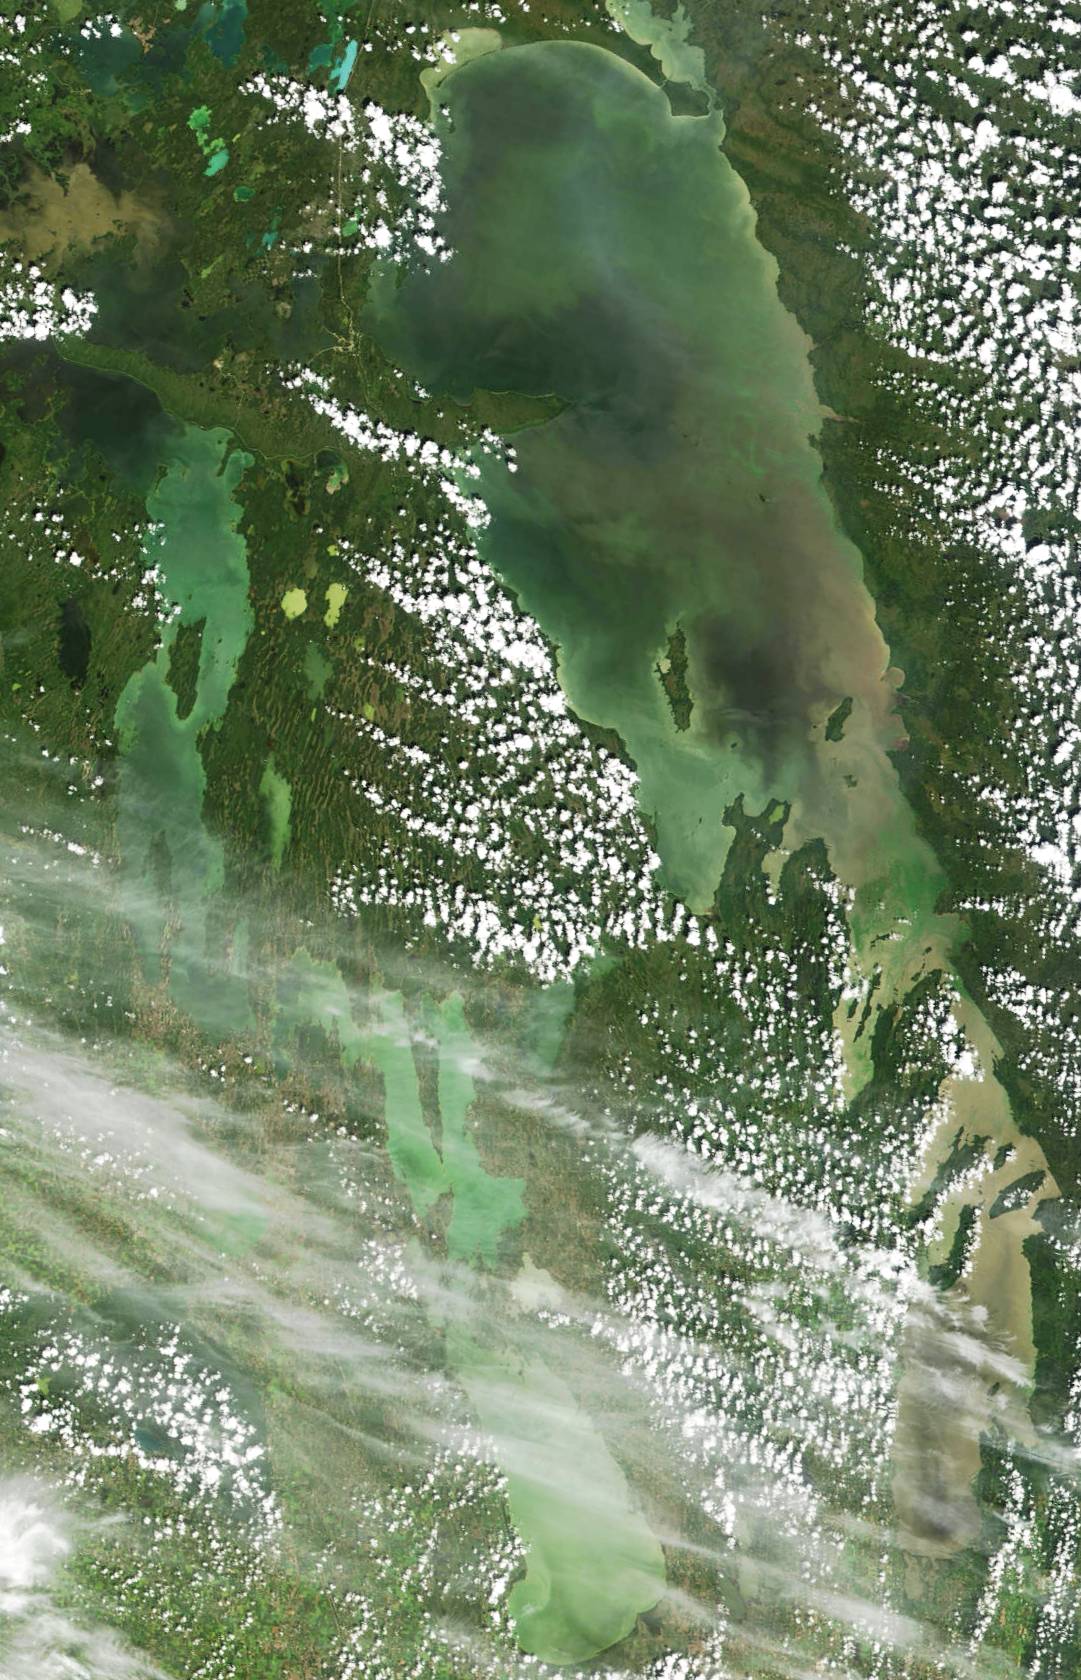
The surface blooms of algae in the image of the 3rd of September are the most widespread that I have seen in Lake Winnipeg. A large portion of the North Basin is green with algae – as extensive, though perhaps not quite as intense, as last year on the 29th of August . Once again – as in the images from mid-July – see 15 July 2006 – there were intense blooms in the Narrows region as well. However, this year much of the South Basin is green, too. For the first time – at least in recent memory – people who go out on the South Basin are seeing widespread algal blooms in something approaching the concentrations that people who fish the North Basin have seen for the last decade or so. There were reports of algae washing up on some of the cottage beaches over the Labour Day weekend; these images show that these were not isolated events due just to the vagaries of the wind, but rather, symptoms of a widespread phenomenon. On 3 and 4 September the South Basin was green, from the mouth of the Red River up to Hecla Island, and from near Gimli across to Grand and Victoria Beaches, as well as all up the east side from Traverse Bay almost to Black Island – most of the basin.
This summer may have seen a perfect confluence of events to
promote growth of the blue-green algae.
Last year, high runoff from the Red River carried through beyond the
usual spring peak into the summer.
Widespread flooding charged the flow with extra nutrients dissolved from
vegetation that was inundated through most of July. This year, an early break-up was followed by
warm spring and early summer temperatures that fostered algal growth. And then
there was the relatively clear water that we saw in the South Basin. The last is a factor that usually distinguishes
the North from the South Basin. Light
penetrates more deeply in clearer water – providing a deeper layer through
which algae can grow and reproduce. In
much of the North Basin, that layer is typically several metres deep – and it
is in this deeper photic zone that the great surface
blooms of the last decade have formed.
In the more turbid South Basin light penetrates often only a few decimetres – reach into the water to your elbow and you
cannot see your hand. But last weekend
at Gimli and Hecla, you could see the bottom down to a metre
or more. In late July the Red River was
flowing relatively clear -- carrying less than its usual load of silt and clay
– and water in the south was unusually clear for the time of year – see 24 July 2006 and
the accompanying discussion below. The
result is the most widespread bloom in the South Basin in over two decades of
satellite records.
The
bright green that covered much of the North Basin appears much more muted in
this image. Similarly, the green patches
in the South Basin in the images below have all but disappeared in this
image. Although I haven’t checked the weather
record, it is likely that winds have mixed the algae down through the water
column, making them less visible to the satellite.
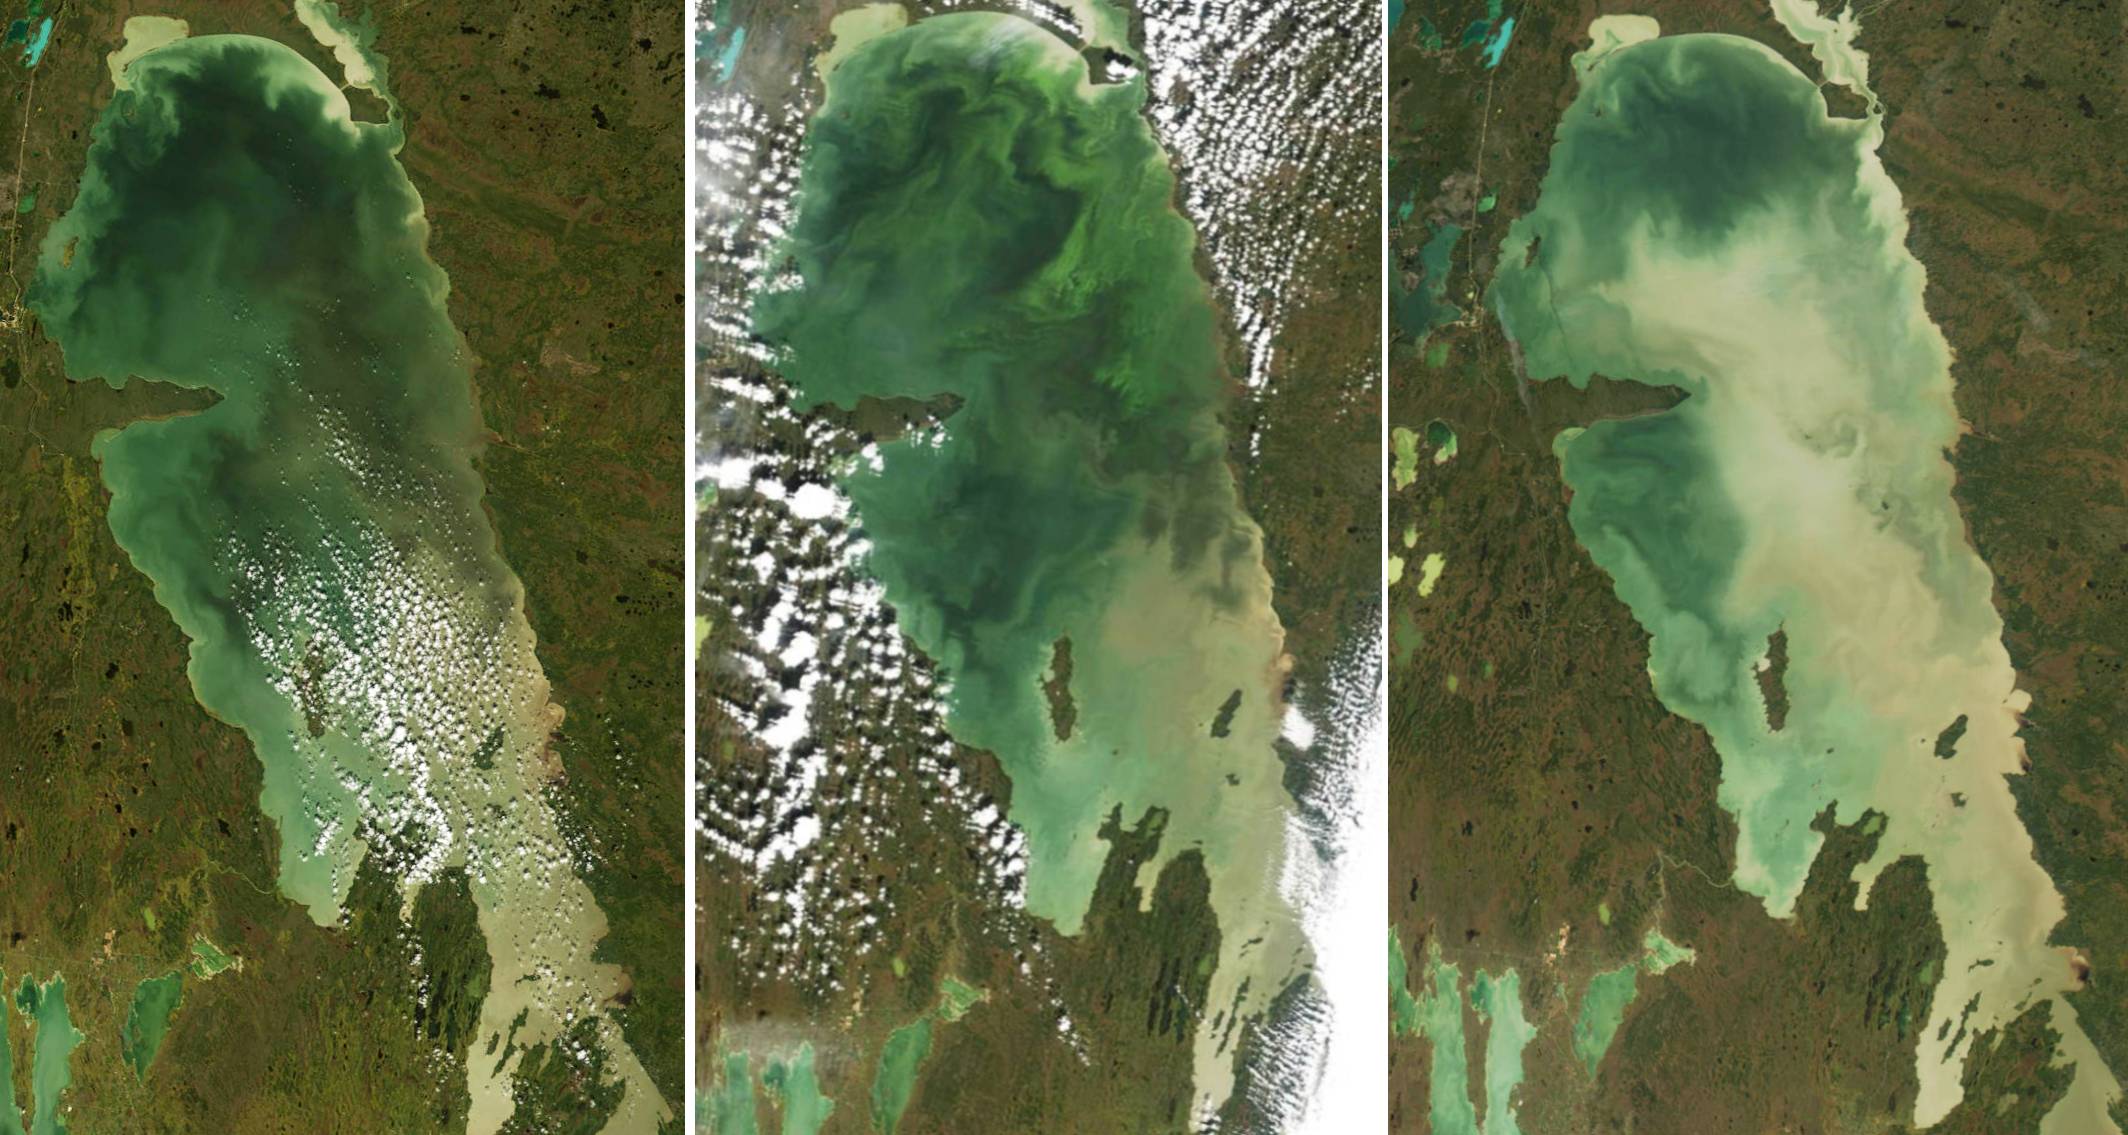
14:30 7 August 2006 12:25 18 August 2006 13:05 19 August 2006
In
the images above, you can see very widespread surface blooms that developed in
early August and persisted at least until the latest good image I have seen –
on the 19th. Although it’s
not the largest in the last few years, its still a very widespread bloom. On the 18th floating mats of algae
covered more than a third of the surface area of the North Basin, or easily
6-7000 km2 of the lake’s surface.
As has been the case in the last few years, these really widespread
blooms have developed most consistently in the relatively clear waters north of
Berens Island – that is, north of the more sediment-laden waters (browner, in
these images) in the South Basin and the Narrows region. Strong surface blooms did form in the Narrows
earlier this year (e.g. 15
July 2006)
and they are still apparent in the 7 August image, but they are not so apparent
now. What is also apparent is that
strong surface blooms did form up in early August in Traverse Bay, in the South
Basin – I’m sure the cottagers there are well aware of that. And if you look closely, there are green
patches between Gimli and Grand Beach that indicate that algae have been pretty
productive in the South Basin, too, though their presence is partly masked by
the turbidity of the water there.
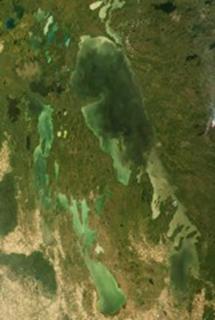
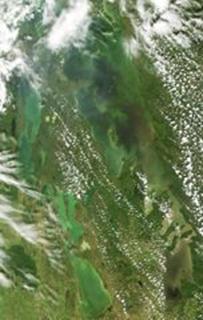
For
those who are interested, I have also included an image of Lake of the Woods is
included on the 7th August image. Through the last decade, Lake of the Woods
has also been plagued by intense surface blooms of cyanophytes – blue green
algae. In early August, intense surface
blooms covered most of the large southern basin of the lake, Big Traverse Bay,
and reached up along the west side almost to Kenora.
12:50 29 July 2006 12:35
31 July 2006
The
lake was mostly obscured by cloud on the 29th of July, but you can
see in the image above that there were surface blooms of blue-green algae in
the Narrows region. However, a couple of days later, on th
31st, the greens in the North Basin were muted compared to the image
recorded on the 24th (below).
It is likely that in the interim the algae were mixed back down into the
water column by winds and waves.
The
surface blooms of algae that first appeared ago just north of the Narrows a
couple of weeks are still quite distinct in this image. Plus now there are widespread blooms around
Grindstone Point – a large cottage community near the north end of the South
Basin. And now distinct surface blooms
are appearing in the North Basin -- very widespread, especially from just north
of Georges Island to the outlet at Warrens Landing, and over much of the region
north of Long Point, though their full extent is obscured by cloud in this
image (but covering easily more than a quarter of the North Basin – that is,
more than 4000 km2 of dense algae and the summer is still
young). The pattern of clear water
(relatively dark) along the north shore of Long Point, together with the clear
water off the tip of the point, is very reminiscent of last year – see the 29th
of August last year – when a similar pattern seemed to have been created by
the spreading of relatively clear Saskatchewan River water first south and then
back north as the flow passed beyond Long Point.
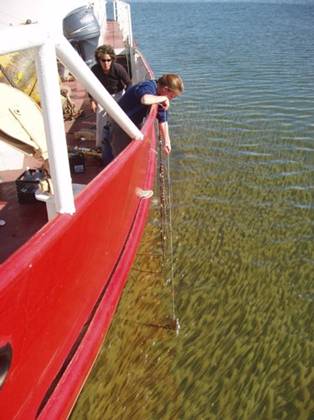
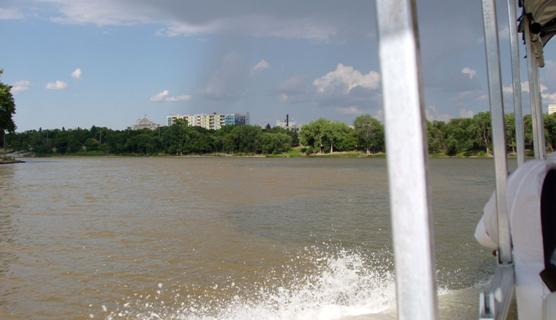
I
have added a picture taken from the Water Bus at the Forks in Winnipeg showing
the much muddier Assiniboine River water mixing with
relatively clear Red River water. There
is still a strong current in the Assiniboine –
consequently it is still carrying a lot of silt and clay eroded from its banks
and bottom. But the Red is clearer,
perhaps because it is not flowing as strong, or perhaps because the floods of
last summer scoured and carried away a lot of the most easily erodible
sediments along the channel. In any
case, it is this clearer Red River water that is making the southernmost end of
the lake very clear. This impression
from the satellite images was confirmed to me last week by a cottager from
south of Grand Beach, who remarked on the unusually clear water there.

12:10 10 July 2006 12:15 15 July 2006 12:55
20 July 2006
Widespread
surface blooms don’t appear to have developed yet in the North Basin of Lake
Winnipeg, although there may be a little more there than meets the eye. The colours are muted – that’s due to a bit
of haze in the atmosphere – so some of those greens might look quite a bit
brighter on a good, clear day. (For
instance, look at the irregular green patch just north of Georges Island.) Nonetheless, even by early July (see the 10th,
above) there were local surface blooms of algae along the east shore just north
of the Narrows. These became quite
intense by the 15th – you can see the southern edge of these blooms
above, with the northern limit obscured by cloud. They’re still there on the 20th,
though not as widespread or intense. But
the differences from day to day can easily be a function of wind and waves – if
there are enough blue-green algae in the water, surface blooms will appear
whenever by developing buoyancy (charging internal vesicles with gas) they can
overcome the mixing energy of rough water.
If you look closely, you can also see a narrow bloom along the east
shore of the South Basin, east and northeast of Elk Island – its readily
apparent on the 15th, and I think there was still a bit of a bloom
near the north end of Traverse Bay on the 20th – just visible through
the clouds.
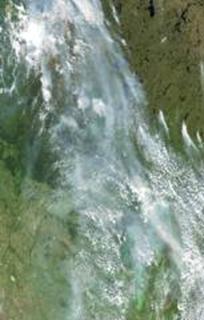
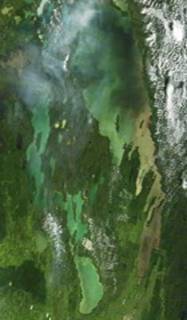
12:35 27
June 2006 In late June we were getting a lot of smoke from northern
Saskatchewan down here. You can see the
path on one day, the 27th, above.
Lake Winnipeg is at the lower right of the image. The thickest plume of smoke is passing right
over the North Basin – coming down from fires west of Reindeer Lake, near the
upper left of the image.
14:40 2
June 2006 12:55 17 May 2006
Left: The west side of the North Basin is becoming
quite green – at least partly due to algae in the water column, but no where
near the colour of surface blooms that develop later in the open water
season. The plumes of the major rivers
are very obvious in these images, especially in the South Basin in the contrast
between the tan colour of Red River water (muddy, turbid) and the dark of the
Winnipeg River (clear, absorbing most of the light falling on it). Saskatchewan River water is still relatively
clear compared to the surrounding North Basin water. And in this image the Fisher River (at the
south end of the large bay along the west side, in the Narrows region) is
flowing in particularly red-brown, something I haven’t noticed before. The red brown colour is due to dissolved
organic matter from wetlands in its watershed.
Right: You can see the immediate effects of two of
the major inflowing rivers in the image on the 17th. The southern half of the South Basin is
marked by the silt- and clay-laden waters of the Red River. The northern half is still relatively clear;
most of the silt would have settled out in the calm water under the ice through
the winter. And the plume of the Saskatchewan
River spreads out into the North Basin.
It is clear, and relatively dark in this image – clear because Cedar
Lake just upstream of Lake Winnipeg acts as a sediment filter – most sediment
settles to the bottom there before the flow reaches Lake Winnipeg. The plume of Saskatchewan River is often
quite striking. Here it is spreading
broadly out into the lake; later in the summer it is more likely to be seen
spreading eastward along the north shore of Long Point (e.g. 29 August
2005).
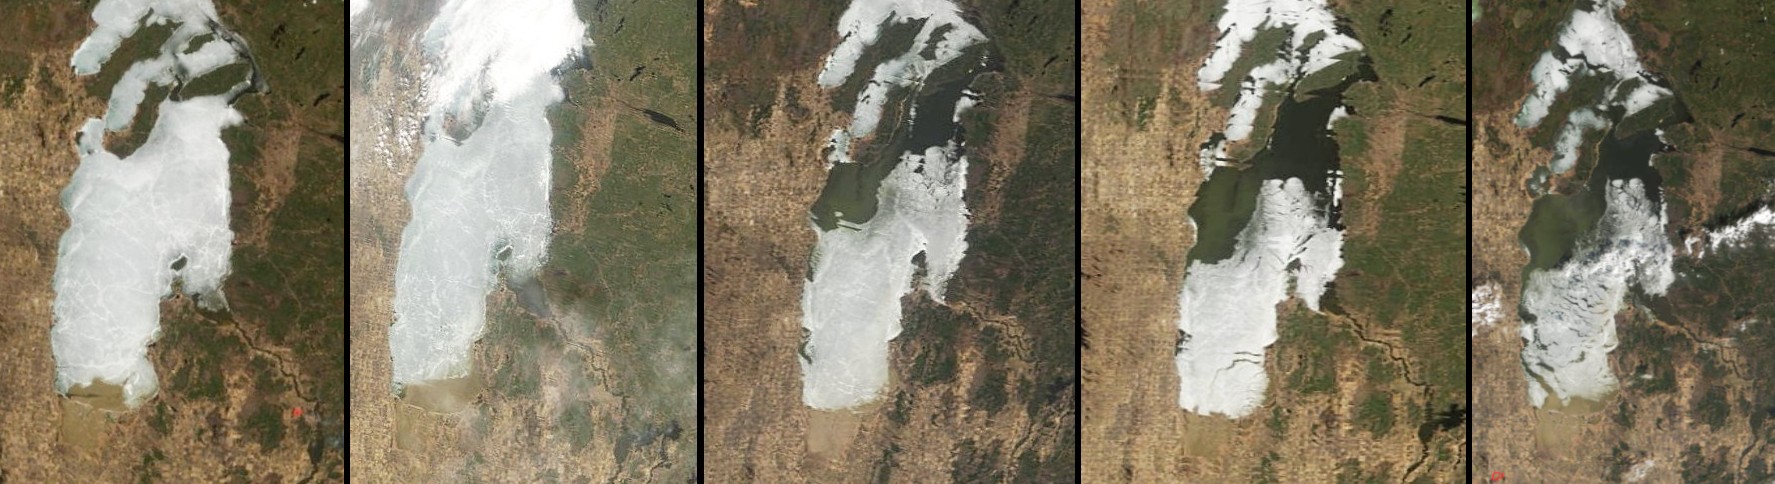
30 April
2006 5 May
2006
7 May 2006
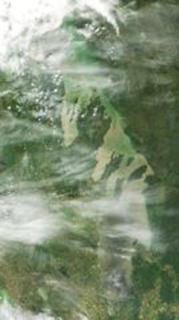
It’s
not easy to pick out the ice from amongst the clouds, but the ice on the North
Basin was well on its way on the 30th of April. You can see lots of open water up to George
Island, and further north, where there was still widespread ice, it looked
pretty fragile. By last Friday, there
was only a little ice left, and today – only fragmentary floes along the west
shore. Break-up on the North Basin is
happening a little earlier than last year – when it was still half ice-covered
on the 5th
of May (2005) – and a lot earlier than 2004, when there it was still half-ice
near the end
of May (2004). Even in 2003, when the lake was
unusually warm later in the summer, the ice was solid over the North Basin in
the 6th of May (2003).
21 April
2006
24 April 2006 26 April 2006
On the 21st, only southeastern
bits of the South Basin (see the enlarged South Basin images below), the
Narrows and shallow bays just west of the Narrows are open, but the ice cover
on the North Basin looks pretty solid.
Already, by the 24th the South Basin was completely clear of
ice. Winds over the lake blew NNW at
20-40 km/h from early on the morning of the 23rd, through the night
and into the 24th – by which day broad patches – 5 to 10 km wide –
had opened up at the north end – along the north shore and south of Long Point
and Reindeer and Berens Islands. (See
more on the effect of these winds, below.)
I’ve kept much of the Red River valley on the larger image on the 24th – flood
waters still cover a wide expanse near Morris on the Red, and further south in
North Dakota. Today, the 26th,
a wide lead has opened up along the length of the east shore of the North
Basin, not quite onshore, but rather, paralleling the edge of deep water. The pattern of ice still attached to the east
shore is pretty much the pattern of shallow water with numerous reefs at and
just under the surface – especially the broad bulge in the shore-bound ice
stretching 15 or more kilometres lakeward off the mouth of Poplar River,
directly across from Long Point – a place we never go in the Namao, called
“foul ground” on the navigation charts.
And something I didn’t notice yesterday – a tiny crescent of white (tiny
in these images, but at least a couple of hundred metres wide along the
lakeshore) bordering the little bay just south of Victoria Beach along the east
shore of the South Basin – the NNW winds must have piled ice high against the
shore there, at the little cottage community of Hillside Beach.

Water level at Gimli (compliments
of Water Survey of Canada -- http://www.wsc.ec.gc.ca/products/main_e.cfm?cname=products_e.cfm). The level rose 0.5 m from noon to just after
midnight last night. That means a lot of
water was pushed south through the Narrows.
If you look closely at the enlargement of the South Basin below, you can
see a plume of greenish water pushing southward into the South Basin through
the gap between Hecla and Black Islands – one visible sign of the flow that passed
through that gap last night. All of the
south end of the South Basin is turbid – muddy brown coloured. Some of that is the muddy Red river water,
but the muddy water in Traverse Bay must be due to erosion and resuspension of
bottom sediments. Not from the Winnipeg
River, at any rate. It flows clear – see
how dark (clear) Traverse Bay is in all the earlier images.
15 April 2006 21 April
2006 23
April 2006 24 April 2006
Four images of break-up on the
South Basin of Lake Winnipeg. The period
of breakup was almost the same as last year –
the 16th to the 23rd of April, last year, from
first open water to last ice – South
Basin 16, 18, 19, 20 & 21 April 2005. Last year was the earliest on record that the
South Basin was ice-free – this year must be the second earliest.
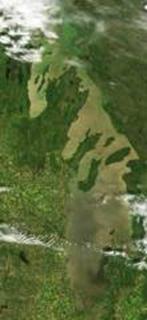
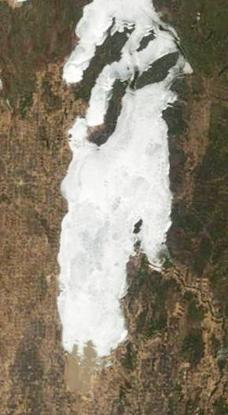
Melt
on Lake Winnipeg is just beginning in this image (South Basin enlarged on the
above). The light tan colour a the south
end of the South Basin is muddy Red River water – mostly filling the Netley marshes,
but also melting out into the lake itself at the mouths of two inlet
channels. There’s some open water
around the mouth of the Winnipeg River, too – darker in this image, and
therefore clearer water. And there are
open leads among the islands – a mile wide at least between Hecla and Black
Island near the top of the image.
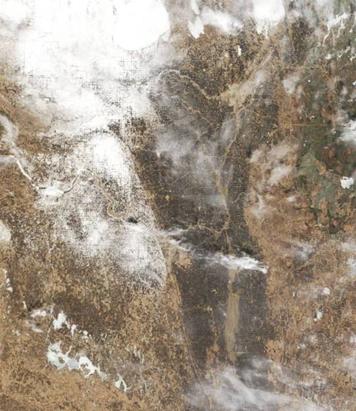

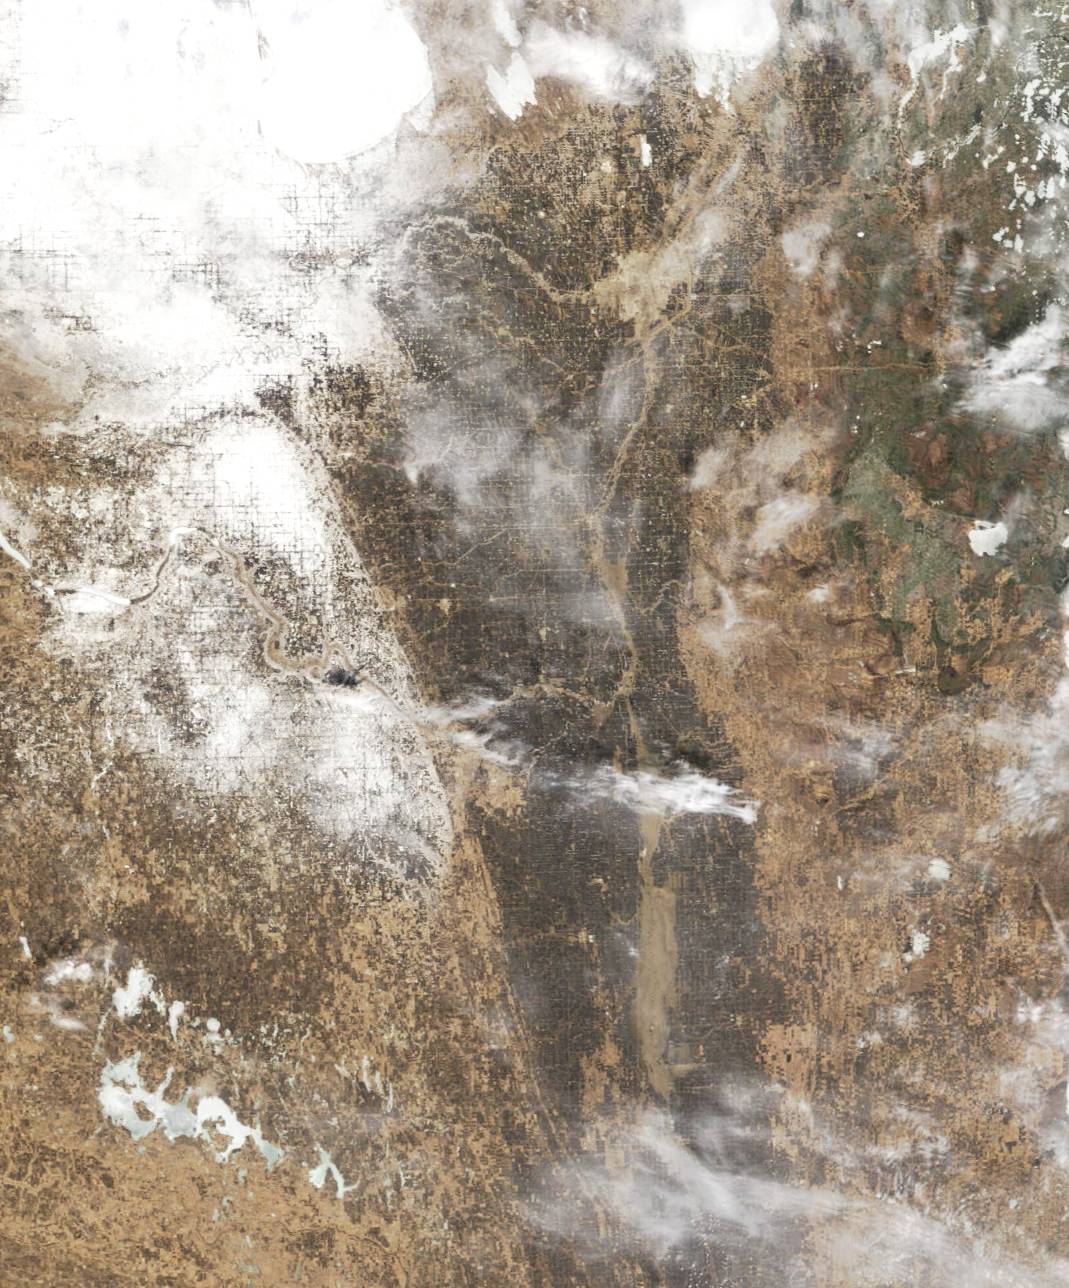
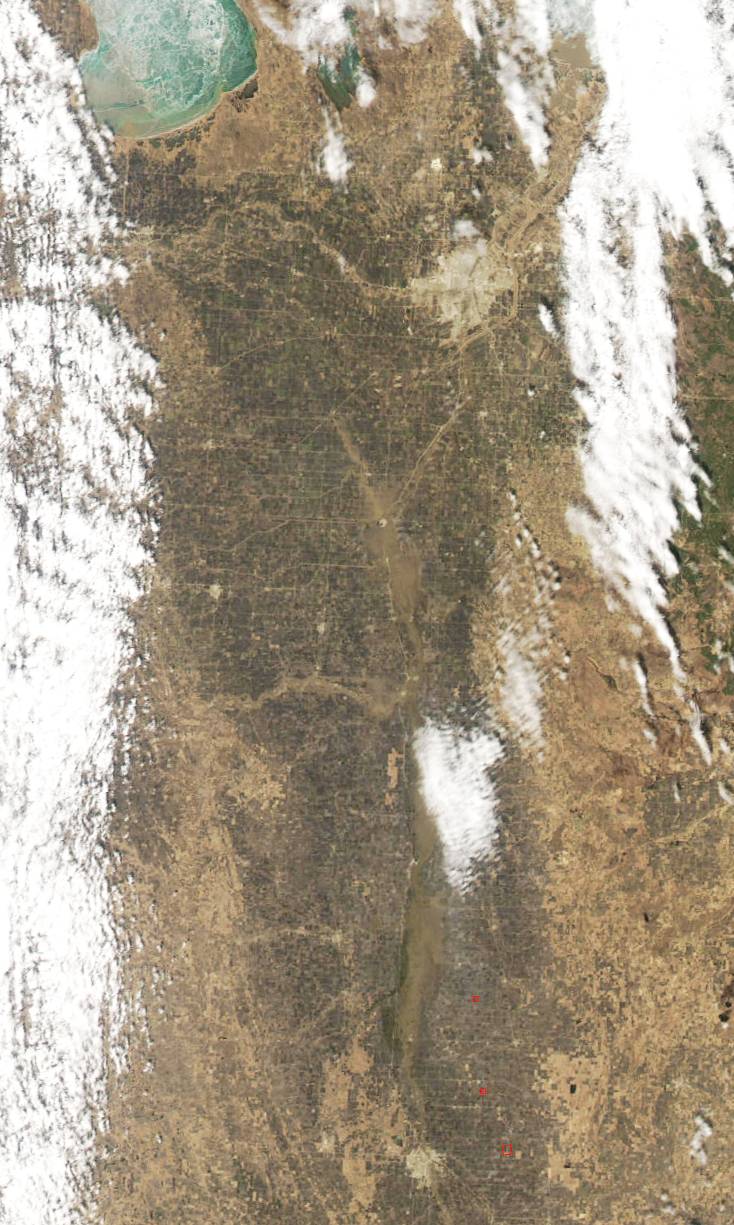
Red River Valley, 8 April 2006 17 April 2006
The
image on the right shows the Red River valley on the 8th of
April. The valley itself is easy to pick
out – it’s the broad dark band running up the centre of the image – black
fields. The grid through the fields is
the section lines – each pair 1 mile apart – giving you the scale of the
image. Winnipeg is the very light tan
near the north end of this dark band – at the confluence of the Assiniboine from the west and the Red from the south. Rivers are light tan in these images – loaded
with silt and clay. Off to the left of
the valley are the Pembina Hills, with a light
covering of snow – white, centre-left in the image – and the Pembina River winding through them. (And that’s Devil’s Lake – still ice-covered –
in the south-west corner of the image.)
The tan colour running up the centre of the darker fields marks the
muddy flood waters of the Red River spreading out over the fields – several
miles wide down near Fargo and Grand Forks.
A little harder to see because of clouds is a broad flooded area further
north, spreading east from the river, near Morris. Over and above the damage the flood waters
are doing along the river right now, we need to realize that they are picking
up nutrients from the land – presaging yet another year of high nutrient
loading into Lake Winnipeg. The image on
the right – 17 April – shows the flood waters near their peak at Morris – the
tan area a little above the centre of the image.