Theory: Matrix Similarity Searches
Tutorial: DXHOM
This assignment is worth 5% of the course grade.
Due Tue. Dec 3, 2024.
| Note: This assignment
assumes that you have already gone through the
Bioinformatics Lab components on Dot matrix similarity
searches. Theory: Matrix Similarity Searches Tutorial: DXHOM |
The structure and evolutionary history of entire
chromosomes can be studied using dot-matrix plots such as DXHOM.
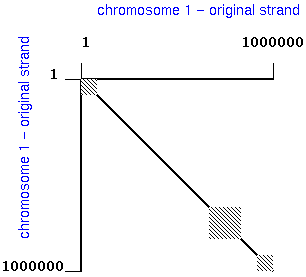
For example, comparison of an entire chromosome with itself might
give a plot like that shown below:

For each of the following, show how you would use a dot-matrix
plot to detect:
1) (1 point) A chromosome with an internal
tandem duplication.
2) (1 point) A chromosome with an internal
deletion, compared to the wild-type chromosome.
3) (1 point) A chromosome a terminal inversion,
compared to the wild-type chromosome.
4) (1 point) A reciprocal translocation between
two non-homologous chromosomes (you will need to draw two plots to
show this).
5) (1 point) The original example oversimplified
things a bit. Typically, when a self-self comparison is done using
real chromosomal sequences, the figure looks more like the one
below. Explain why we see these 'diamond' arrays of parallel
diagonals.

Notes:
a. By convention, the X-axis is numbered 5' to 3',
left to right, and the Y-axis is numbered 5' to 3', top to
bottom.
b. Use numbering on the X and Y axes to indicate the
orientation of each strand.