| DNA consists of three main elements: nitrogenous bases, five-carbon sugars, and phosphates. The four common nitrogenous bases used in DNA are cytosine, thymine, guanine, and adenine. RNA exchanges the deoxyribose sugar for a ribose sugar, and the nitrogenous base thymine for uracil. A single nucleotide consists of all three elements, while a nucleoside has only the base and sugar components. An important characteristic of DNA is that the phosphates in the backbone have an excess of negative charge. Even though other parts of the molecule may have positive changes, the backbone makes DNA and RNA negatively charged overall. |
|
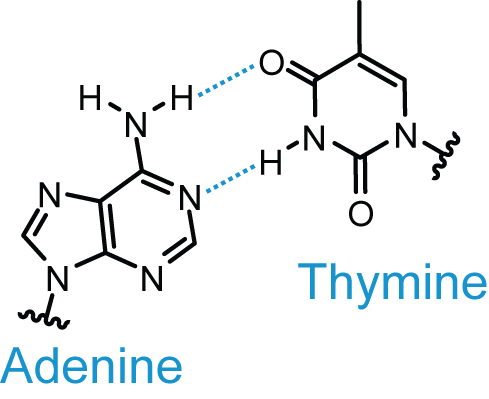
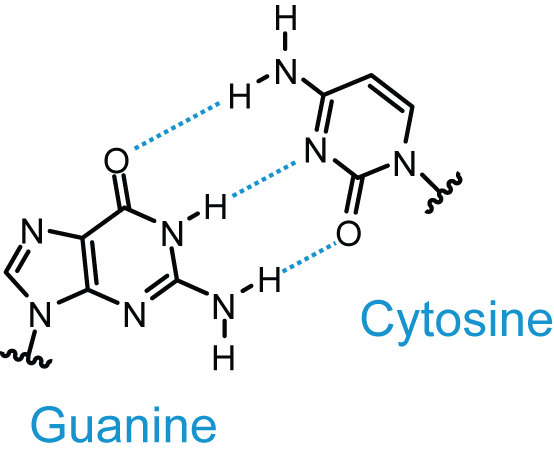
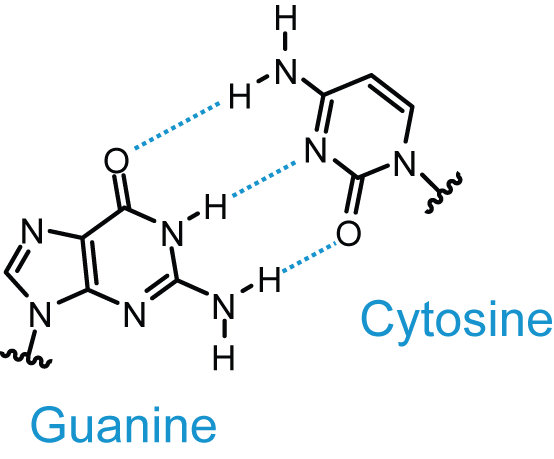
Base Pairing
 |
 |
| from http://upload.wikimedia.org/wikipedia/commons/a/a2/AT_DNA_base_pair.png |
from http://upload.wikimedia.org/wikipedia/commons/d/d3/GC_DNA_base_pair.png |
DNA molecules can be represented different ways: with the phosphates, without, or simply as a line with 5' and 3' ends indicated:
5' AGTAGCTACGACTACGACTAGC 3'
OR
5' pApGpTpApGpCpTpApCpGpApCpT 3'
OR
5' -------------------------------------------------- 3'
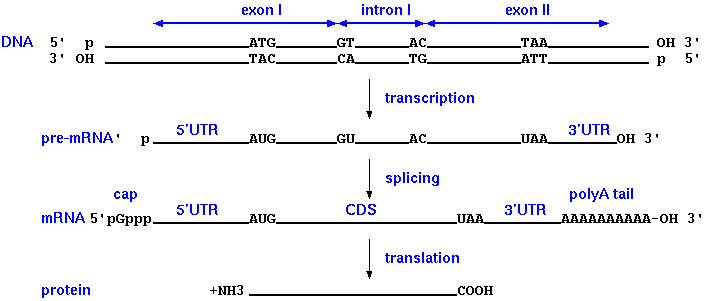
What is an intron?
An intron is the sequence spliced out of a pre-mRNA after transcription.
An intron is NOT:
- 5' or 3' UTRs
- non-coding DNA between genes
- synonymous with repetitive sequences (although repetitive sequences can be found within introns)
Nucleases are enzymes that cleave DNA. Endonucleases, then, are enzymes that cleave DNA within the strand, while exonucleases digest DNA from a free end. Restriction endonucleases, also sometimes called restriction enzymes, cleave only at specific sequences, and are used in cytogenetics to predictably cleave DNA in various experiments. A common restriction endonuclease is EcoRI, which is isolated from Escherichia coli.
|
Restriction enzymes come in many different types. EcoRI, with the other common restriction enzymes, are Type II. Type II restriction enzymes recognize and cleave DNA at the same site. That is, other types of restriction enzymes have their recognition sequences in one place but cut DNA at a different place. EcoRI recognizes the sequence 5'-GAATTC-3', and cuts between the G and the A. You might have noticed something interesting about that
sequence - it's an inverted repeat. That is, it's the same
5' --> 3' on each strand. This means that EcoRI makes
double-strand breaks, leaving uneven or sticky
ends. linked from https://www.mun.ca/biology/scarr/Fg15_01.gif |
 |
Examples of some of the hundreds of commercially-available
restriction enzymes
| EcoRI | G^AATTC | 5' protruding ends( Escherichia coli) |
| HindIII | A^AGCTT | " " " (Haemophilus influenza) |
| SmaI | CCC^GGG | blunt ends ( Serratia marcescens) |
| XmaI | C^CCGGG | 5' protruding ends (Xanthomonas
malvacaerum) an isoschizomer 1of Sma1 |
| PstI | CTGCA^G | 3' protruding ends (Providencia stuarti) |
| HinfI | G^ANTC | 5' protruding ends (H.
influenza). Degenerate recognition site. (GAATC,GAGTC,GACTC,GATTC) |
| HaeII | RGCGC^Y | 3' protruding ( H.
aegyptius ) 22=4 possible cuting sites: AGCGCC, AGCGCT, GGCGCC, GGCGCT |
| BglI | 5'GCCN NNN^NGGC3' 3'CGGN^NNN NCCG 5' |
3'protuding, (Bacillus globigii) |
| BbvI | 5'GCAGC(N) 83' 3'CGTCG(N) 123' |
asymetric, 3'recessed |
1isoschizomer - restriction endonucleases that recognize the same sequences |
||
Because genomes are very large, the cutting site for any given enzyme is likely to occur at a frequency proportional to the length of the recognition site. For example, EcoRI has a six base pair recognition sequence: GAATTC. This combination of nucleotides is likely going to occur every 4096 bases or so (4 nucleotides possible, 6 spots in recognition sequence: 46=4096). Another restriction endonuclease, TaqI, has a recognition sequence of four base pairs: TCGA. This combination of nucleotides is likely to occur much more often, about every 256 nucleotides (44=256). By using different restriction enzymes on genomic DNA, we can obtain fragments with different lengths distributions.
For more on restriction endonucleases, see REBASE ( http://rebase.neb.com ).
A mononucleotide occurs every
4 1=
dinucleotide
4 2=
tri-
4 3=
eg. codon
tetra-
4 4=
eg. TaqI
penta-
4 5=
eg. MboII
hexa-
4 6=
eg. HindIII
hepta-
4 7=
eg. AbeI
octa-
4 8=
eg. NotI
Gel electrophorsis is a powerful tool for assessing the types of
DNA in a mixture. By visualizing individual bands of DNA on a gel,
we can see the sizes of fragments, which gives us information on
whether the experiment has worked so far, allows us to verify the
identity of the DNA, and tells us whether or not the DNA is
degraded.
Agarose gel electrophoresis separates DNA
molecules based on size, by using a gel mesh and the application
of charge. We previously reminded you that DNA has an overall
negative charge, so it should make sense that DNA fragments would
migrate towards positive charge. DNA is loaded into wells, then a
current is applied. The negatively charged DNA migrates
toward the anode.
 A typical agarose gel electrophoresis setup. |
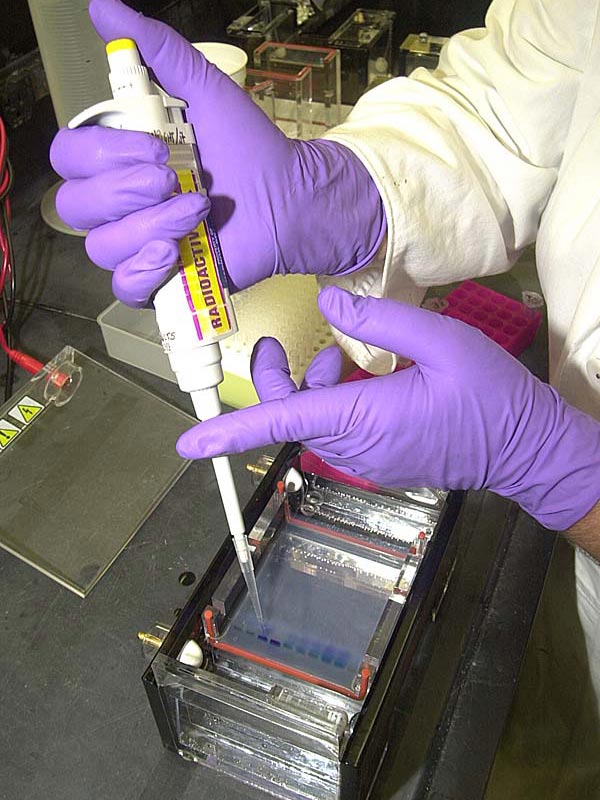 Image from NOAA:
Deep Sea Medicines Image from NOAA:
Deep Sea Medicineshttp://oceanexplorer.noaa.gov/explorations/03bio/background/molecular/media/gel_plate.html |
| The agarose gel is a mesh network of agarose
strands, which impede the motion of macromolecules moving
under current. Smaller molecules migrate faster since they
have more possible paths, and are impeded less by the gel.
Consquently, the fragments are separated based on size. The graph shows the relationship between length in bp and distance migrated by a DNA fragment during agarose gel electrophoresis. This relationship is represented by the equation Distance = a - b (log(M)), where M is the molecular weight in kilodaltons. |
 |
| After the gel has finished running, it can be
stained with a DNA-specific stain and visualised under UV
light. Note the use of the rightmost lane - a DNA sample with fragments of known lengths is loaded here, so we can estimate our sample fragment sizes. |
 |
| A restriction map is a
diagram of the distances between restriction sites. In the
example, a 1650 bp fragment has 1 site for SalI, and 2 sites
for KpnI. Depending on which enzymes we use to cut the
fragment, we can predict the bands that would be seen on a
gel. Restriction digests, for example, can be a quick way to verify whether a recombinant plasmid construct made in the lab is correct, before we use it for further experiments. |
 |
Caution! Do NOT try to measure the amount of DNA on a gel based on the intensity of fluorescent bands. First, the intensity of the bands on the gel increases in a non-linear fashion with respect to the mass of DNA. Secondly, the quantitaton of fluorescent intensity is also non-linear. While it is possible to measure fluorescent intensity, the gel would have to include a dilution series of fragments of known mass as internal standards.