Lecture 5, part 3 of 3
| PLNT4610/PLNT7690Bioinformatics
Lecture 5, part 3 of 3 |
Fortunately, the same
strategies that speed up pairwise searches can be applied to
database searches. The two most common database search packages,
FASTA and BLAST, both use lookup tables of k-tuple words to make
searches quick. Additionally, sites such as NCBI's BLAST server
employ high performance computers that have large numbers of
CPUs, allowing many pairwise comparisons to be performed in
parallel.
| NCBI |
FASTA |
|
| DNA vs.
DNA database |
blastn |
fasta3 ssearch3* (slow, full Smith-Waterman alignment) |
| protein
vs. protein database |
blastp |
fasta3 ssearch3 (slow, full Smith-Waterman alignment) |
| protein
vs. translated DNA database |
tblastn |
tfasta3 |
| translated
DNA
vs. translated DNA database |
tblastx |
tfastx3, tfasty3 |
| translated
DNA
vs. protein database |
blastx |
fastx3, fasty3 (especially
well-suited for cDNAs, which often contain frameshift
errors) |
| protein
vs. protein database (iterative refinement of hits) |
psi-blast |
|
| protein
pattern vs. protein database |
phi-blast |
|
| *It
is
worth pointing out that BLAST comparisons are always an
approximation. BLAST does not do a complete Smith-Waterman
alignment. When you want optimal alignment, use SSEARCH. |
||
There are a number of
more specialized BLAST programs than are listed here. A more
complete listing of BLAST programs can be found at
https://blast.ncbi.nlm.nih.gov/Blast.cgi.
Programs such as tblastn, blastx and tblastx do an automatic translation which is very simplistic. On each strand of a DNA sequence, every 3 nucleotides in each of 3 reading frames is used as if it were codon. This is a blind translation, not taking into account any information on annotated features such as CDS, intron, exon etc. The example below shows a putative 90 bp query DNA, translated in 6 reading frames.
|
9
18
27
36
45
54
63
72
81 90 GTTTACCCGCCAATATATCCTGTCAAACACTGATAGTTTAAACTGAAGGCGGGAAACGACAATCTGATCATGAGCGGAGAATTAAGGGAG CAAATGGGCGGTTATATAGGACAGTTTGTGACTATCAAATTTGACTTCCGCCCTTTGCTGTTAGACTAGTACTCGCCTCTTAATTCCCTC V Y P P I Y P V K H * * F K L K A G N D N L I M S G E L R E F T R Q Y I L S N T D S L N * R R E T T I * S * A E N * G S L P A N I S C Q T L I V * T E G G K R Q S D H E R R I K G V 82 73 64 55 46 37 28 19 10 1 CTCCCTTAATTCTCCGCTCATGATCAGATTGTCGTTTCCCGCCTTCAGTTTAAACTATCAGTGTTTGACAGGATATATTGGCGGGTAAAC GAGGGAATTAAGAGGCGAGTACTAGTCTAACAGCAAAGGGCGGAAGTCAAATTTGATAGTCACAAACTGTCCTATATAACCGCCCATTTG L P * F S A H D Q I V V S R L Q F K L S V F D R I Y W R V N S L N S P L M I R L S F P A F S L N Y Q C L T G Y I G G * P L I L R S * S D C R F P P S V * T I S V * Q D I L A G K |
Each of the six amino
acid sequences in the query are compared with each amino acids
sequence in the database. In most cases, only one reading
frame would give a hit. Hits found using automated translation
cannot be considered optimal alignments, but they do at least
indicate when a significant similarity is found.
One example in which
automatic translation is useful would be when comparing a single
sequencing read against a database. Sequencing reads have high
error rates which could include frameshift mutations. Even so,
if enough of the read generates a significant hit in one reading
frame, this serves to identify the gene that the read
corresponds to.
 |
 |
Aside from
the scale of the search itself, server-implemented database
searches have additional layers of complexity. The servers must
be able to schedule and process requests from a number of
different types of web clients. In the case of NCBI, over
100,000 requests per day. (1 day = 86,400 seconds, so that is
more than one request processed per second.)
At NCBI, requests from web browsers or PC-based client programs
are read by an interface layer, which sends the specifics of the
request to a database server.
The Queuing Components server schedules jobs and monitors the
progress of jobs. It launches searches, sending each query
sequence to one of 280 Worker Nodes, which are Linux servers,
each of which has multiple CPUs and large amounts of memory.
Each worker node stores part of the database in memory, such
that the entire binary database is stored permanently in memory.
This is a critical speedup step, because simply reading the data
from disk can be a major bottleneck in database searches. The
time required for a program to read data from a disk drive is
much slower than reading data from RAM (random access memory).
Collectively, the worker nodes store two complete copies of the
data to increase the throughput.
When a query has been compared to all parts of the database as
requested, the results are returned to the client.
2. Statistical significance of hits
In comparison to
pairwise searches, database searches carry some additional
problems. The most critical is evaluating the statistical
significance of a match. Statistical significance depends on the
size of the query sequence, the size of the database, and the
sample of sequences represented by the database.
The larger the database, the higher the probability of finding a match at a particular score by random chance. Therefore, as the size of the database increases, the score required to infer statistical significance is greater. However, it has been observed that in database searches, sequence scores are not distributed according to a Gaussian (normal) distribution.
The Extreme Value Distribution (EVD) does show a good fit to observed score distributions.
![]()
where
E (the "E value") is the expected number of hits with score >= S
m is the size of the query sequence
n is the size of the database
and K are empirically derived constants for the scoring system and the search space size, respectively
The critical
observation to make about the EVD is that the right tail,
representing the highest scores, is strongly skewed, compared to
a normal distribution. This means that a normal distribution
would predict a much lower number of expected scores above some
high score S. Consequently, the significance of some
high scores might be tremendously overestimated. Put simply, the
normal distribution would judge many similarities to be
significant which were not significant. The right tail of the curve
is shown in the inset on an expanded scale. Remember,
scores in this region are simply part of the random
distribution of scores. By definition, they are not deemed to be
significant.
Significant hits are
those which have higher scores than would be expected from the
EVD. MyoglobinFASTAresults.html
shows a histogram of scores from a FASTA search of a myoglobin
protein against the Uniprot database. The asterisks (*) give the
expected distribution of scores from the EVD. The equal signs
(=) give the observed score distribution. Note a peak in the
observed scores > 130. This region of the graph is expanded
as an inset, showing numerous scores with very high values.
These are the significant hits.
| E values in BLAST and
FASTA The most important difference between BLAST and FASTA is the way in which the E values are calculated. Both FASTA and BLAST start with the calculation of probabilities for a similarity of a given score between two randomized sequences of the same size, with equivalent amino acid compositions. BLAST - K and
are pre-calculated from a sample of
10,000 randomly-shuffled sequences BLAST therefore
calculates E values based on the total length
of the database.FASTA - K and are calculated from the actual distribution
of similarity scores obtained in each search. This
makes FASTA slower than BLAST, since FASTA must
calcluate an approximate similarity score for
every sequence in the database. FASTA thus
calculates E values based on the number
of sequences in the database.Pearson, W. R. and Wood, T. C. (2001) Statistical significance in biological sequence comparison. Handbook of Statistical Genetics, Balding, D. J., Bishop, M. and Cannings, C. eds. London:Wiley pp. 39-65 PDF version |
A good summary of the
statistical issues related to database similarity searches can
be found in "The Statistics of Sequence Similarity Scores" by
Stephen Altschul at NCBI [
http://www.ncbi.nlm.nih.gov/BLAST/tutorial/Altschul-1.html
].
Speed
Sensitivity
| sequence |
complexity |
AAAAAAAAAA |
1 |
ATATATATAT |
2 |
ATGATGATG |
3 |
ATGCATGC |
4 |
ATGCCATGCC |
5 |
Low complexity sequences are sequences which contain many repeats of short sequence elements. Sequences with skewed amino acid or nucleotide compositions will have a low complexity. When two sequences with similarly skewed compositions are compared, the probability of local similarities is much greater than for pairs of sequences with fairly even compositions. For example, two A/T-rich DNA sequences are far more likely to have matches by random chance than sequences in which all four nucleotides are present at a frequency of approximately 0.25.
Example: Comparison of maize and rice hydroxyproline-rich glycoproteins
SSEARCH searches a sequence data bankThe alignment is deceptive, because the high percentages of Hydroxyproline, Lysine and Tyrosine ensure than a very large number of alignments could have very high scores. This is best illustrated in the dot-matrix plot of the same comparison:
version 35.04 Oct. 7, 2008
Please cite:
T. F. Smith and M. S. Waterman, (1981) J. Mol. Biol. 147:195-197;
W.R. Pearson (1991) Genomics 11:635-650
Query: bio537987931014488970.tmp.seq1
1>>>S20500 369 bp - 369 aa
Library: bio537987931014488970.tmp.seq2 350 residues in 1 sequences
350 residues in 1 sequences
Statistics: (shuffled [500]) MLE statistics: Lambda= 0.0325; K=6.695e+07
Algorithm: Smith-Waterman (SSE2, Michael Farrar 2006) (6.0 Mar 2007)
Parameters: BL50 matrix (15:-5), open/ext: -10/-2
Scan time: 0.090
The best scores are: s-w bits E(1)
S22456 350 bp ( 350) 1539 46.2 1.6e-09
>>S22456 350 bp (350 aa)
s-w opt: 1539 Z-score: 203.2 bits: 46.2 E(): 1.6e-09
Smith-Waterman score: 1539; 62.8% identity (73.0% similar) in 392 aa overlap (1-369:1-349)
10 20 30 40
S20500 MGGK--AALLMVLVAMSVVLEARADAGGYGGGYTPTPTPVKPAPKPEKPP----------
:::. ::::..:::.:...: .:::: :: :::::::. :.:::::::
S22456 MGGSGTAALLLALVAVSLAVEIQADAG-YG--YTPTPTPATPTPKPEKPPTKGPKPEKPP
10 20 30 40 50
50 60 70 80 90 100
S20500 KEHKPPHHHEPKPEKPPKEHKP--PAYTPPKPTPTPPTYTPTPKPTPPPYTPKPTPPAHT
::::::..: :::::::::::: :.::: .: :::::::::: ::: :::::::..:
S22456 KEHKPPKEHGPKPEKPPKEHKPTPPTYTP-SPKPTPPTYTPTP--TPP--TPKPTPPTYT
60 70 80 90 100 110
110 120 130 140 150 160
S20500 PTPPTYTPTPTP-PKPTPPTYKPQPKPTPAPYTPTPTPPMYKPQPKPTPA--PYTPTPTP
:.: . ::::: : :::::: :.::: : :: :::: : :.::: :: : :: :::
S22456 PAPTPHKPTPTPKPTPTPPTYTPSPKP---P-TPKPTPPTYAPSPKP-PATKPPTPKPTP
120 130 140 150 160
170 180 190 200 210 220
S20500 PTYKPQPKPTPPPYTPTPAPPTYKPQPKPNPPPTYKPAPKPTPTPYQPAPPTYKPQPKPN
::: :.::: : :: :.:::: :.:::.:: :: :.::: ::: .:.:::: :.:::
S22456 PTYTPSPKP--P--TPKPTPPTYTPSPKPTPP-TYTPSPKP-PTP-KPTPPTYTPSPKP-
170 180 190 200 210
230 240 250 260 270
S20500 PPPTYKPQPKPNPPPTYKPAPKPTPTPYKPAPPTYKPQPKP---NP-PPTYKPQPKP-TP
: : : :::.:: :: :.::: ::: ::.:::: :.::: .: :::: :.::: ::
S22456 -PATKPPTPKPTPP-TYTPSPKP-PTP-KPTPPTYTPSPKPPATKPTPPTYTPSPKPPTP
220 230 240 250 260 270
280 290 300 310 320 330
S20500 TPYTPPTYKPQPKP-TPTPTPYTPTPKPNPPPTYKPQPKPTPTPTPYKPQPKPTPSPYTP
: ::::: :.::: :: ::: : ::.:.:: : : ::::: :: : : :::
S22456 KP-TPPTYTPSPKPPTPKPTPPTYTPSPKPPATKPPTPKPTP-PT-YTPTPKP-------
280 290 300 310 320
340 350 360
S20500 KPTPTPPTYTPTPTPPYHKPPPSYTPGPPPPY
:. :::::::: : :.::.:::::
S22456 -PATKPPTYTPTP-------PVSHTPSPPPPYY
330 340 350
It's easy to see that the HPRG proteins would show high scores with any protein containing a high proline content.P2HOM Version 5/13/91
X-axis: S20500
Y-axis: S22456
SIMILARITY RANGE: 10 MIN.PERCENT SIMILARITY: 40
SCALE FACTOR: 0.90 COMPRESSION: 10
100 200 300
Y . . . .
W . . . .
WV de Z c b d . d cc .
N WSXZTTXYVVXW.bd bd bcLLWWWWY .
XQZX Uadbaea XcXYcYYYcaYeZcMaYa b .
IIK cd . .d c .
PIJcd. . . c .
NSKTSURXRZYZUW .c cY bYX aaZWe .
d QHIQPLLONJITVQTVVQRVQSRUURQKcc .
100 ...V...UMIMJSLNJKJWbTYbbTWbSVSUWTQGLZ...
dZ NMMLLLSRROQQYUWZYUTbWXUQaPPNOe .
Va UPMSLXTVTVSVaZVd ZV aZVTaUPOUb .
dd LJPOTTTUTQQScVZccVZcUTOSRVLHW .
dd ZISOMTUXSPPSYaWYXaWWWXPTaZVIUZ .
bb QPQQQNVRTNSRXWWYXWTXYUXUYTVQZ .
ce aSYeYUYbadYbYbZYbaZaYXVWXXd cW .
e MLLPNOSSQONRYTVXYTSYSUTZXUTNZZ .
db ZNPSPVSVQSNTYXWYXXWWWWUTaRUOUa .
ed OHOPPLUPUKRPUSTVUSRUQRRUVRONYb .
200 ...dd..QIJQPQNWPRKUXQWXXQUXQVTWURSLYZ...
eb dOMNOQNTRTNPRYWWYXWTWWUUTYRSNUe .
a aaMMPPOSaSPOSXZWYXZUXXUVUXdVNUZ .
ed dMLMRTPSSUPPabTabZTYbSWUZXUURa .
dd ZLLPNOSSQONRYaVXXaSWWUTWaZTNUZ .
eb dOMMOPNSRSNORXWWYXWTXWUUTYRSNZZ .
ab ccQNORVSXSVPWbXYbaXWYTXWUZUXOUa .
dd dRNSLLPTWRSOVYXVXXXSWWRVWaVVPbZ .
eb dOMNOQNTRTNPRYWWYYWTYWUUTYRSNUe .
dd ZLOSNPSXQONRYaVXXaSWWVTTaZTNUZ .
300 ...db.dOMMOPNSRSNORXWWYXWTXWUUUYRSNZZ...
ad aSScWSYbadYbYbZYbaZaYXVWVXdccUe .
Z KJLMMOOSOPLSXTWYXTUXSUSUXUUKZZ .
Ye ZVOaVMWOXOXMVbZYbbZYaYVWTXYYJRe .
XUbWXXaaaaZbaeZbaeZaeabZdedWca .
BLAST from NCBI preproccesses all sequences to mask low complexity regions [http://www.ncbi.nlm.nih.gov/blast/blastcgihelp.shtml#filter].
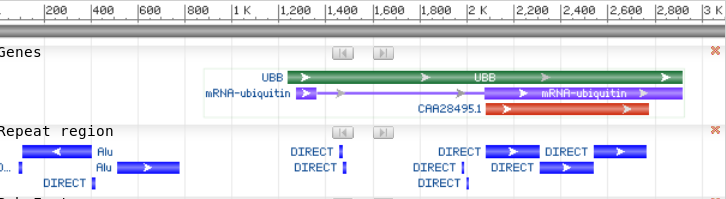
Particularly when using genomic DNA sequences in database searches, a smaller unique sequence is the best query sequence, rather than a long sequence.
BLAST from NCBI
automatically checks query DNA sequences for known repetitive
elements such as AluI, and flags the presence of these sequences
in the output.
| What if I use BLAST to
search the Human Genome with an AluI family sequence? (eg. HUMRSA27) Do NOT try this at home! You'll just get the same results, and add load to the NCBI servers. |
|
| type of
search |
result |
| blastn with defaults |
"No significant similarity
found" This is because BLAST automatically filters out known
repeats such as AluI. |
| blastn; no filtering for
species-specific repeats |
268967 hits. For a 262 base
search sequence, this corresponds to 7 x 10⁷
bases. Since the human genome is about 3 x 10⁹
bp, a BLAST search would estimate that about 2.3% of the
human genome is AluI family sequences. |
| blastn; no filtering for
species-specific repeats; discontiguous megablast which
breaks the query words into shorter words, which in effect
allows gaps within the larger query words |
430533 hits. For a 262 base search sequence, this corresponds to 11.3 x 10⁷ bases. Since the human genome is about 3 x 10⁹ bp, a BLAST search would estimate that > 3.8% of the human genome is AluI family sequences. |
| PLNT4610/PLNT7690Bioinformatics
Lecture 5, part 3 of 3 |