Molecular markers - Polymerase chain reaction
 Most methods for keeping track of DNA sequences in a genome
use an enzymatic reaction known as the Polymerase Chain Reaction (PCR).
In PCR, enzymes called DNA polymerases can be used to make millions of copies
a DNA sequence in a test tube containing DNA from any species.
To determine which sequence, out of the entire genome, will
be amplified, short DNA molecules called primers are added to the reaction.
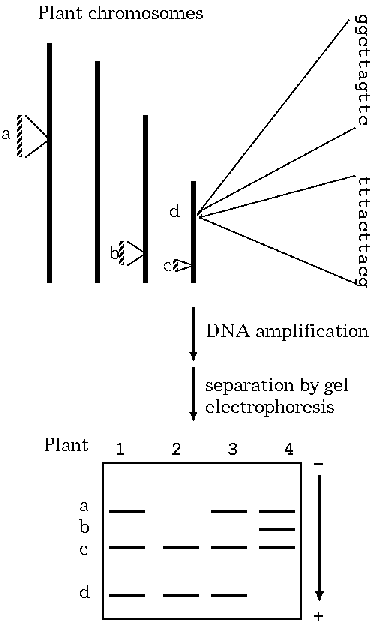
Wherever the primers (top right) occur by in the genome, the DNA
sequence between those primer sequences will be replicated millions
of times. In the example, the priming sites occur by random chance at
four sites on three different chromosomes. At each site, the primers
occur at different distances from one another, so different sized
DNA sequences are amplified.
To distinguish among the different sequences amplified, the
DNA fragments produced by PCR are separated by gel electrophoresis.
The DNA mixture is loaded to a slab of agarose gel (a little like thick
Jello), and an electric current is applied. The negatively-charged DNA
migrates towards the positive pole (anode). However, the longer the
DNA molecule, the more its movement is impeded by the gel, and the
more slowly it migrates. Consequently, smaller DNA molecules will
run rapidly, and large ones will run slowly. In this example,
four different size classes of DNA are shown, representing
the four different sequences amplified at each of sites a, b, c
and d.
We can distinguish one plant from another, or one cultivar from another
on the basis of differences in DNA sequence. In the example, DNA from
plant 1 allows the amplification of sequences a, c and d, but not b.
This indicates that in plant 1, priming sites for the primers used
are not present at sequence b. Similarly, a DNA change (mutation)
at one of the priming sites for sequence a has prevents it from
being amplified when DNA from plant 2 is used.
Most importantly, the DNA differences between two
plants, cultivars, or species can be visualized by comparing
the patterns of DNA bands on a gel.
 previous page
 next page
 Most methods for keeping track of DNA sequences in a genome
use an enzymatic reaction known as the Polymerase Chain Reaction (PCR).
In PCR, enzymes called DNA polymerases can be used to make millions of copies
a DNA sequence in a test tube containing DNA from any species.
To determine which sequence, out of the entire genome, will
be amplified, short DNA molecules called primers are added to the reaction.
Wherever the primers (top right) occur by in the genome, the DNA
sequence between those primer sequences will be replicated millions
of times. In the example, the priming sites occur by random chance at
four sites on three different chromosomes. At each site, the primers
occur at different distances from one another, so different sized
DNA sequences are amplified.
 previous page
 next page