Tamayo P, Slonim
D, Mesirov J, Zhu Q, Kitareewan S, Dmitrovsky E, Lander ES, Golub TR (1999)
Interpreting patterns of gene expression with self-organizing maps: methods
and application to hematopoietic differentiation. Proc Natl Acad Sci U
S A
16;96(6):2907-12
Törönen P, Kolehmainen M, Wong G, Castrén E (1999)
Analysis of gene expression data using self-organizing maps. FEBS Letters
21;451(2):142-146.

Tamayo and coworkers have applied Self-Organizing Maps (SOM) to grouping
gene expression data. In Figure 1., they illustrate very simple X,Y
data as groups of raw datapoints as black dots. Such a dataset might represent,
for example, a measurement on a wild-type gene on the X-axis, and a measurement
on a mutant gene on the Y-axis. A timecourse with n-timepoints would
therefore be represented in n dimensions. Just looking at the datapoints,
it looks as if there are distinct groups.
The goal is to find sets of X,Y points that most closely-approximate
the mean value for each group of points. SOMs begin by arbitrarily creating
a set of nodes (N) with randomly-assigned values. In the example, a set
of six nodes (1-6) are randomly placed in the X,Y space.
For each iteration of the algorithm, a datapoint P is chosen, and the
position of each node is changed to move it closer to P. The closer a node
N is to point P, the greater the distance it is moved towards P. This process
is continued for thousands of iterations, until the total change is lower
than some threshold.
The net result is that all nodes will be moved many times, but each
node will "come to rest" in the vicinity of the set of datapoints to which
it is closest.
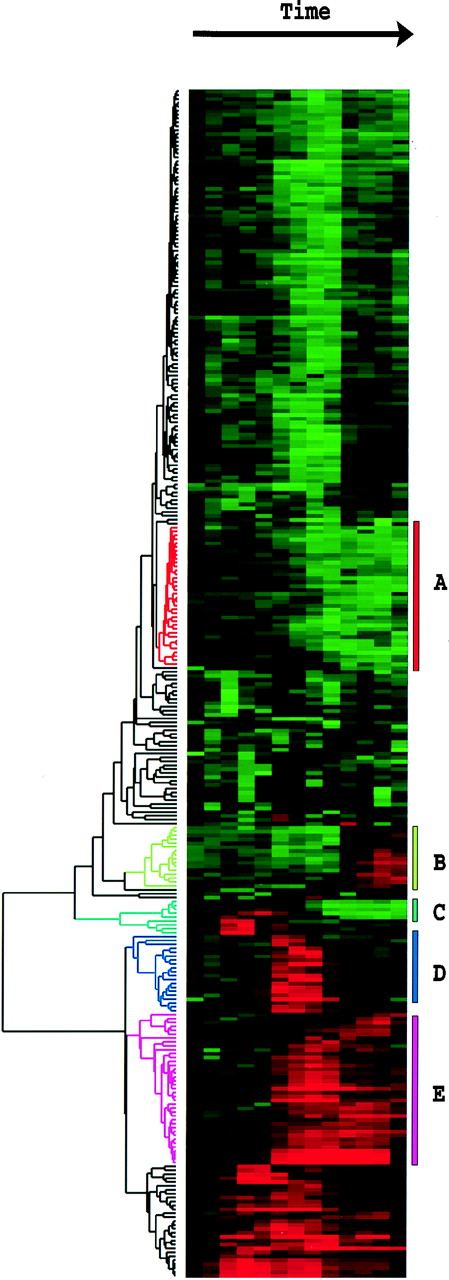
For example, Tamayo et al. studied 6000 human genes in myeloid leukemia
cell line HL-60, in response to phorbol ester PMA, which stimulates macrophage
differentiation. 567 genes were shown to change significantly with addition
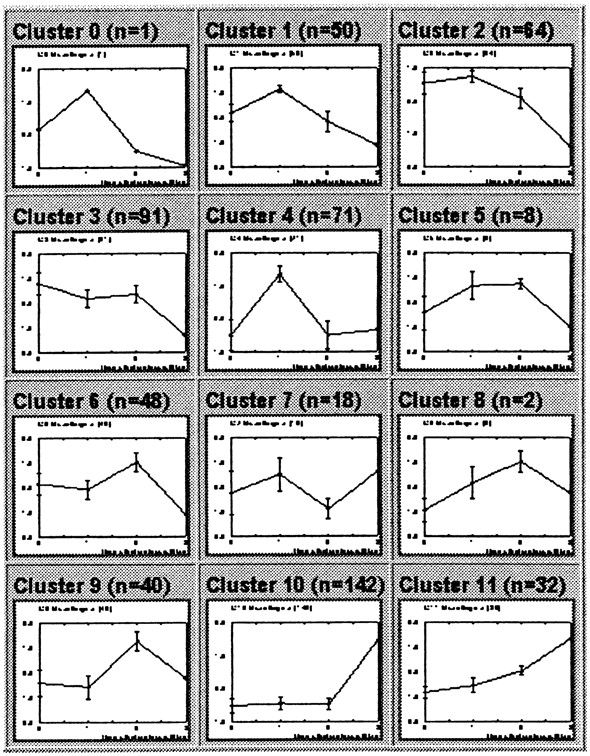
of PMA. Expression data were modeled onto a 3 x 4 array in which each node
in the array had a randomly-generated timecourse curve. Each iteration
consisted of selecting an actual timecourse curve for a human gene, and
modifying all 12 randomized curves to fit that timecourse. The curves most
closely-matching the data were modified to strongly resemble the data.
Curves that were less closely-related to the data to begin with were underwent
less modification. The 12 resultant curves are shown below:
The authors point out that, "An SOM based on a rectangular grid is analogous
to an entomologist's specimen drawer,with adjacent compartments holding
similar insects."