![]() Summer
of 2004 satellite images of Manitoba’s Great Lakes
Summer
of 2004 satellite images of Manitoba’s Great Lakes
MODIS images
The satellite images on this page were recorded
by the Moderate Resolution Imaging Spectroradiometer (MODIS) now orbiting
aboard two of NASA’s satellites, Terra and Aqua. Unless otherwise noted, the actual colour
renditions were prepared by the MODIS Rapid Response Team out of the University
of Maryland who provide near-real time colour composite images on their web
site http://rapidfire.sci.gsfc.nasa.gov/realtime/
-- except that I have changed the tone curve to emphasize colour differences in
the lake, at the expense of brighter areas like clouds.
Click on
each underlined date below to view a larger copy of the image.
18:20 1 December 2004 19:10 2 December 2004
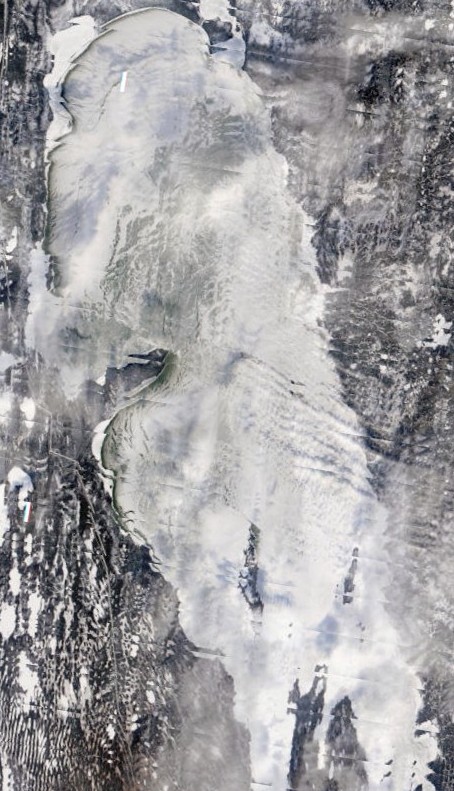
Between
the 26th of November and the 1st of December,

19:25 26 November 2004
Ice
cover looks pretty solid over the shallow bays, and has started to form in the
Note
that the colours in these images have been adjusted differently compared to
images from earlier this year – trying to deal with the high contrast and still
discriminate colours in the lake. As a
result, the intensity of greens and tans is exaggerated and their relationship
with water quality parameters is not quantitatively the same as in the ealier images.
19:30 12 November 2004 17:35 14 November 2004
Remarkably,
the turbid plume created during the strong winds of early October is still
visible in the central
You
can also see the turbid plume of the

27, 30 September & 6 October 2004 The
That
was a strong blow. It peaked at a mean
hourly speed of 82 km/h measured at the


Surface algal blooms in the


Wind
and waves on the north shore at George’s
12:50 25 September 2004 12:05 24 September 13:50 24 September 12:50 25 Sept. 2004
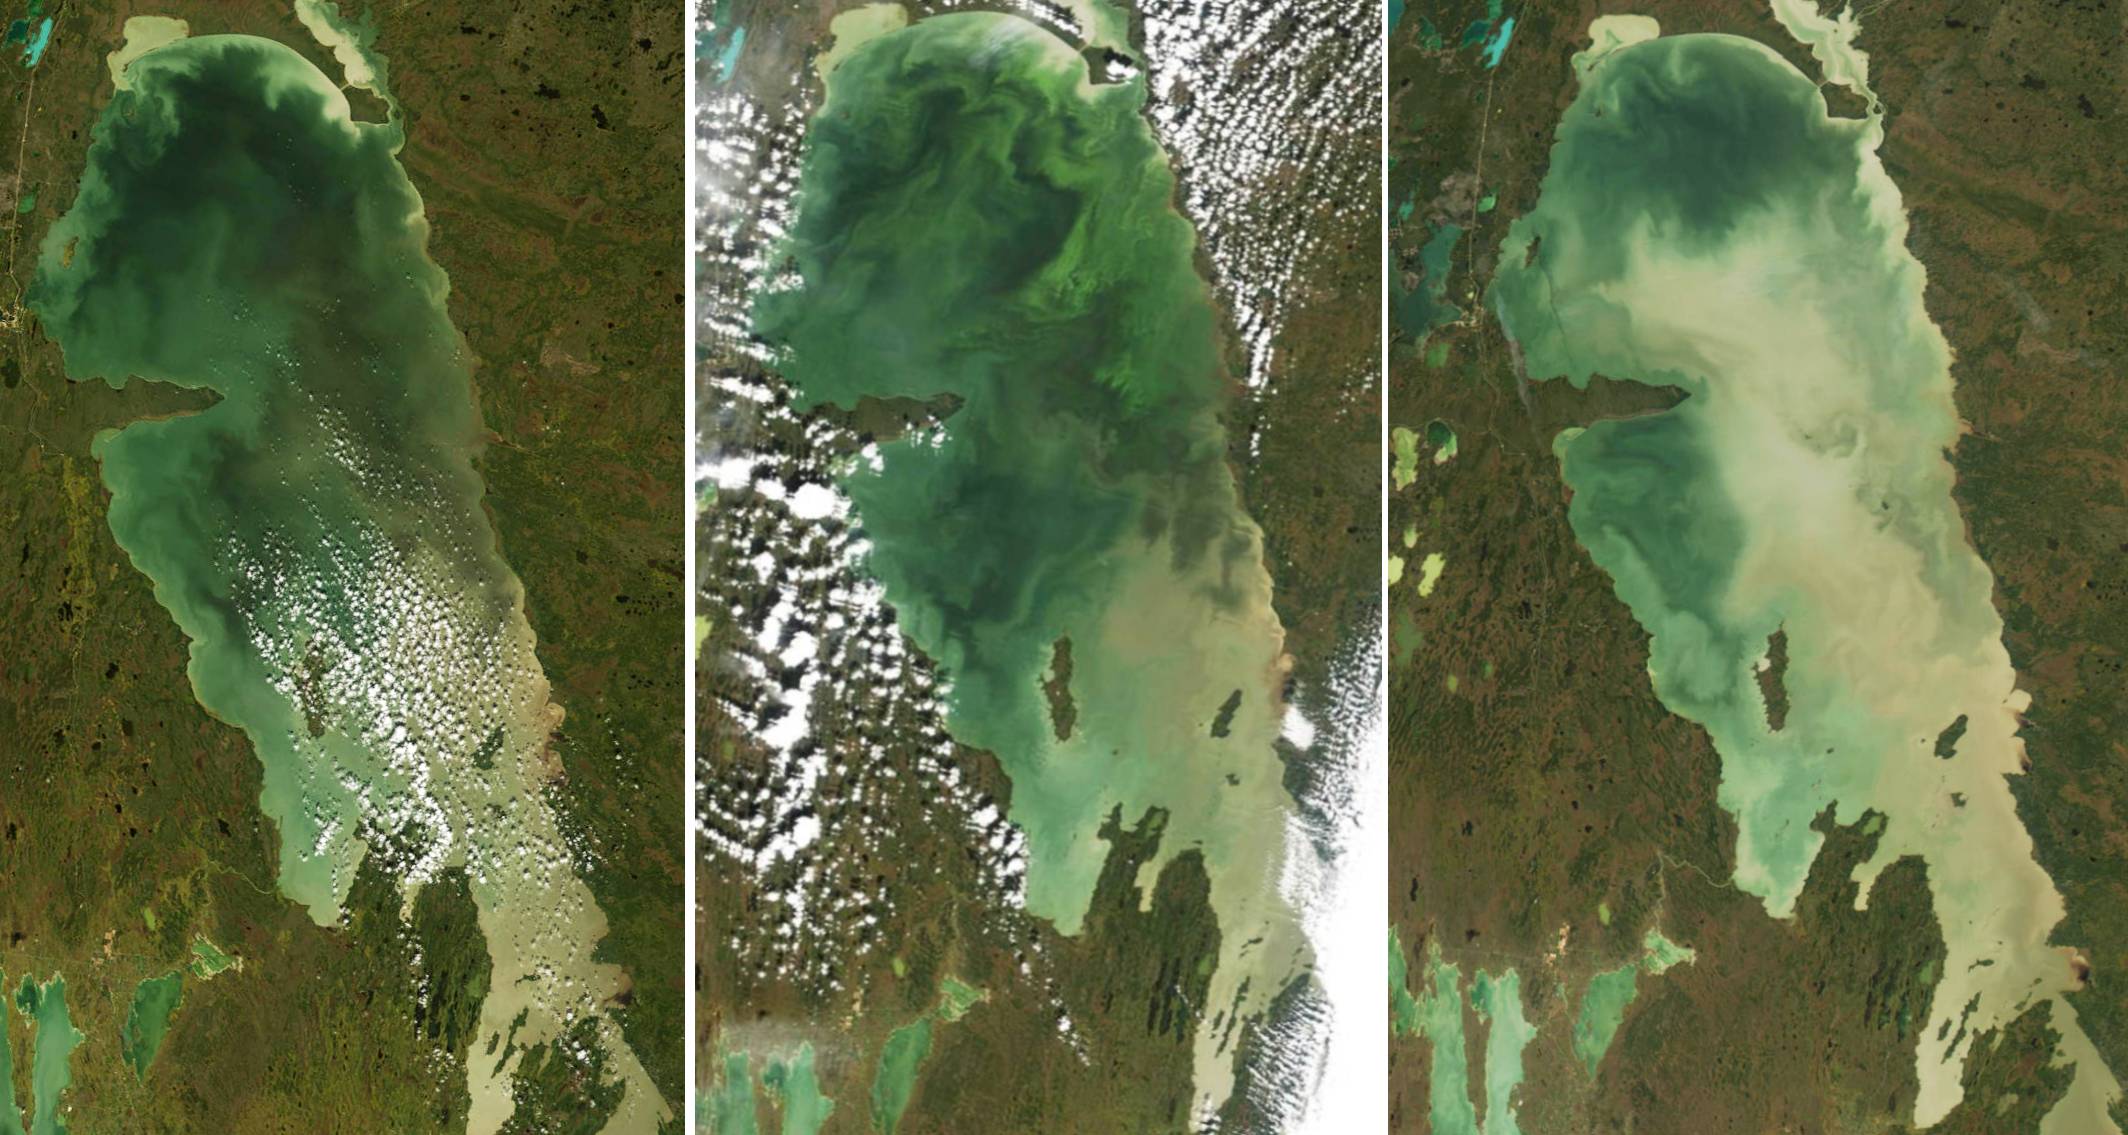
I
posted the group of North Basin images on the right to show how quickly the
apparent intensity of an algal bloom viewed from space can change. The first of the set were recorded at 12:05
and 13:50 on the 24th. You
can see the same patterns in the colours, but the green in the northeast
quadrant, north of Georges Island, is much brighter in the earlier image. And in exactly the same region, there is no
sign of the bloom a day later. The
blue-greens actively regulate their buoyancy and work their way up into the
bright near-surface environment when they can.
I suspect that it was calm enough on the 24th to do just
that, though the winds may have started up sometime before the second
image. (I don’t have the weather data
for the 24th, though I do for the 25th. Environment Canada allows a few days’ delay between
posting the latest 24 h weather and posting the historic climate record – the
data for the 24th will be posted sometime next week. You can get both current weather and historic
climate by following the links at http://www.weatheroffice.ec.gc.ca/canada_e.html.) On the afternoon of the 25th,
winds at Norway House (just to the north of Lake Winnipeg) were strong
westerly, gusting to 30 km/h all afternoon. With winds like that, there would
have been 1 or even 2 m waves in the eastern region, so that algae that had
floated to the surface would have been mixed back deep into the water
column. The lesson I take from this is
that these images are showing us only surface
blooms. Any single image cannot indicate
the absence of algae in the water
column (it didn’t all die between the 24th and 25th – it
was merely mixed downwards for the time being) although a bright green patch
does definitely indicate its presence
in abundance. Its
only through a cumulative look at a lot of images each year – and knowing
weather conditions associated with each -- that we can fairly compare frequency
of blooms from year to year. But there
are a lot of images, and these blooms can be identified on weather satellites
that have been recording scenes of the lake every day or so since the early
1980s. So we’re doing just that –
looking at as many cloud-free images as we can find each year and finding out
what the historic record of satellite imagery can tell us about whether/how
much the frequency and extent of such surface blooms may have changed over the
last couple of decades.
By
the way, for anyone who wonders. Yes, there are often two images of the lake
on a given day. And
then often not another for a couple of days, even without the problem of
clouds. NASA now operates two
satellites with the MODIS instrument on board.
Each covers most of the earth each day.
Unfortunately, Lake Winnipeg is centred in only about every third day’s
image by each satellite – and that on the same day. When Lake Winnipeg is way off to the side,
the image is so distorted as to be unuseable. You can see some distortion (they are only
partly corrected) in the images on the 24th compared to the 25th,
above. The satellite passed nearly
overhead on the 25th, but it captured the scene at 12:05 on the 24th
in its peripheral vision from way out over Saskatchewan.
 13:10 21
September 2004
13:10 21
September 2004 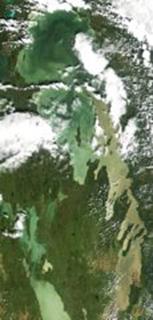 13:05 14
September 2004
13:05 14
September 2004
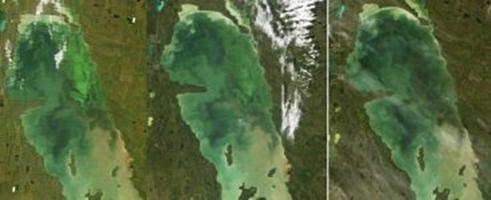
No
sign of the surface blooms of August in these September images, but it would
have been difficult for algae to have concentrated near the surface given the
very strong south winds of the last few days.
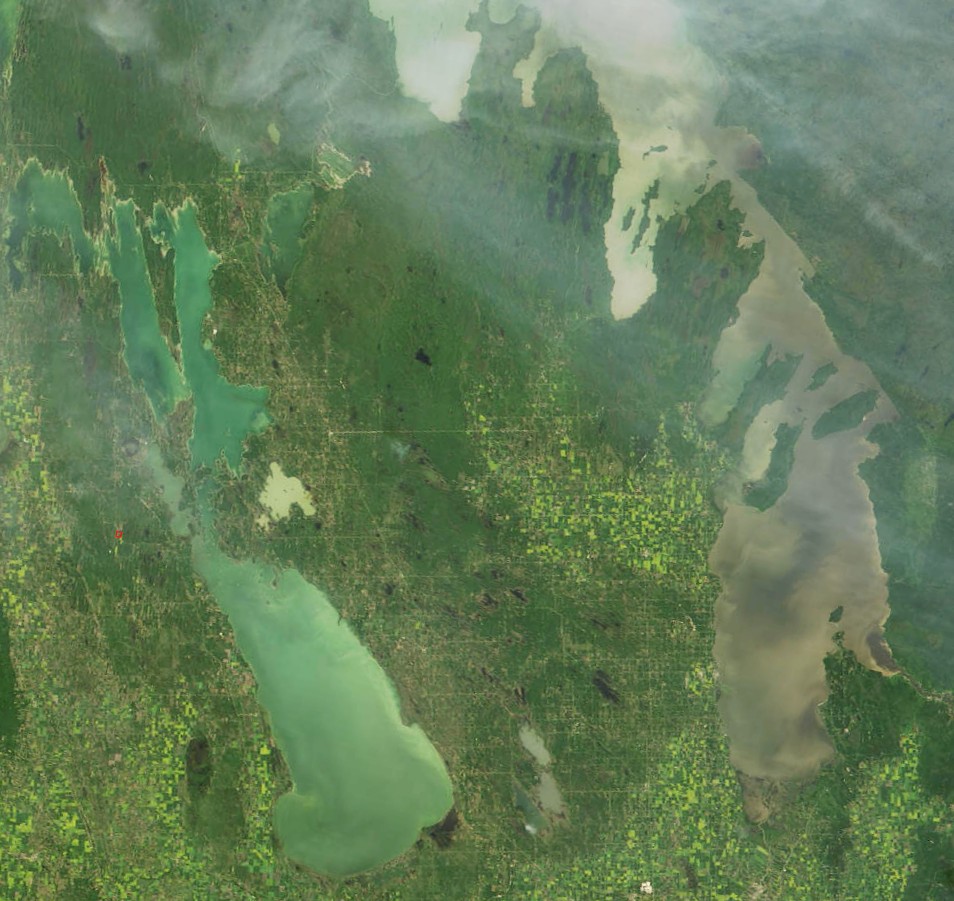
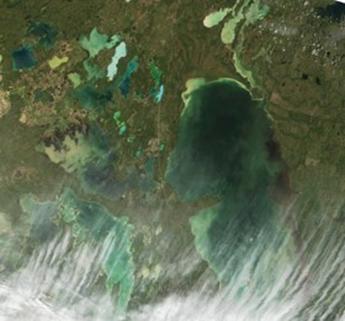
The soft greens in the eastern and central
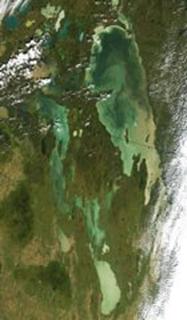
For
those of you who read Helen Falding’s article in the
Free Press a couple of weeks ago, you can see Limestone Lake clearly in this
image. It’s the bright blue lake just
northwest of Lake Winnipeg. In the
article, Derek Ford of McMaster University explained the colour as the result
of calcite precipitating – a phenomenon called a ‘whiting’ which he said turns
the lake a beautiful chalky blue, or turquoise, or even emerald green depending
on the temperature. It’s a karst lake, meaning that its in a
terrain formed partly by dissolution of the limestone bedrock – hence the high
calcium carbonate content of the water.
Its also near a potential mine development, and the lake that the
Canadian Parks and Wilderness Society are lobbying to have it incorporated in
the National Park being developed along the shore of Lake Winnipeg. There is another pale blue lake to the
southeast of Limestone, Clearwater Lake.
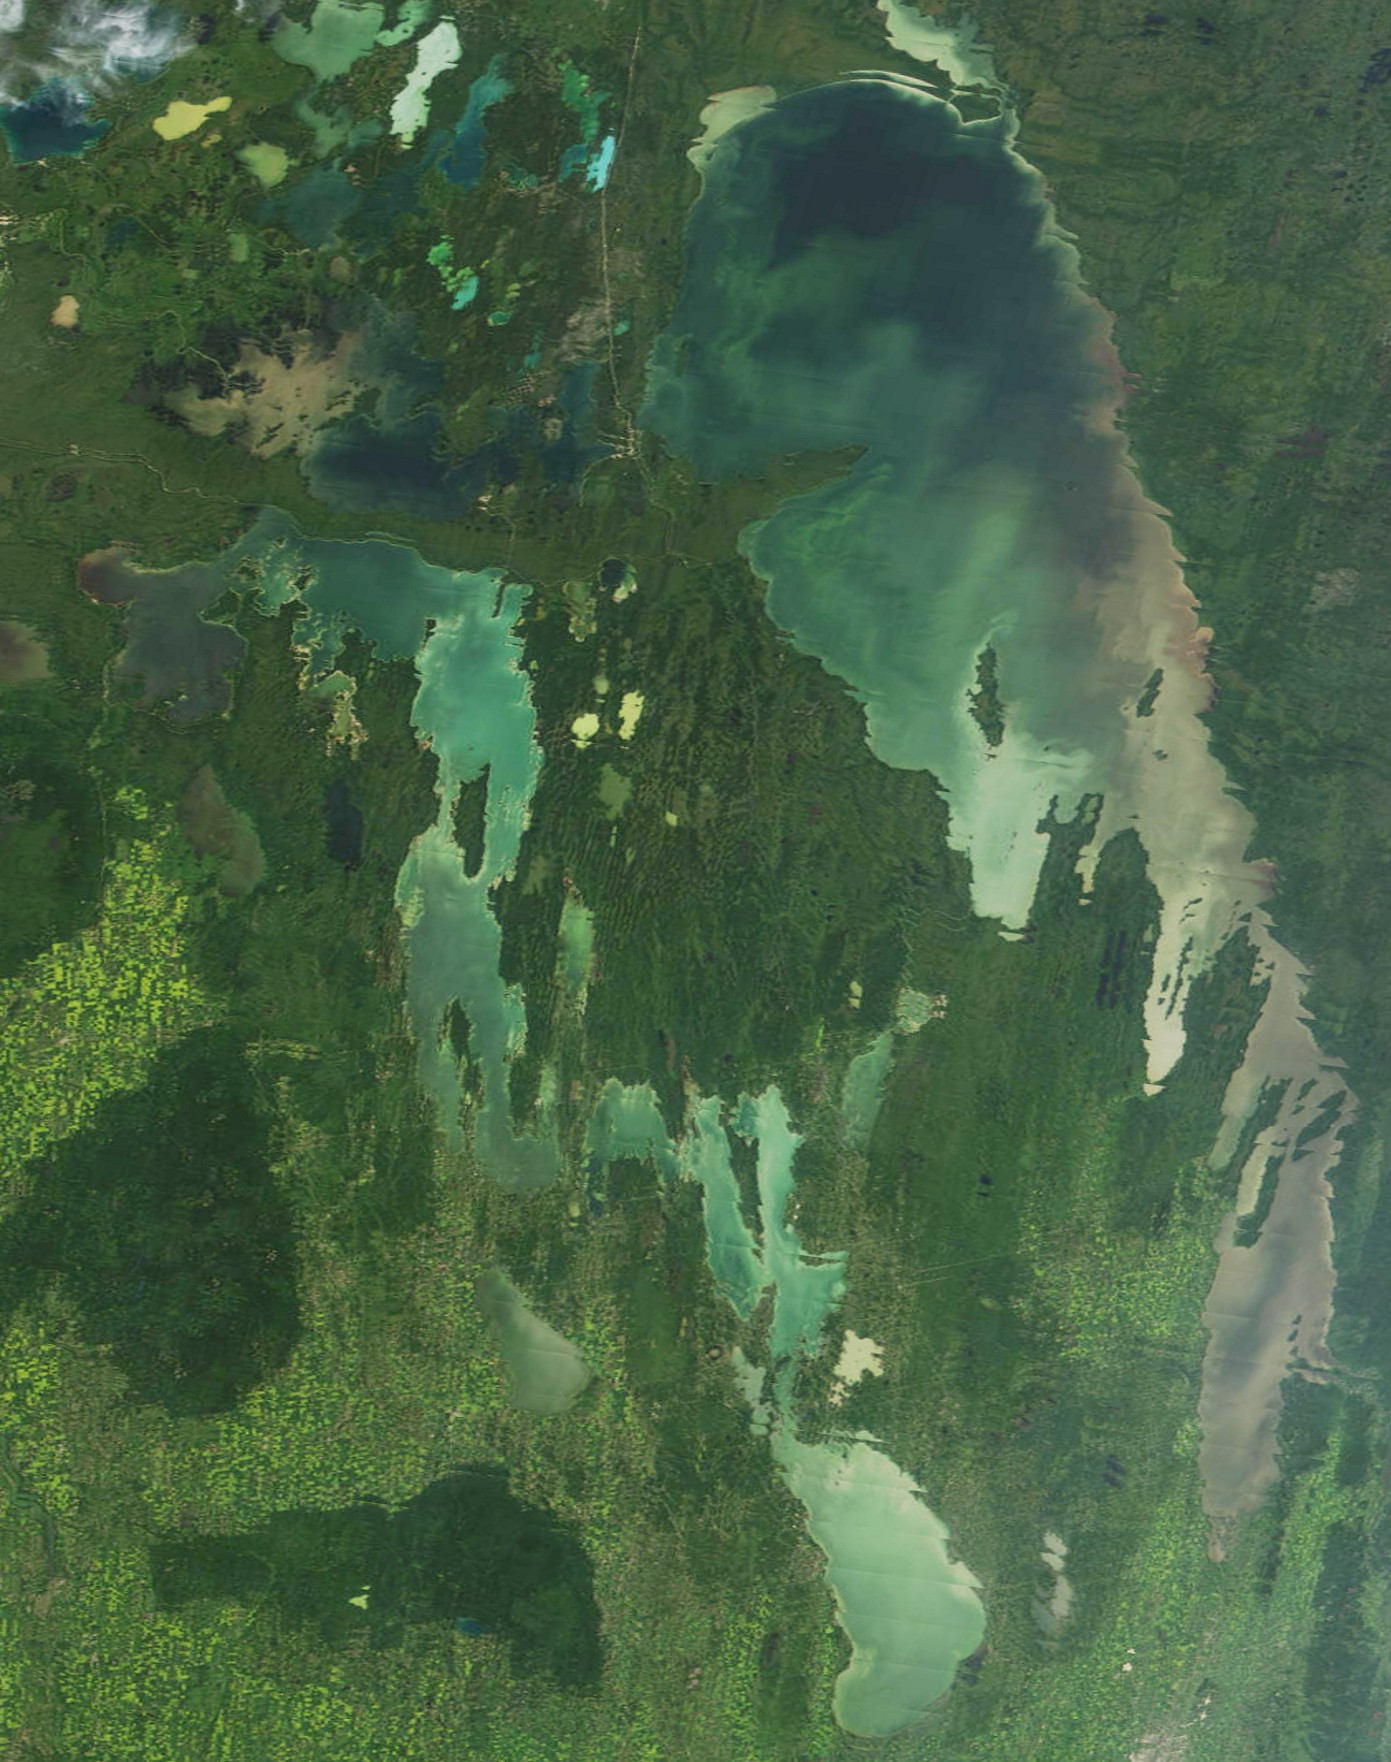
(You can see the area a little more clearly in two other images wo images, from August
of last year and
June
of this year). Its not as bright a gem as
Limestone, but still a beautiful robin's egg blue from space. And from its colour at various times, I think
that whitings occasionally colour Talbot Lake, the
larger lake to the east -- and probably also parts of the Moose Lakes, although I suppose their
colours to be a more complicated mix due as well to algae in the summer and
occasional sediment resuspension events.
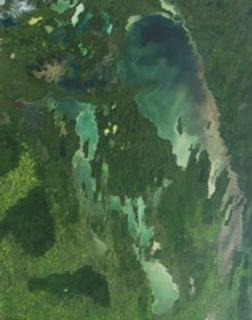
I have wondered at various times if the pale greens that I often see in
Lake Winnipegosis might be some combination of calcite and algae. Though they could simply be
different algal communities than we regularly see in
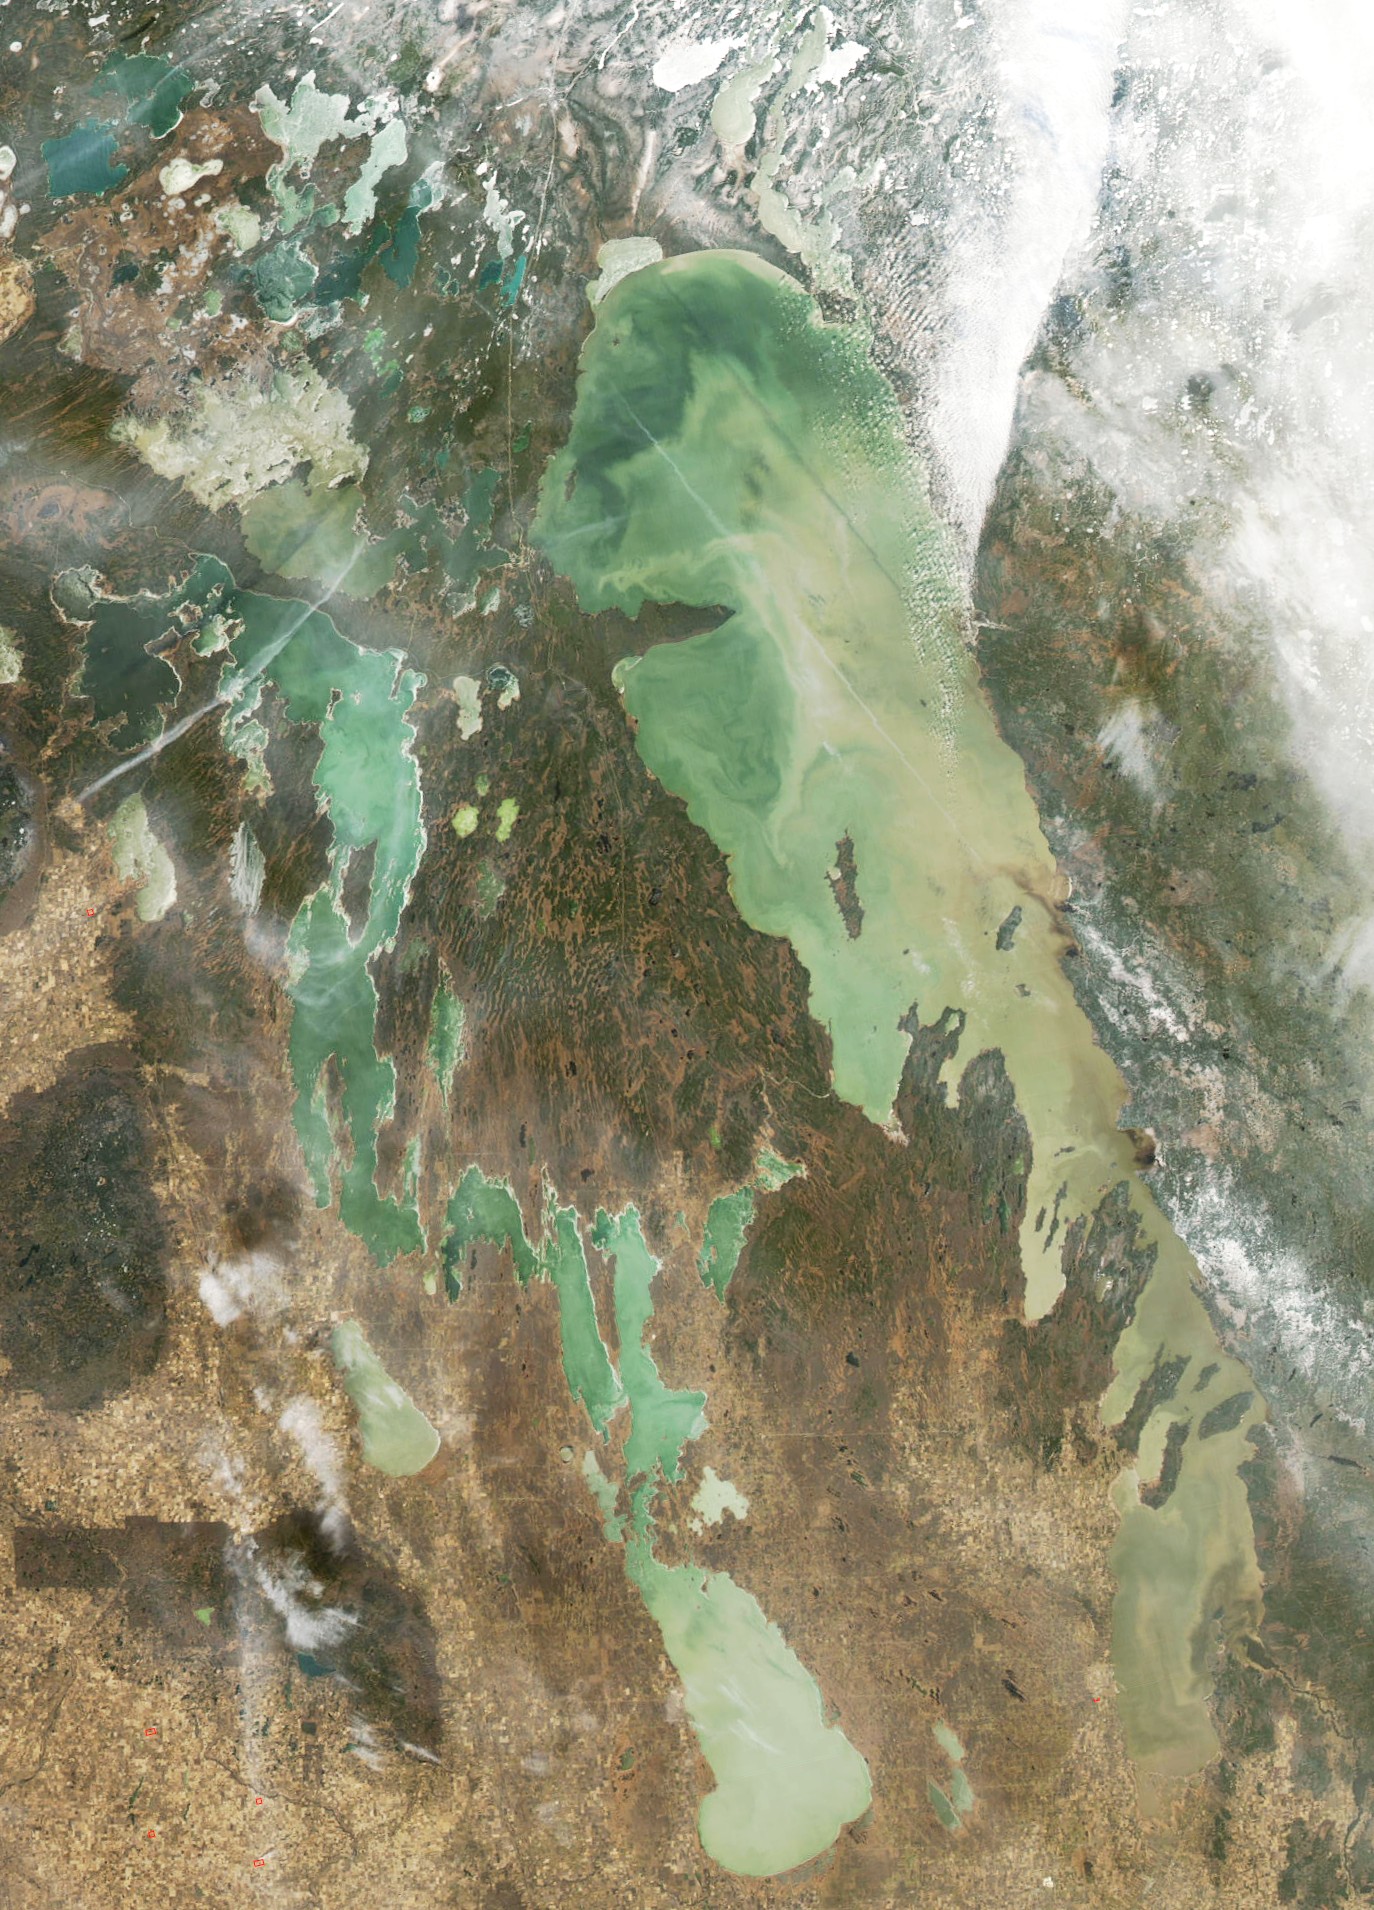
The
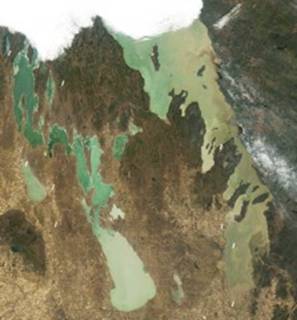
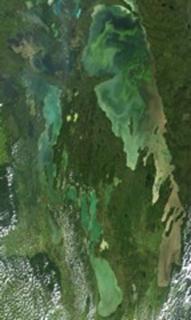
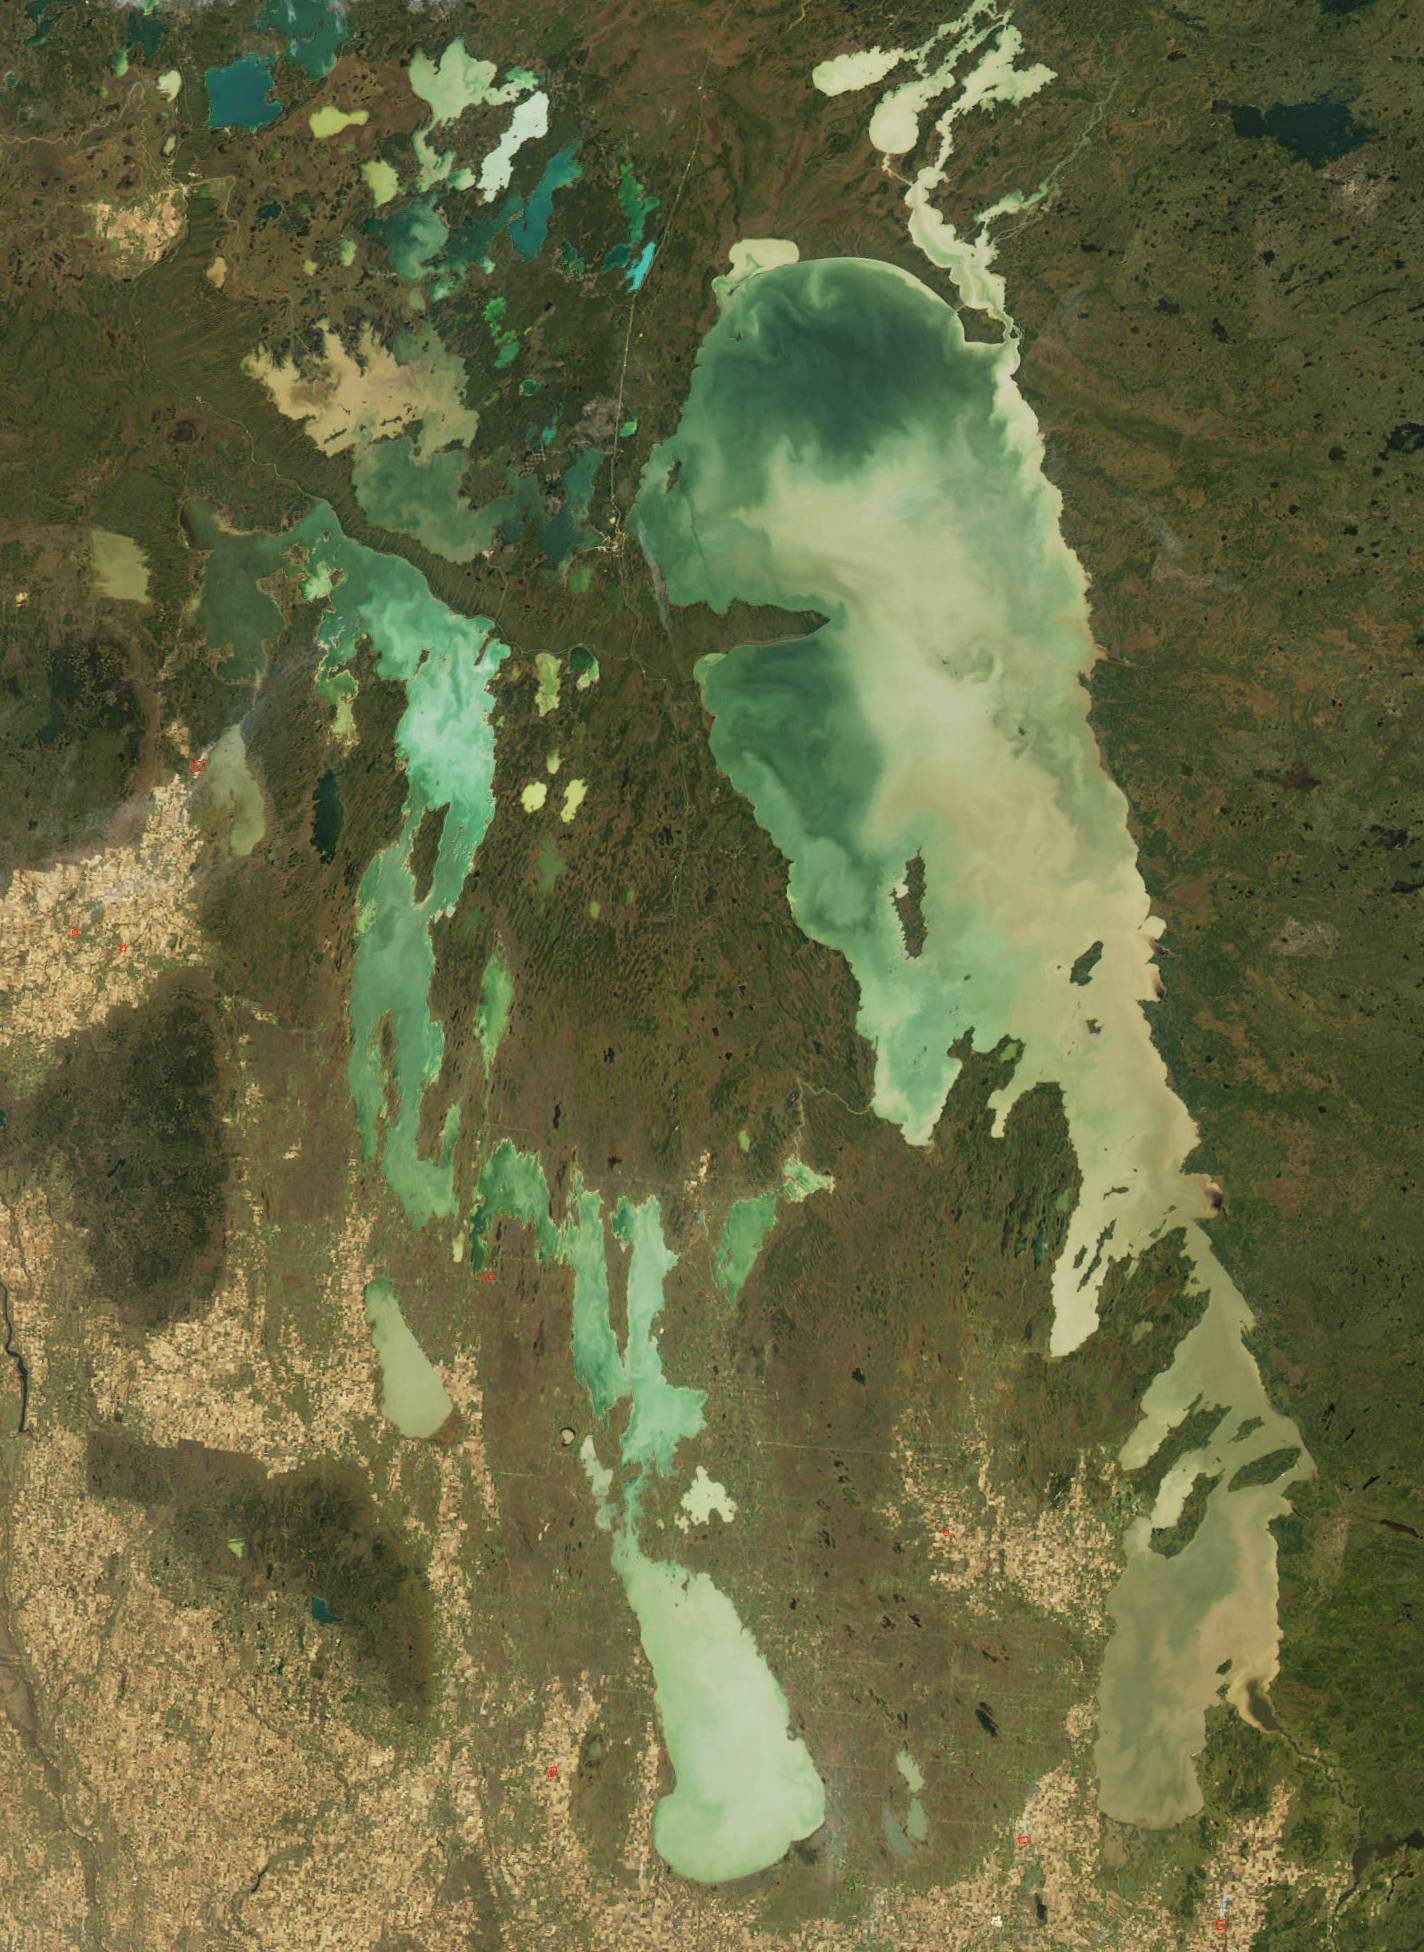
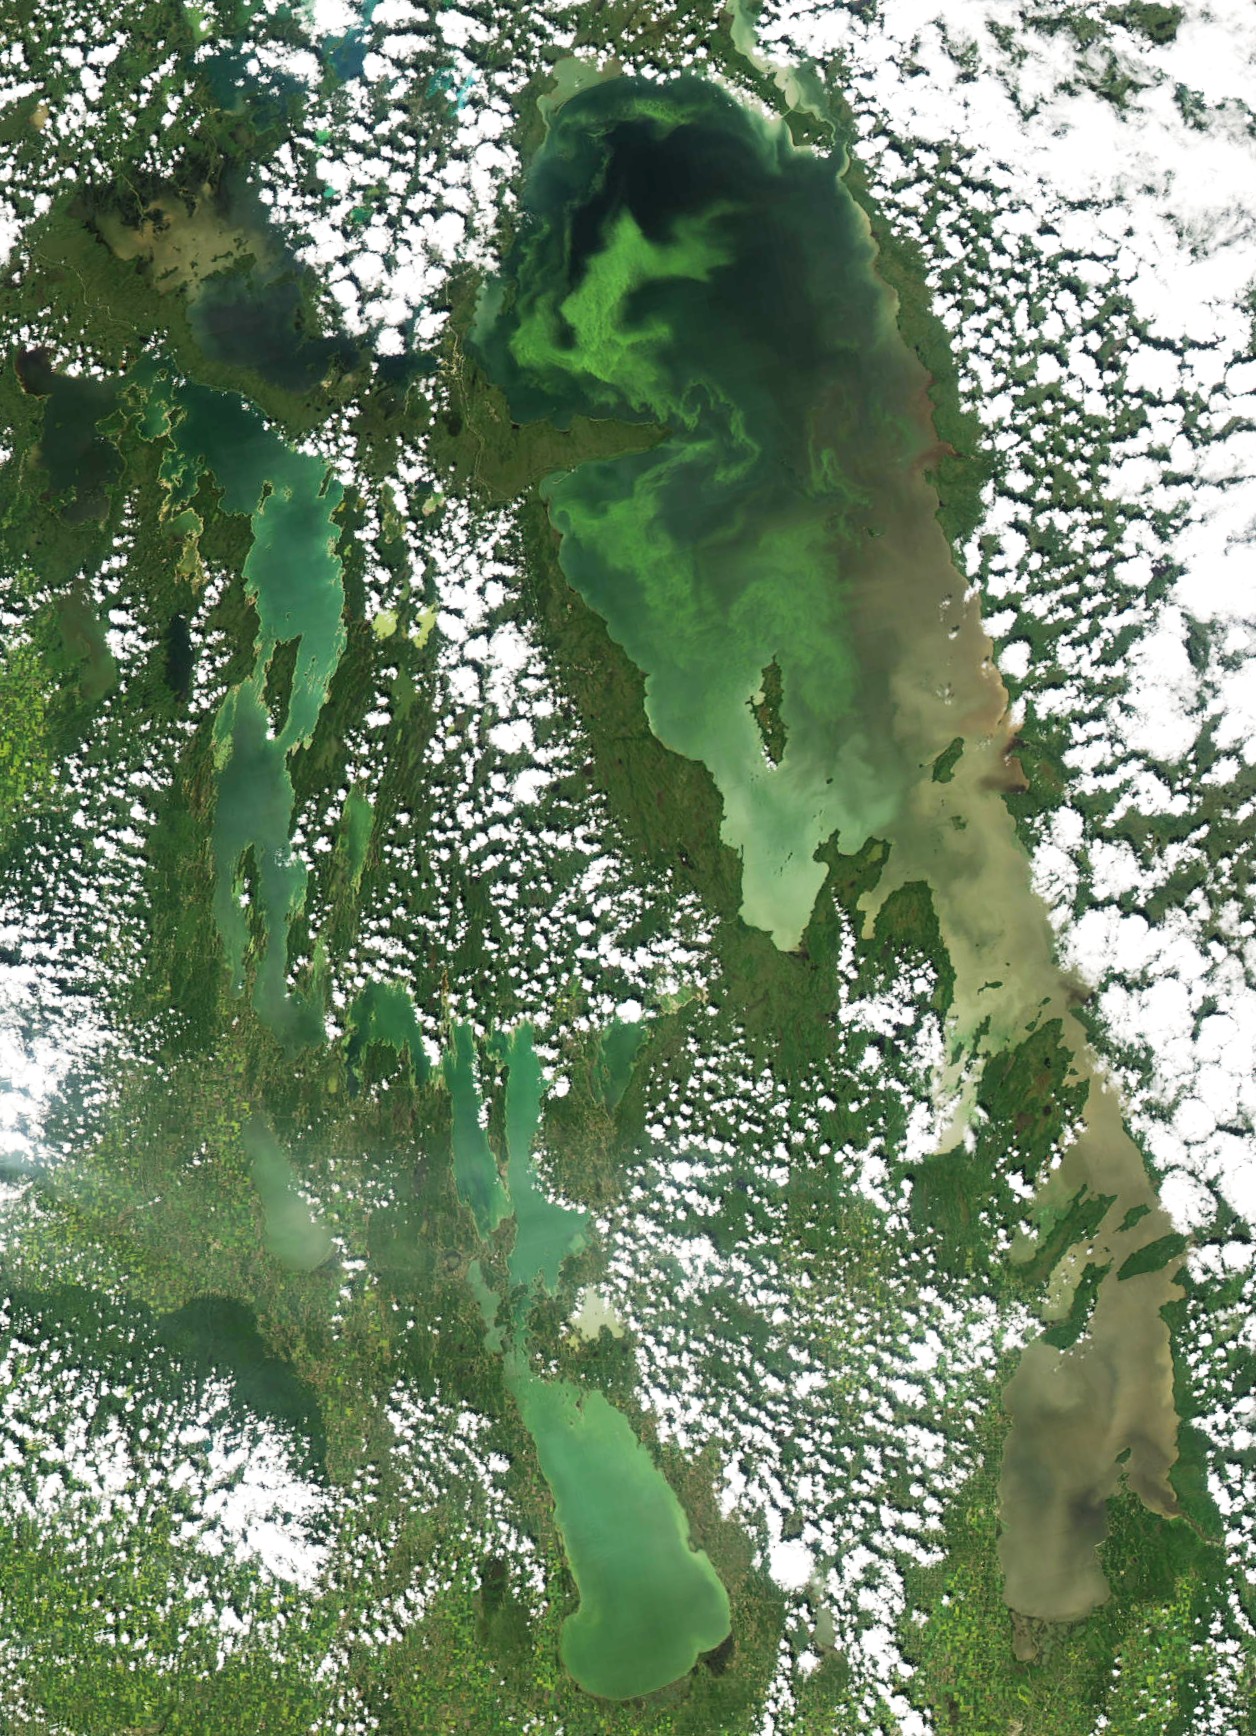
picture has changed since mid-August (below).
Where in early August the east side was all browns indicating either
turbid water or water rich in dissolved organic carbon from the Shield watersheds
(or very probably a mixture of the two), on the 31st of August along
the same shore there was a surface bloom of algae as much as 10 km wide from
the Narrows to somewhere near Poplar River, a distance of something like 150
km. You can see the antecedents of this
bloom from the Narrows up to Berens Island on the 13th of August,
but from Berens north at least to Georges Island there is no sign of it in the
earlier image. Unfortunately, clouds
prevent us seeing the fate of the large blooms in the northwestern
part of the basin – as they have prevented us from seeing much of the lake
through the whole last half of August.
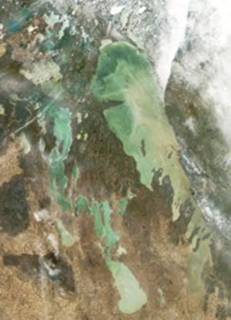
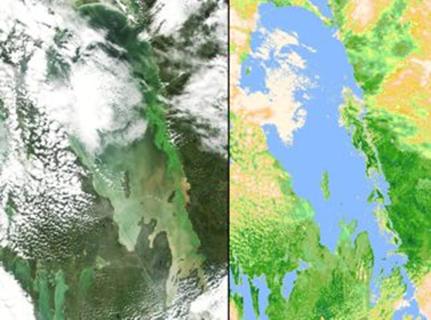
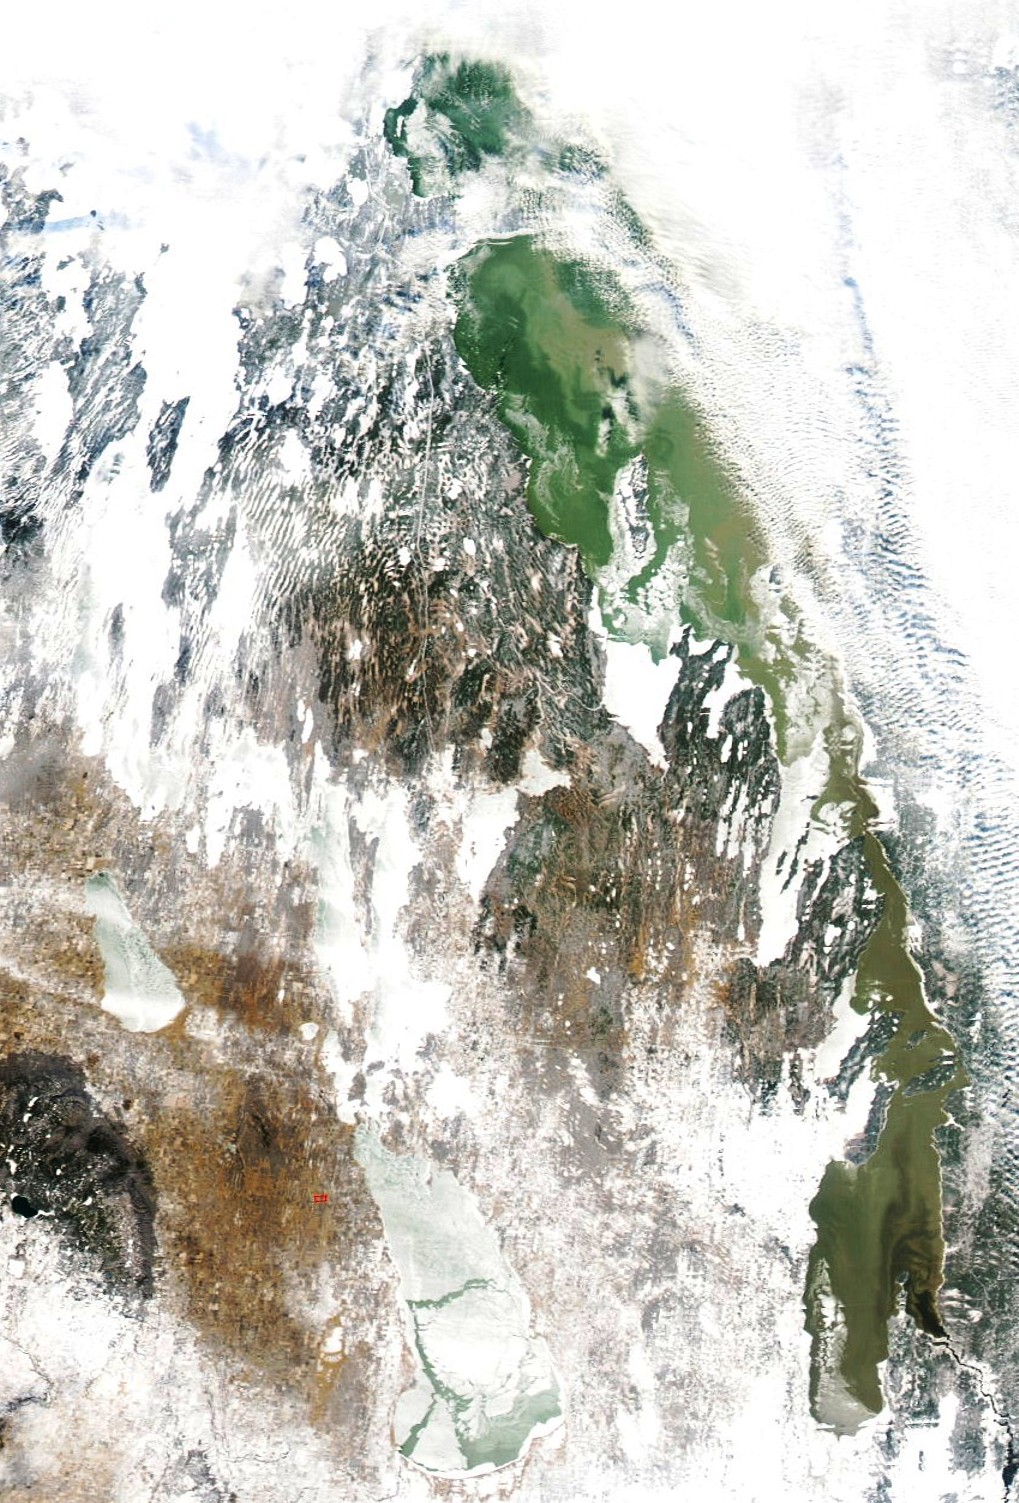
Again, I’ve included a vegetation index map on the left – with darkest
green denoting most dense and most vigorous vegetation. Much of the bloom in this rendition is
indistinguishably green from the forest just to the east of it. Its an indication
that a thick green matte of algae completely covered the water surface there,
on that day.
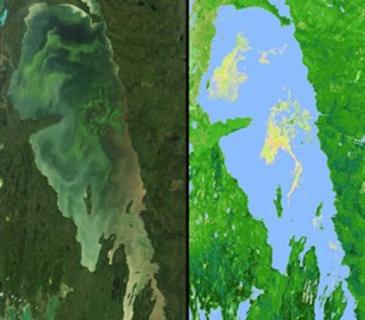
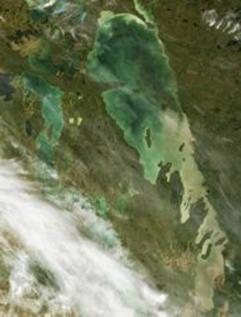
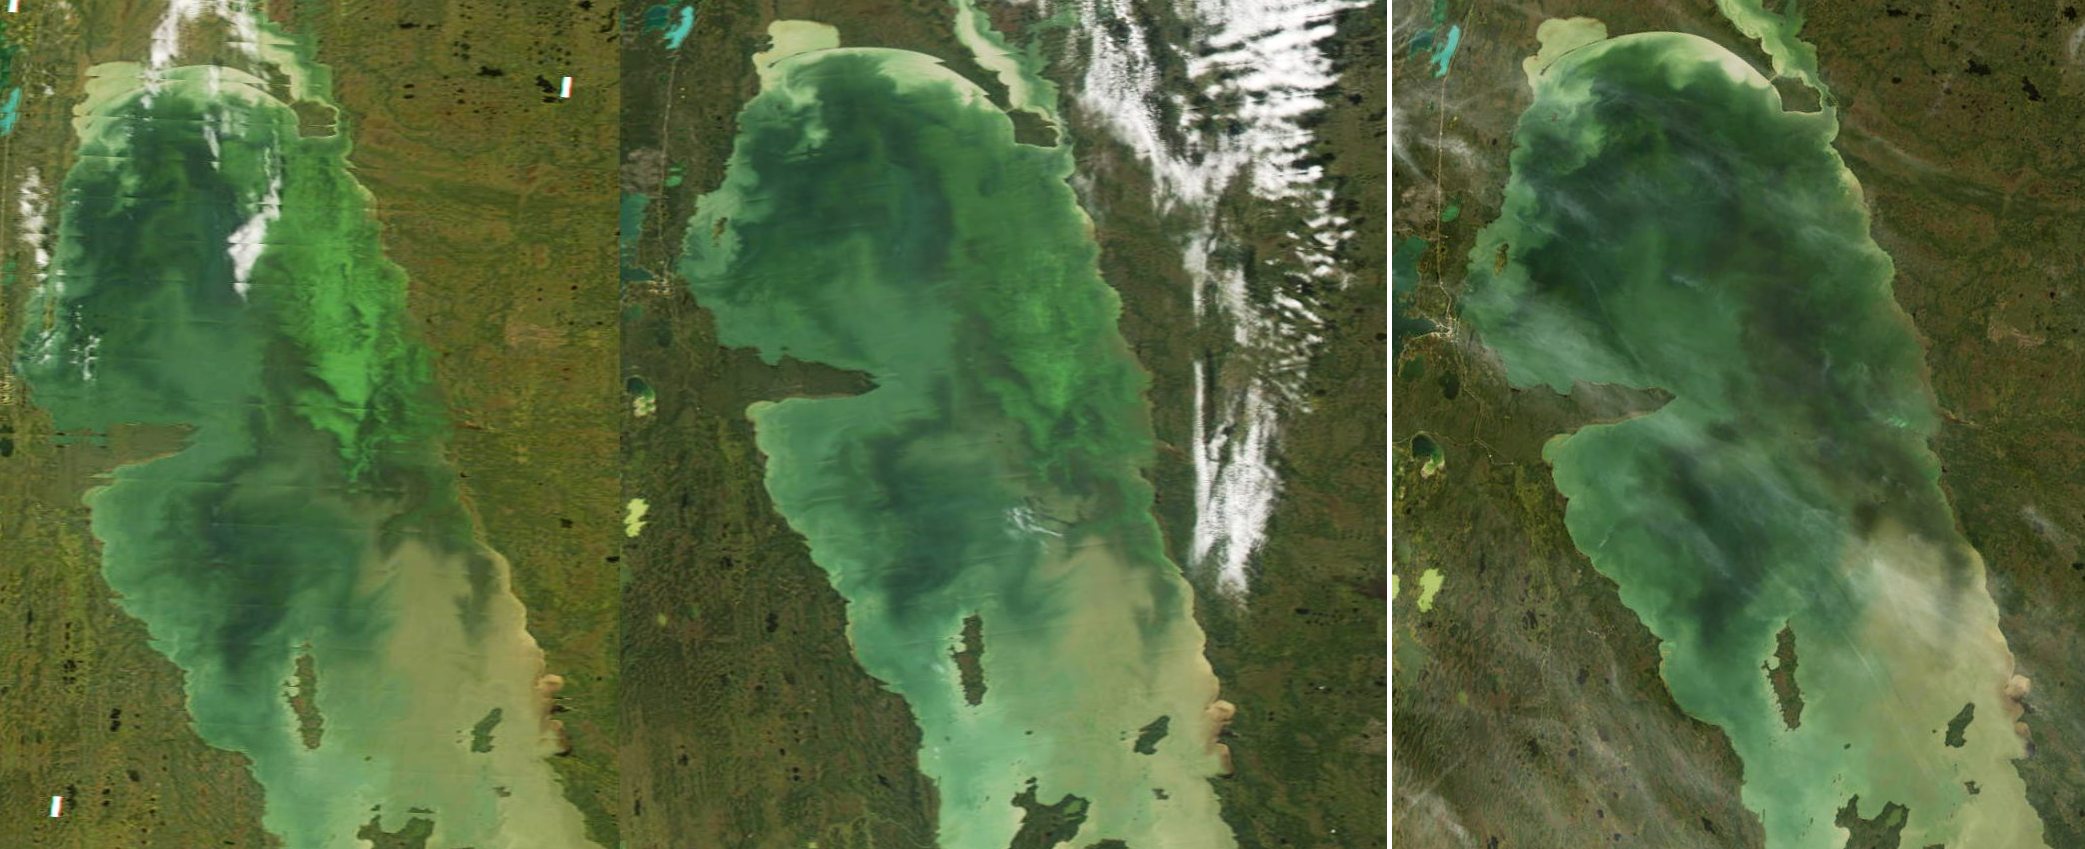
An
image recorded Friday the 13th, when the Namao was probably near
Georges Island doing fish trawls. The map on the right shows a
vegetation index prepared by mapping the ratio of infrared light to red
light. Chlorophyll in healthy green
vegetation reflects infrared strongly, but absorbs red for photosynthesis. The vegetation index map shows increasing chlorophyll
response in the colours brown (low) through yellow through increasingly dark
green. The patches of these colours in
Lake Winnipeg are surface blooms of algae, and in some parts, they are almost
as green as some of the terrestrial vegetation around the lake – a sign that in
those regions the algae is must be nearly carpeting the surface. Since water absorbs infrared light, for the
vegetation index to produce even the browns and yellows out in the lake, it
must be fairly dense on or near the surface.
I expect that the Namao passed through one or both of the two blooms last
week. We’ll know soon – they’re due back
in Gimli tuesday.
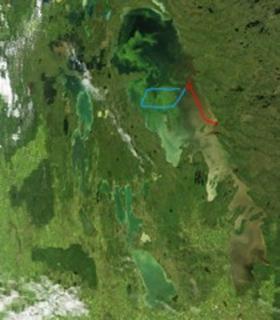
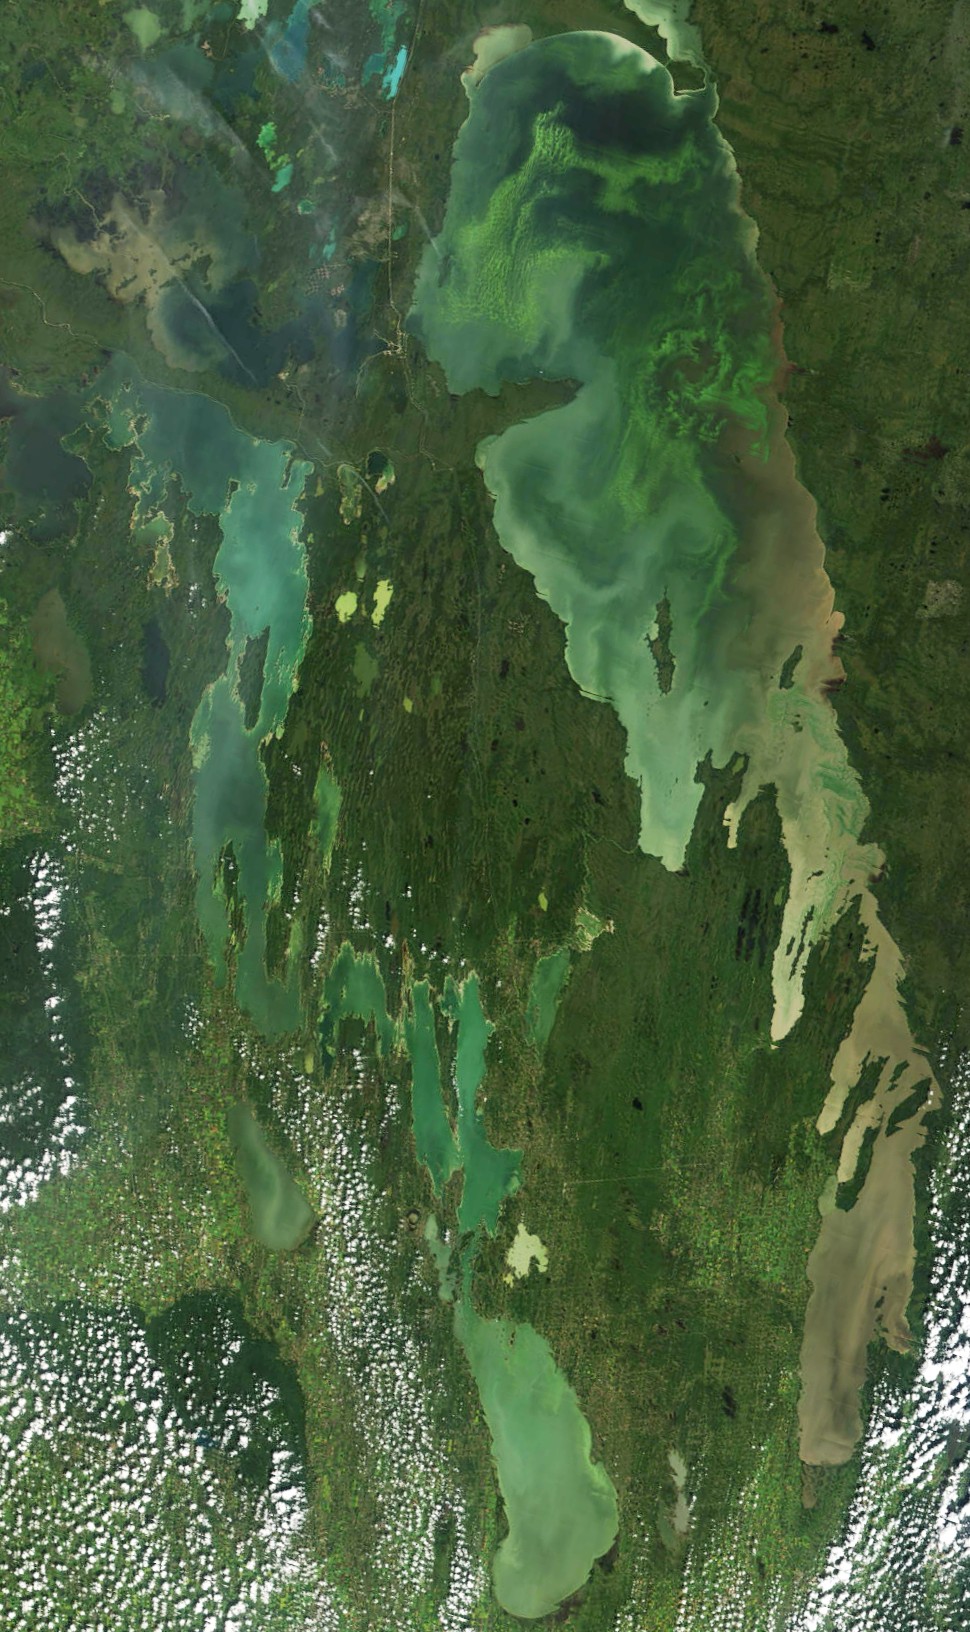
The
bright yellow-greens signalling algal blooms are if anything a little more
widespread in today’s image than a couple of days ago, at least in the region
between Reindeer Island and Long Point.
Mike Stainton (by satellite telephone this evening) tells me that the
Namao sampled from Berens River to George’s Island today – along the track
marked in red. (They set out yesterday,
but had to return to Berens to get one of the science crew to the nursing
station. Happily, he is well again,
today.) Today’s cruise will have taken
them through mostly the brownish water along the west side of the lake. In fact, near Berens Island today, they did
not encounter the dense algal blooms that we have seen there several times in
recent years, though they did pass through a small bloom day before
yesterday. You can see it on this image
– small swirls of green just a few kilometres north of the Narrows. Tomorrow, their intention is to sample two
transects across the centre of the North Basin – the blue circuit. That’s
“weather permitting”. Mike tells me that
there’s a strong wind from the south rolling waves into the harbour mouth at
George’s tonight. Anyway, when they do
set out, their planned path will carry them across a huge
algal bloom that look as dense as any we saw last year.

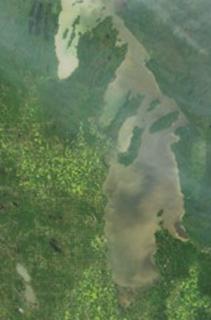
If
they are on schedule the crew of the Namao should have left Matheson Island
this morning to arrive in Berens River this evening. That would take them through the tan-coloured
region along the route marked in red above.
That’s an area of fairly turbid water – turbid partly because it’s South
Basin water carried north through the channel and partly because the region is
shallow, at least compared to the basin north of Berens Island (generally only
10-12 m deep compared to mostly 16-18 m deep in the open North Basin) so that
bottom sediments may be brought into suspension whenever there are strong north
winds. It will be interesting to see the
water chemistry data from the mouth of the Berens River. The dark browns along the east shore have
been much more intense this year compared to last – that fits with the
relatively high runoff that I think has been coming off the shield. Like many of the Shield rivers
tributary to
11:35 25 July 2004 13:20 26 July 2004
Two
images recorded while we were sampling on the first few days of the summer
cruise. There’s a lot of variation in the colour of the


A press conference on board the Namao. On the left:
Manitoba Minister of Water Stewardship, Steve Ashton, announcing $140000
support that will help pay the costs of keeping the Namao operating on Lake
Winnipeg through this summer. Equally
welcome was his announcement of additional resources for the riparian tax
credit program, which supports the elimination of tillage and the limitation of
grazing by livestock on lands adjacent to rivers and streams. The riparian tax credit now applies to land
by lakes as well as streams. On the
right: Claire and Keith identifying fish from a surface trawl – one of the many
things they’ll be doing about 60 more times over the next month, only without
the audience.


Pictures
from the first days of the summer cruise.
The first three show some of the sampling that we do at stations. 1.
Alex taking a water sample at one of our
stations, for determination of the plankton concentration in the surface water
of
11:30 18 July 2004 13:35 23 July 2004
Its been a cloudy summer over
For
those who can get out there, the ship will be docked for an Open House (Open
Ship?) – everyone welcome to come, look and ask questions -- at Victoria Beach
on Saturday the 31st of July and at Gimli on Sunday the 1st
of August. Further afield
(weather allowing) there are tentative Open Houses at Berens River on the 4th,
at Grand Rapids on the 11th and at Matheson Island 16th
of August.
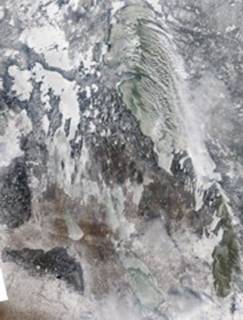
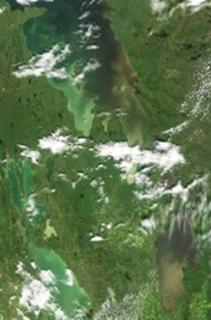
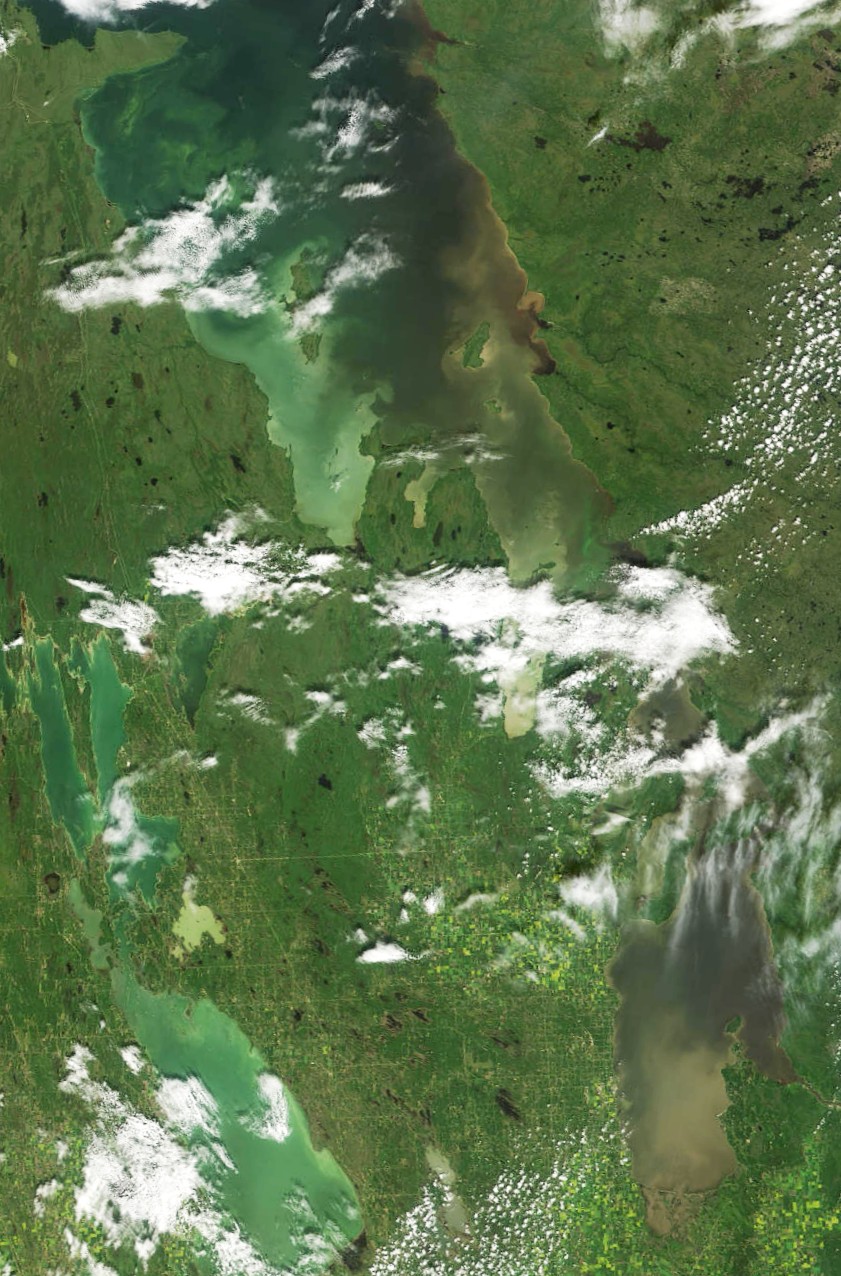
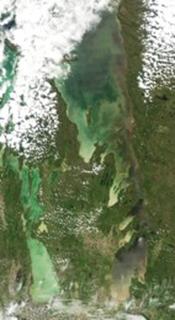
The
lakes are for the most part clear of opaque clouds; however, there is a soft
haze over most of the scene – either thin haze or possibly smoke from the
west. Reports back from the spring
cruise of the Namao indicate that diatoms still dominate the phytoplankton
community. Due to the cold spring, they
may well persist longer and delay any blue-green bloom to later in the summer
than last year. Clouds permitting, we’ll
be able to watch. The northern half of
the South Basin, the Narrows region and much of the east shore are much less
turbid than at the same time last year (see, e.g. 3 July
2003) when at least the South Basin and Narrows were more homogeneously
brown in these MODIS images. Turbid
brown water at the south end persists as a result of the high May and June
flows from the Red River. The darker
regions this year are probably waters much diluted by the high runoff from the
shield drainages to the east. Certainly,
you can see a dilute plume of Winnipeg River water passing through more turbid
water along either shore of Traverse Bay.
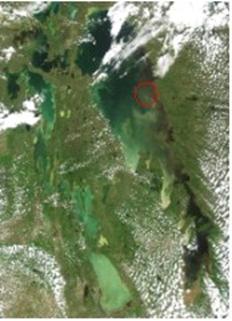

11:30 16 June 2004 The Namao is conducting fish trawls, along with
routine plankton, benthos, water quality and optical sampling, today near
Georges Island (circled in red on the thumbnail above). That’s Stephen, Claire and Kevin hauling in
the trawl net, with Namao crew member George in the background, a few days
ago. I was just talking with Christina
by satphone from the ship this morning, who confirmed
what you can see in the image above – it’s a beautiful, clear day, and for once
near calm. (There’ve been a lot of wet,
windy and rough days so far.) A day like
today is what was needed to collect data on turbidity and chlorophyll
concentration in order to improve our estimates of both from satellite images
like these. The ship spent the last few
days sampling at stations in the basin north of Long Point, and will be
returning south tomorrow, overnighting at Berens
River, Matheson Island and Gull Harbour, and finally back in Gimli sunday, all going well.
By the way, the crew have completed installation of all three weather
buoys on this trip. You can access real
time air temperature, pressure and wind data from the buoys at http://weatheroffice.ec.gc.ca/marine/region_06_e.html.
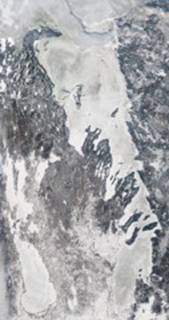
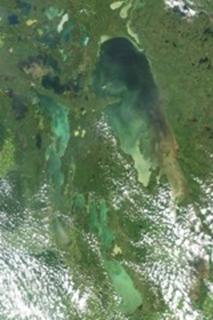
In
both the image above and the one on the 9th below, the muddy brown
colour at the south end and in the Netley marshes is exactly what it looks like
– muddy brown water from the Red River, which has been flowing high since the
heavy rains of a week and a bit ago. And
the pattern of dark water along the west shore of the North Basin looks a lot the
same as last year at this time (10 June 2003)
– this year we should get some well-positioned samples in that region to better
understand the water quality (or plankton) differences underlying those colour
patterns.
13:10 9 June and 12:05
10 June 2004 (North Basin only)
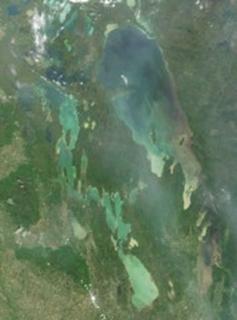
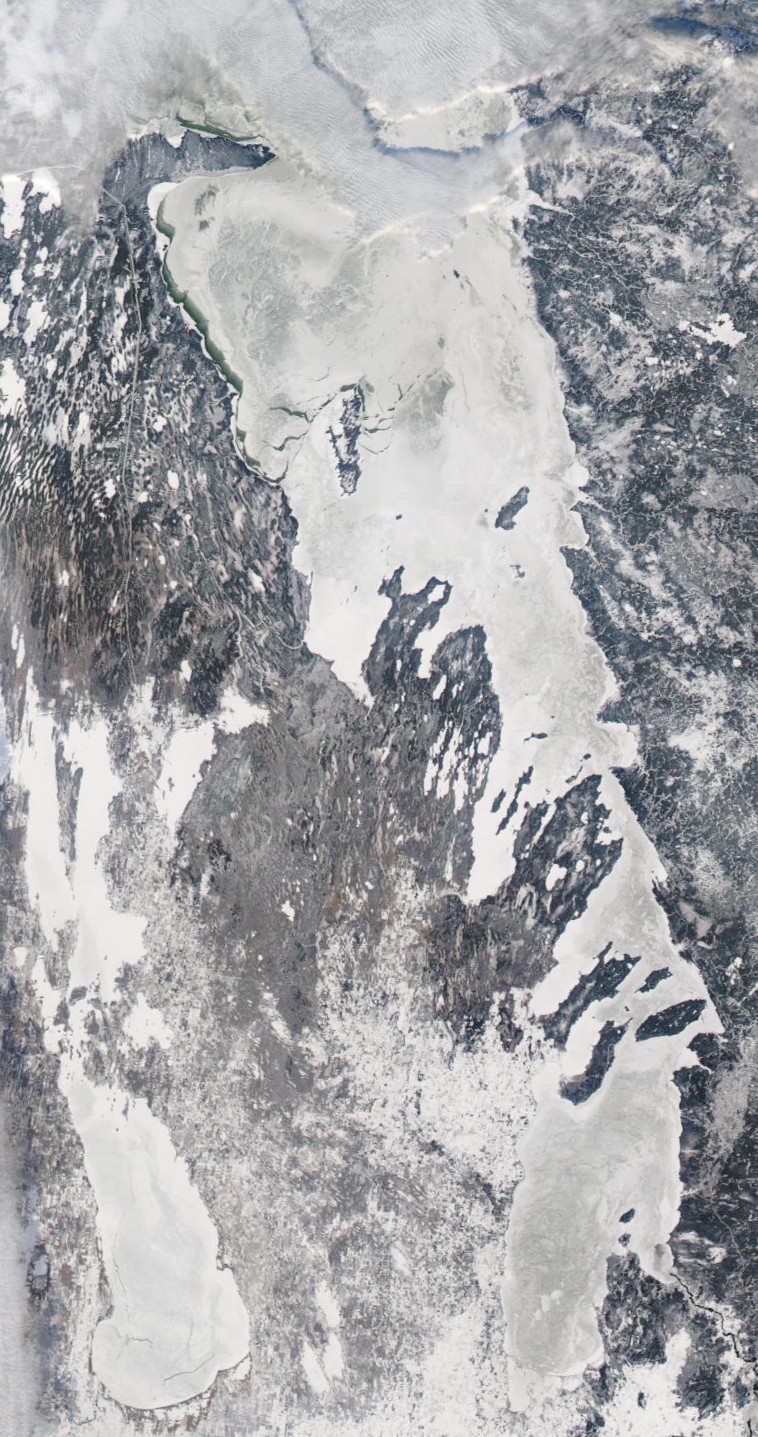
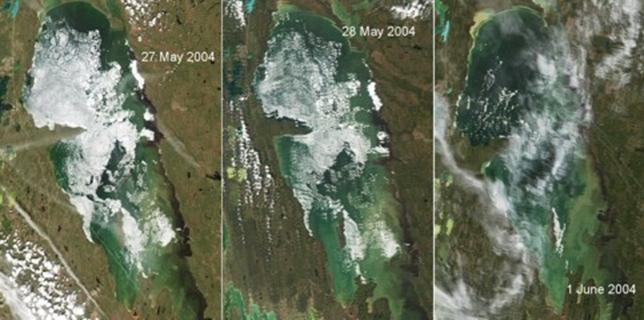
Most of the
west side of the North Basin had opened up by the 27th. Although the ice covered much the same area
on the 27th and 28th, you can see that it was much more broken up into
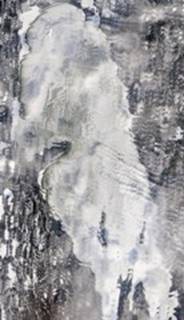
separated pans on the 28th. By today,
the 1st of June, there appears to be very little ice except north of
Long Point, and a big sheet attached to the east shore of Reindeer Island. Not a very good quality image, but I thought
the crew of the Namao might like to know that its
pretty well ready for them up there.
They’ll be leaving for the north end in a couple of days.
Though I am
studying the geography of plankton on