Fluorescence
of a Leaf Pigment Extract
The photosynthetic pigments located within the thylakoid membranes of the chloroplast absorb light energy which is passed on to reaction centre molecules in photosystem I (P700) and photosystem II (P680). This excitation of electrons raises the electrons to a higher energy level. Within the thylakoid membrane the primary electron acceptor is reduced by the high energy electrons. When the primary electron acceptors are not available, as is the case with a pigment extract, the energy is released as a longer wavelength photon (lower energy) and heat. This lower wavelength photon is the light of fluorescence.
Measuring the Production of O2 Gas during photosynthesis.
In this exercise we will be looking at the actions of the light reaction in the chloroplast. One of the key products of the light reaction is O2. By measuring how much O2 is produced we can measure the rate that the light reaction is taking place. Keep in mind that we will only be measuring net O2 production as the plants used are also caring out cellular respiration at the same time and using up O2 gas. We will be using the same basic apparatus as in lab 4 when we measured respiration rates in flour beetle larva as well as seeds. Working with one side of your bench you will, as a group, set up the experiment as follows:
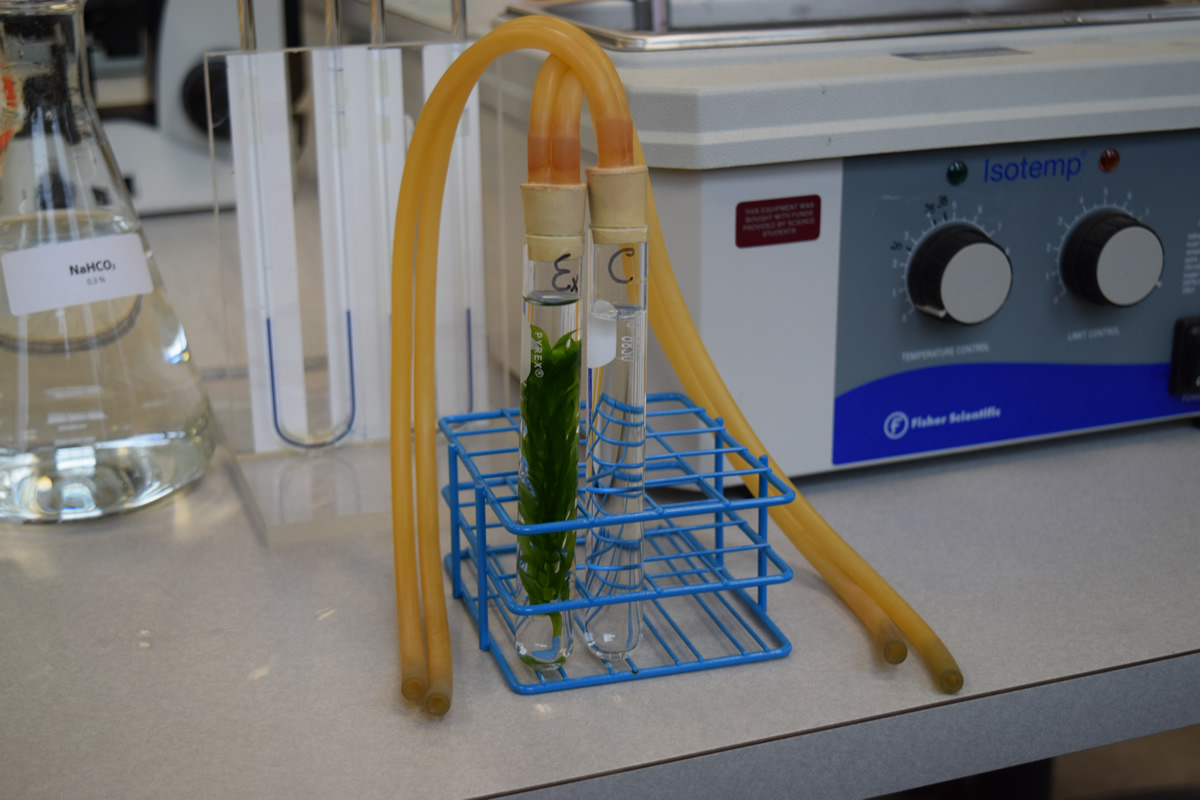
1) Select a pre cut sprig of Elodea from the finger bowl and weight it on the scale on the side bench. You will need about 1g-2g of Elodea.
2) Place the Elodea into one of the test tubes at your bench. Fill the test tube ¾ full with the Bicarbonate – Carbonate solution provided. Ensure that the Elodea is covered.
3) Fill a second test tube with just Bicarbonate – Carbonate solution to the same level.
The Bicarbonate – Carbonate solution is a buffer and will act as a CO2 source while keeping the CO2 concentration constant in the test tube. The volume change inside the experimental tubes will, therefore, be only due to the increase in O2 as released by the plant during photosynthesis. Other changes in the volume will be due to temperature and accounted for by changes in the control (no Elodea) tube.
4) Place both test tubes into the test tube rack in the 20OC water bath at the end bench. Place the tubes on the opposite side as the light and ensure both tubes are the same distance from the light source.
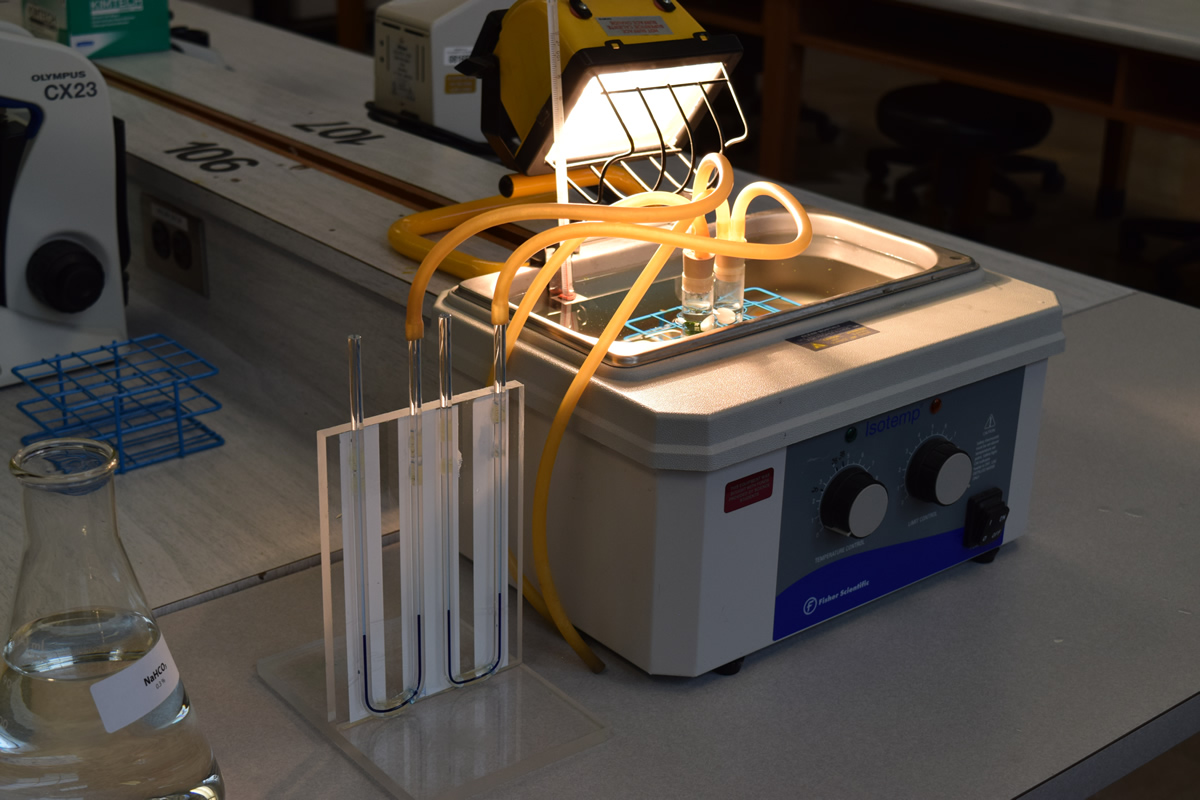
5) Turn on the halogen lights on the bench and direct the light towards the water bath.
Caution: The casing of the lights becomes very hot. Only touch the lights by using the handle areas and never the yellow housing.
6) Place a two holed stopper with attached rubber hoses in each of the tubes.
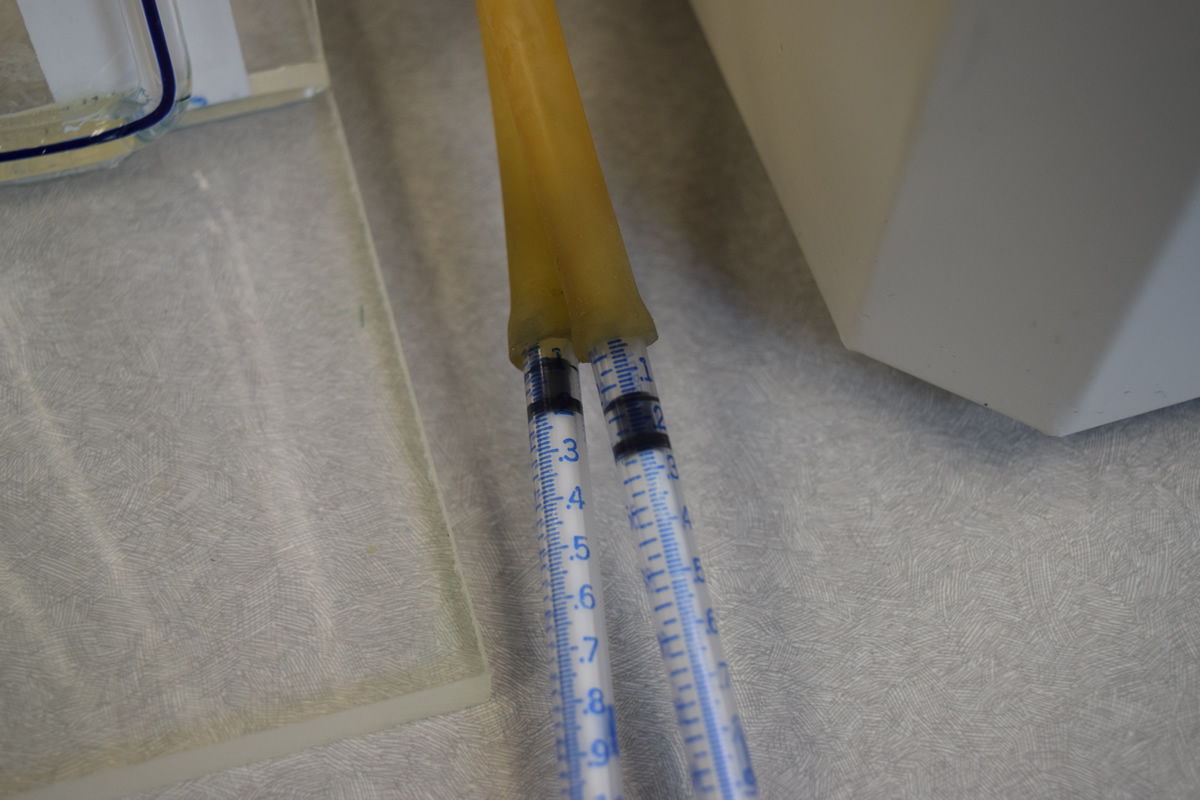
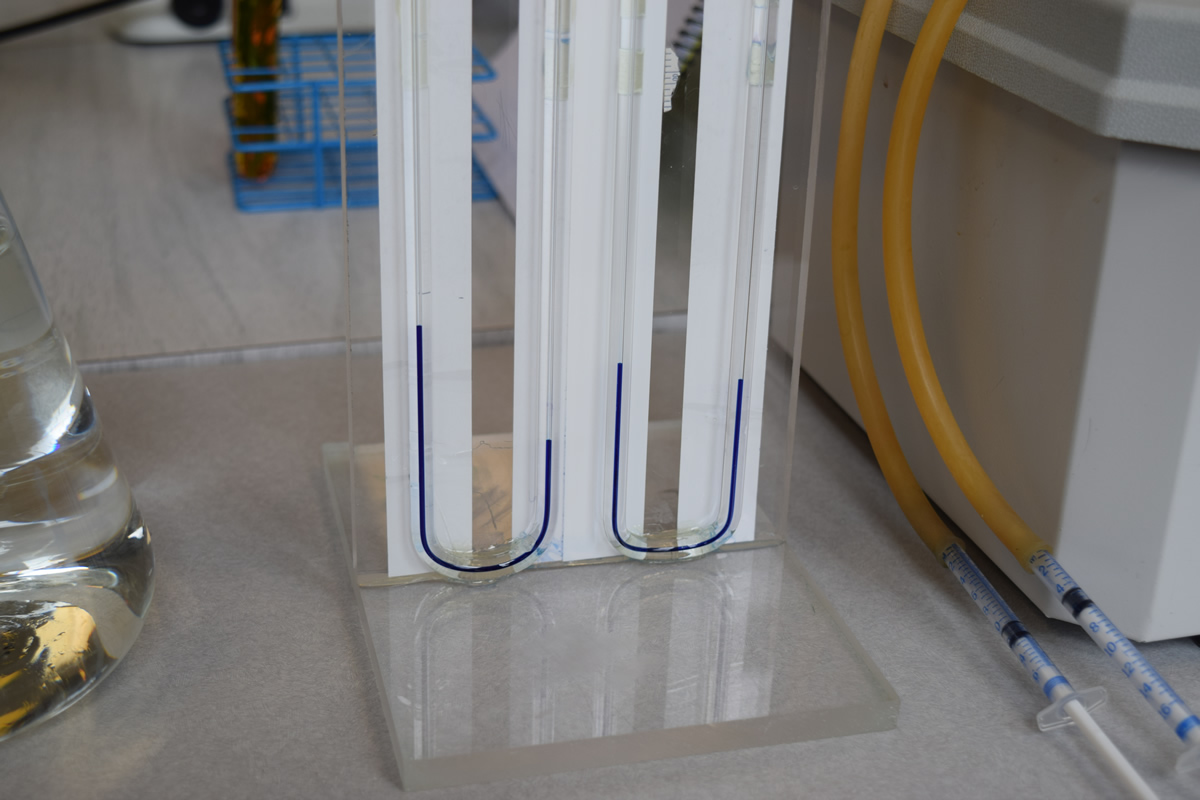
7) A rubber tube should run from the short piece of glass rod in one hole of the stopper to the U-tube. A second length of rubber tube should lead from the other hole to a 1 cc syringe. Do not attach the syringe at this time.
8) Take one of the 1 cc syringes provided and withdraw the plunger to about 0.1. Attach the syringe to the end of the syringe tube. You must insure that all junctions provide an airtight seal or the experiment will not work. Adjust the syringe plunger so that the colored solution in the U-tube is even in both arms. This insures that the solution is at a known start point. Record the syringe reading for the start of the experiment and the time at the start. As oxygen is produced the dye should move in the U-tube away from the test tube containing the plant. Periodically you should carefully adjust the dye back to the start position by withdrawing the syringe. This is a delicate operation and must be done with care. Continue this process until the plunger is nearly fully withdrawn or one hour has elapsed. Stop the experiment with the dye in the same position as it was at the start. Record the time that has elapsed and the final position of the syringe plunger.
9) Any displacement in the control tube should be added or subtracted from the experimental tubes.
- Why?
10) Calculate a photosynthesis rate in ml/gr/hr.
Assume 1.5 Grams of Elodea and 0.6 L of air and 1 Hr.
Fermentation
and Alcohol Production
As we discussed last lab (Lab 4) fermentation of glucose to ethyl alcohol is carried out by several organisms, including yeasts of the genus Saccharomyces. This process is important as the basis of the brewing and distilling industries. A summary of the reactions involved in the production of ethyl alcohol from glucose is shown in the following figure. We are going to examine the production of alcohol during fermentation by using the Iodoform Test for alcohol.
Note that in the overall process ATP is generated along with CO2 and ethyl alcohol. NAD+ is reduced during glycolysis but is reoxidized in the final step to ethyl alcohol, so there is no net gain of reduced NAD in the overall process.
A distillation apparatus may be used to concentrate the alcohol produced by fermentation of glucose by yeast. This is possible since water boils at 100°C while alcohol boils at 78°C. Four test tubes were prepared, each containing 2 ml of IKI, 3 ml of 1.5M NaOH, as well as one of the following:
Each solution was left to stand for 45 minutes. Ethanol, if present, reacts with iodine at high pH to form iodoform which settles out as a yellow precipitate.
Answer the following questions: