# Examine Strand Specificity of RNA-Seq Reads
You an estimate the level of strand-specificity of your RNA-Seq data by aligning the reads back to your Trinity assembly and examining the distribution of RNA-Seq read (or fragment) orientations on those assemblies. You can also readily detect whether you've assembled data as non-strand-specific but the reads are actually strand-specific. You can this like so:
First, align your reads back against your Trinity assembly. Bowtie2 works well for this:
- Paired end reads:
$TRINITY_HOME/util/misc/run_bowtie2.pl --target Trinity.fasta --left left.fq --right right.fq \
| samtools view -Sb - | samtools sort - -o bowtie2.coordSorted.bam
- Single end reads:
$TRINITY_HOME/util/misc/run_bowtie2.pl --target Trinity.fasta --left single-end.fq \
| samtools view -Sb - | samtools sort - -o bowtie2.coordSorted.bam
Then, examine the distribution of strand-specificity - looking at the distribution of orientations for the first read of paired-end fragment reads.
${TRINITY_HOME}/util/misc/examine_strand_specificity.pl bowtie2.coordSorted.bam
This will generate a data table and a pdf plot showing the distribution of the ratio computed for each contig:
(plus_strand - minus_strand) / total
based on the orientation of the first read of each RNA-Seq fragment.
Example data tables and corresponding plots are shown below for different data configurations, including strand-specific data, non-strand-specific data, and then the case where strand-specific data were assembled as non-strand-specific (oops!).
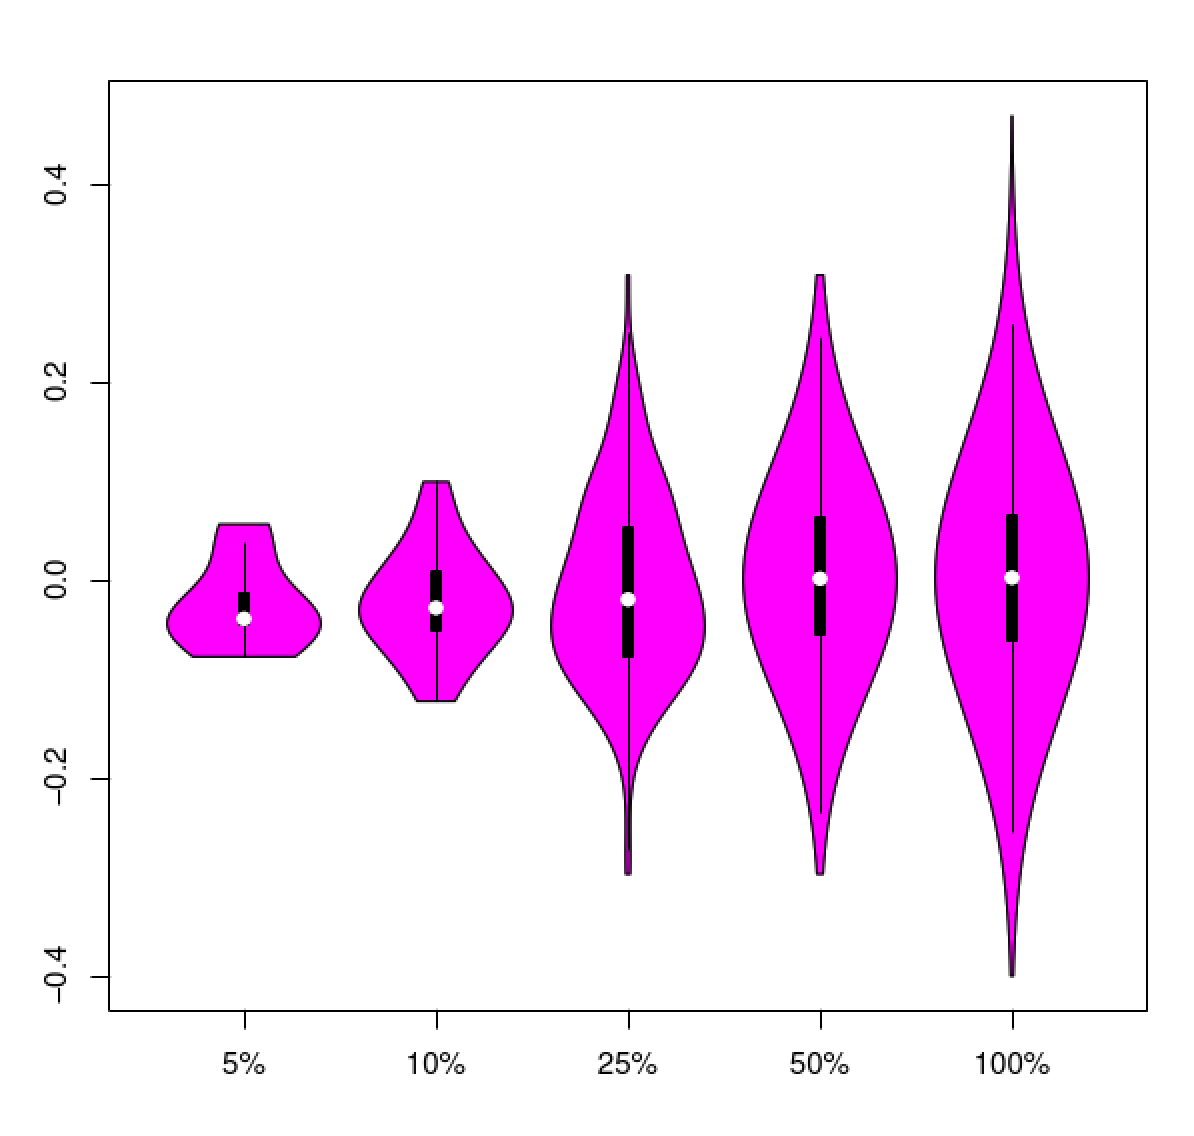
## Non-strand-specific RNA-Seq data
Example data table:
#transcript plus_strand_1stReads minus_strand_1stReads total_reads diff_ratio
TRINITY_DN4743_c2_g9_i2 67251 75742 142993 -0.059
TRINITY_DN3140_c0_g2_i1 30326 32768 63094 -0.039
TRINITY_DN4633_c1_g3_i1 28114 26549 54663 0.029
TRINITY_DN4382_c0_g1_i1 19946 20993 40939 -0.026
TRINITY_DN4566_c0_g2_i1 20232 18057 38289 0.057
TRINITY_DN1432_c0_g1_i1 16724 18159 34883 -0.041
TRINITY_DN4888_c0_g1_i1 15508 16726 32234 -0.038
TRINITY_DN4744_c5_g3_i1 14500 16904 31404 -0.077
TRINITY_DN4733_c6_g21_i1 15967 14721 30688 0.041
TRINITY_DN4736_c4_g9_i1 15188 15257 30445 -0.002
TRINITY_DN5011_c0_g1_i1 12907 13673 26580 -0.029
and the 'diff_ratio' values plotted according to top cumulative quantiles of total numbers of reads.
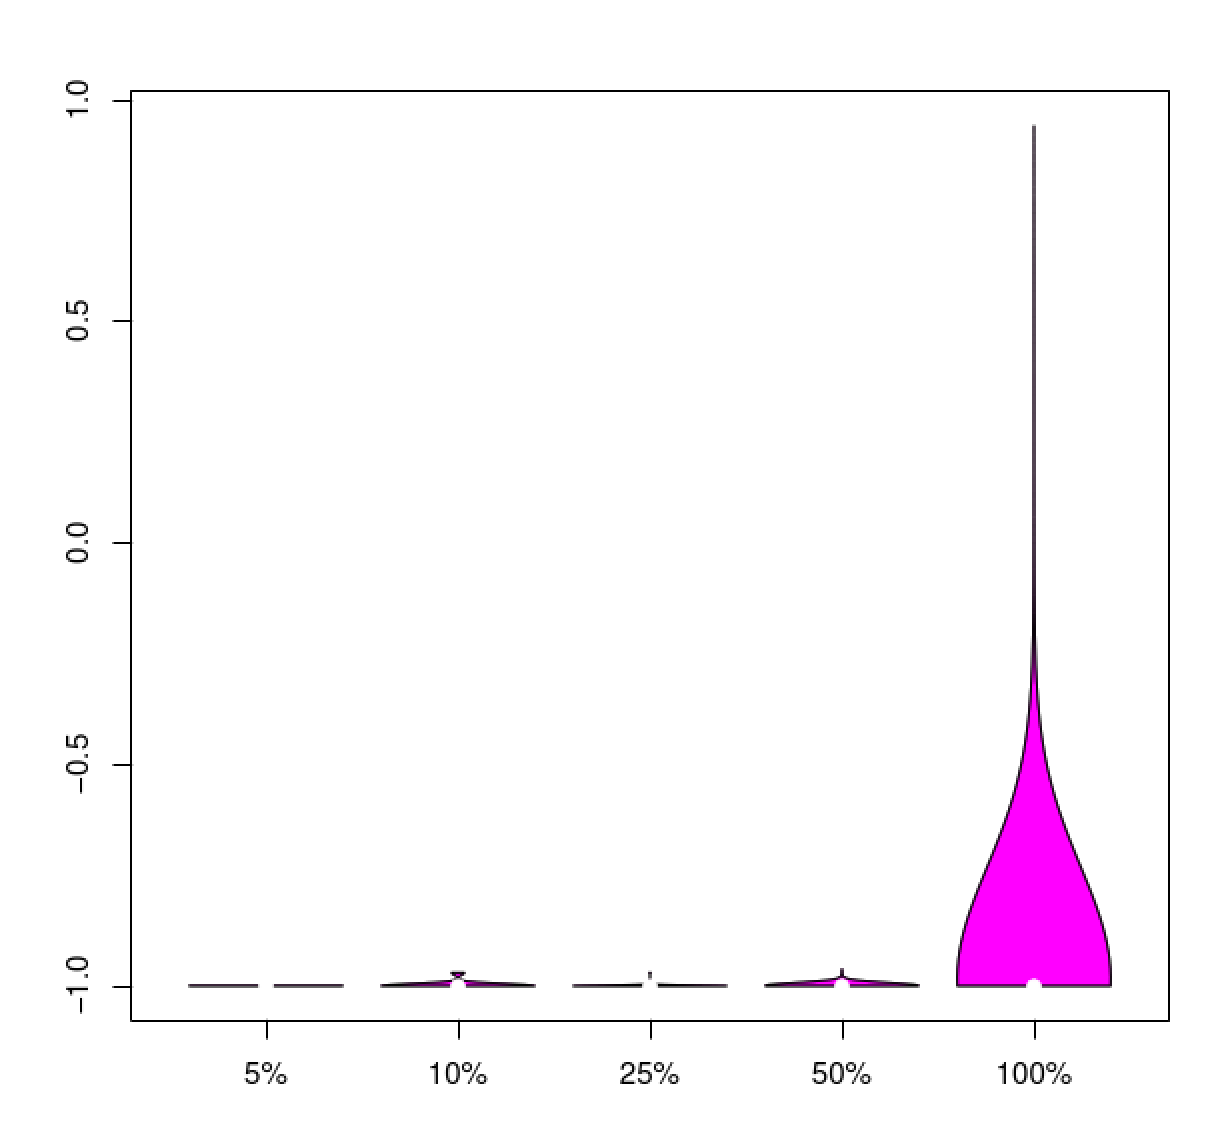
 ## Strand specificity (dUTP approach, --SS_lib_type RF)
Example data table:
#transcript plus_strand_1stReads minus_strand_1stReads total_reads diff_ratio
TRINITY_DN14418_c1_g5_i1 31 98783 98814 -0.999
TRINITY_DN13820_c0_g1_i1 30 80623 80653 -0.999
TRINITY_DN14453_c6_g4_i2 9 75834 75843 -1.000
TRINITY_DN14080_c15_g1_i1 6 68692 68698 -1.000
TRINITY_DN14331_c10_g3_i2 14 68234 68248 -1.000
TRINITY_DN14453_c6_g4_i1 14 62573 62587 -1.000
TRINITY_DN14138_c0_g1_i2 9 56515 56524 -1.000
TRINITY_DN14120_c1_g1_i1 3 51368 51371 -1.000
TRINITY_DN14020_c0_g1_i2 4 43347 43351 -1.000
TRINITY_DN14081_c1_g1_i1 27 41332 41359 -0.999
TRINITY_DN13058_c0_g1_i1 592 38763 39355 -0.970
## Strand specificity (dUTP approach, --SS_lib_type RF)
Example data table:
#transcript plus_strand_1stReads minus_strand_1stReads total_reads diff_ratio
TRINITY_DN14418_c1_g5_i1 31 98783 98814 -0.999
TRINITY_DN13820_c0_g1_i1 30 80623 80653 -0.999
TRINITY_DN14453_c6_g4_i2 9 75834 75843 -1.000
TRINITY_DN14080_c15_g1_i1 6 68692 68698 -1.000
TRINITY_DN14331_c10_g3_i2 14 68234 68248 -1.000
TRINITY_DN14453_c6_g4_i1 14 62573 62587 -1.000
TRINITY_DN14138_c0_g1_i2 9 56515 56524 -1.000
TRINITY_DN14120_c1_g1_i1 3 51368 51371 -1.000
TRINITY_DN14020_c0_g1_i2 4 43347 43351 -1.000
TRINITY_DN14081_c1_g1_i1 27 41332 41359 -0.999
TRINITY_DN13058_c0_g1_i1 592 38763 39355 -0.970
 ## Strand-specific RNA-Seq, but assembled as non-strand-specific
#transcript plus_strand_1stReads minus_strand_1stReads total_reads diff_ratio
TRINITY_DN13653_c2_g1_i1 93806 22 93828 1.000
TRINITY_DN13640_c9_g3_i3 69431 14 69445 1.000
TRINITY_DN13631_c3_g1_i1 66033 11 66044 1.000
TRINITY_DN13652_c2_g2_i2 60368 7 60375 1.000
TRINITY_DN13315_c9_g1_i1 6 50921 50927 -1.000
TRINITY_DN13637_c7_g1_i1 46489 4 46493 1.000
TRINITY_DN13631_c3_g1_i2 42728 6 42734 1.000
TRINITY_DN13560_c7_g6_i1 8 41954 41962 -1.000
TRINITY_DN13057_c0_g3_i1 827 40913 41740 -0.960
TRINITY_DN13563_c8_g3_i1 41339 29 41368 0.999
TRINITY_DN12884_c0_g1_i2 21 40477 40498 -0.999
TRINITY_DN12884_c0_g1_i1 11 40365 40376 -0.999
TRINITY_DN13630_c2_g3_i1 39921 4 39925 1.000
TRINITY_DN13093_c1_g1_i2 3 39072 39075 -1.000
TRINITY_DN13653_c2_g3_i1 38485 39 38524 0.998
## Strand-specific RNA-Seq, but assembled as non-strand-specific
#transcript plus_strand_1stReads minus_strand_1stReads total_reads diff_ratio
TRINITY_DN13653_c2_g1_i1 93806 22 93828 1.000
TRINITY_DN13640_c9_g3_i3 69431 14 69445 1.000
TRINITY_DN13631_c3_g1_i1 66033 11 66044 1.000
TRINITY_DN13652_c2_g2_i2 60368 7 60375 1.000
TRINITY_DN13315_c9_g1_i1 6 50921 50927 -1.000
TRINITY_DN13637_c7_g1_i1 46489 4 46493 1.000
TRINITY_DN13631_c3_g1_i2 42728 6 42734 1.000
TRINITY_DN13560_c7_g6_i1 8 41954 41962 -1.000
TRINITY_DN13057_c0_g3_i1 827 40913 41740 -0.960
TRINITY_DN13563_c8_g3_i1 41339 29 41368 0.999
TRINITY_DN12884_c0_g1_i2 21 40477 40498 -0.999
TRINITY_DN12884_c0_g1_i1 11 40365 40376 -0.999
TRINITY_DN13630_c2_g3_i1 39921 4 39925 1.000
TRINITY_DN13093_c1_g1_i2 3 39072 39075 -1.000
TRINITY_DN13653_c2_g3_i1 38485 39 38524 0.998
