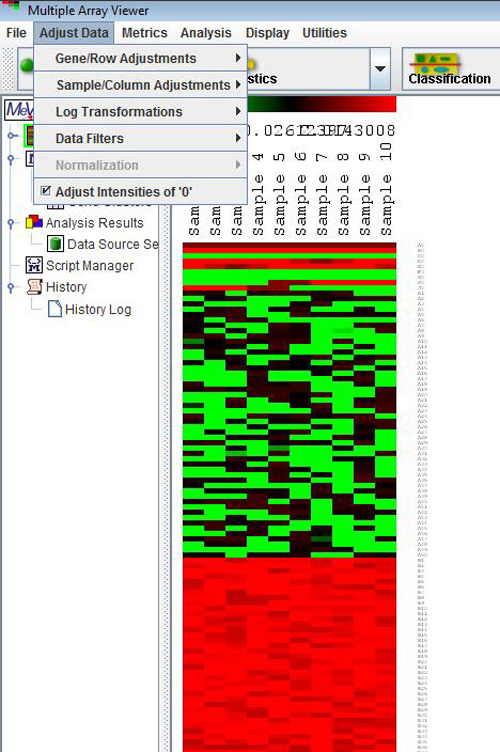
Adjust Data Menu
Prior to starting an analysis, certain data adjustments can be done using the items in the Adjust Data menu. These include normalization for genes/rows, log transformations, and various filters.
Adjustments may not necessarily affect the main display or the values displayed when elements are clicked on the matrix displays. However, adjusts will influence the calculation of the expression matrix, the foundation of all analyses. They will also be reflected when the entire matrix or individual clusters are saved as text files (*.txt), although the original data files are not overwritten. Furthermore, with the exception of three options, ōSet Lower Cutoffs,ö ōSet Percentage Cutoffsö and ōAdjust Intensities of Zero,ö all the changes made to an expression matrix are irreversible for the current MeV session. Different types of adjustments may be applied on top of one another in any sequence, and the same type of adjustment may be applied repeatedly to the matrix, although this may not make sense from the point of view of analysis.
Because of the above features, sometimes it might not be a good idea to apply data transformations halfway through an analysis, as the post-transformation analyses and displays might not be entirely consistent with the pre-transformation analyses.. (The exception for this would the ōSet Lower Cutoffs,ö ōSet Percentage Cutoffsö and ōAdjust Intensities of Zeroö options which will be discussed in section 5.4.) A good way to use these options might be to apply any required adjustments to the data set, save the entire adjusted matrix as a tab delimited, multiple sample (TDMS) formatted text file by choosing File-->Save Matrix, and then load this new file in a new MeV session. During this time no further data adjustments will be made. This will ensure consistency throughout the MeV session. Adjustment options are described below.
Log2 Transform
This is fairly self-evident, because it just takes the log2 transform of every element in the matrix. Note that this adjustment should not usually be necessary. When *.tav or *.mev files are loaded into MeV, the program will automatically compute the log2 ratio of the two intensities and use them in the expression matrix. TDMS files also often contain pre-calculated log2 ratios.
Normalize Genes/Rows
This will transform values using the mean and the standard deviation of the row of the matrix to which the value belongs, using the following formula:
Value = [(Value) ¢ Mean(Row)]/[Standard deviation(Row)]
Hoever, most data is already normalized when loaded.
Divide Genes/Rows by RMS
This will divide the value by the root mean square of the current row, where root mean square = square root [Σ(xi)2/(n-1)], where xi is the ith element in the row consisting of n elements.
Divide Genes/Rows by SD
This will divide each value by the standard deviation of the row it belongs to.
Mean Center Genes/Rows
This will replace each value by [value ¢ Mean(row that value belongs to)].
Median Center Genes/Rows
This will replace each value by [value ¢ Median(row that value belongs to)].
Digital Genes/Rows
This will divide up the interval between the minimum and the maximum values in a row into a number of equal-sized ōbinsö. Each value is now replaced by an integer value of zero or greater, denoting which bin it belongs to (e.g., the minimum value is assigned to bin ōzeroö, indicating it belongs to the lowest bin; the maximum value is assigned to the highest bin, and the rest of the values fall in the intermediate bins).
Sample/Column Adjustments
These function in the same way as their corresponding options on genes/rows, except that the current column values, rather than the current row values, are used in the computation.
Log10 to Log2
This assumes that the current data are log 10 transformed, and transforms them to log base 2, i.e., it assumes that the input data is in the form log10x, and it outputs log2x.
Log2 to Log10
This assumes that the current data are log 2 transformed, and transforms them to log base 10, i.e., it assumes that the input data is in the form log2x, and it outputs log10x.
Unlog2 transformation
This assumes that the current data are log2 transformed, and removes the log2 transformation.
Select to exclude from analysis any genes for which the expression values are lower than specified values. There are two options in this menu. One is for two color arrays and one is for single-color arrays.
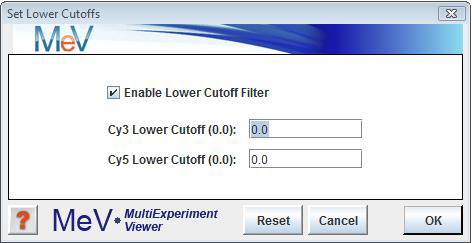
For two-color arrays: select to set either the corresponding Cy3 or Cy5 columns. To enable this option, check the ōEnable Lower Cutoff Filterö checkbox just below the ōSet Lower Cutoffsö menu option, and uncheck it to disable this option. All subsequent analyses will include only those genes for which all Cy3 and Cy5 values are above the specified thresholds. This option is disabled by default.
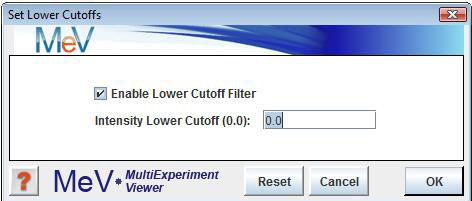
For single-color arrays: select to set intensity lower cutoff. To enable this option, check the ōEnable Lower Cutoff Filterö checkbox just below the ōSet Lower Cutoffsö menu option, and uncheck it to disable this option. All subsequent analyses will include only those genes for which intensity is above the specified threshold. This option is disabled by default.
The lower cutoff data adjustment is used to trim out genes having low intensity data. The trim criteria is such that if any one expression value for a gene falls below the Cy3 or Cy5 intensity value cutoffs then that gene will excluded from further analysis. This method is rather stringent since the entire gene is removed from analysis if it fails for one intensity in one experiment.
One possible utility is to exclude genes with missing data by setting the cutoffs to a very low value such as 1. The possibility of exclusion increases with increased number of experiments making this feature impractical for many data sets.
Note that if the goal is to make sure that a gene has valid data representing most of the experiments, percentage cutoffs is a more flexible alternative.
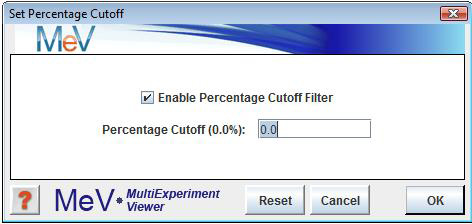
Percentage CutoffsSelect to ignore the genes for which there are not enough valid (non-zero) expression values across all samples. This will not delete any data, but will only exclude the genes from analysis. This option is sometimes useful in speeding up module calculation since many zeros will often slow them down.
To determine which genes will be excluded, select and enter a percentage value. To enable this option, check the ōEnable Percentage Cutoff Filterö checkbox just below the ōSet Percentage Cutoffsö menu option, and uncheck it to disable this option. Genes with less than the specified percentage of non-zero values will be ignored.
The variance filter allows the removal of genes with low variation of expression over the loaded samples. This filter is basically used to remove æflat genesÆ that donÆt vary much in expression over the conditions of the experiment. Select The variance filter has three possible criteria for specifying which genes to keep. The Enable Variance Filter check box turns the filter on and off. Be sure to observe the History Node log to see the number of genes retained after using the filter. Note that the variance filter is performed after other filters such as Percent Cutoff Filter is imposed. This convention insures that the genes that are checked for variance also contain some minimum level of ægoodÆ (not missing) data.
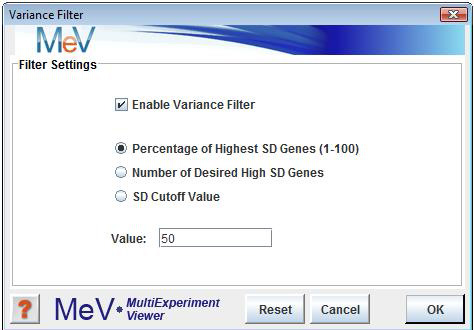
The option ranks the genes based on standard deviation and then the genes that are kept are some percentage of this ranked list. For example, if we have 1000 genes and the percentage was set to 20%, then the result would be a final list of the 200 most variable genes.
The also ranks the genes based on SD and then the number of genes specified are selected from this SD ordered list such that the highest SD genes are selected.
The uses an actual SD value such that all genes having an SD greater than this value are selected.
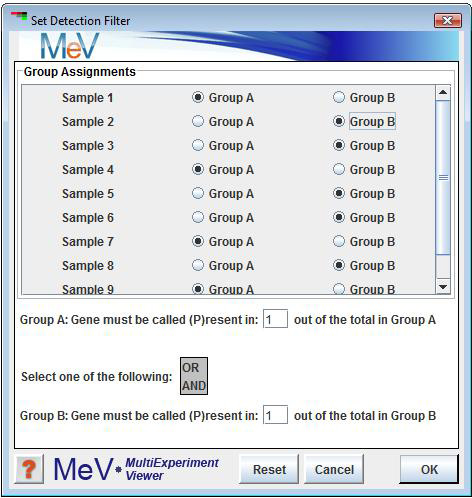
Detection Filter (for Affymetrix Data w/ Detection Calls Only)
Select to ignore genes that are not marked æpresentÆ in enough samples. Select Set Detection Filter to divide the samples into two groups. Enter the number of times that a gene must be called as æpresentÆ in group A. Do the same for group B. Select 'AND' so that each gene must pass both criteria. Select 'OR' so that a gene only must pass one of the criteria in order to be used in further analysis.
Fold Filter (for Affymetrix Data Only)
Select to remove genes that do not pass one of three specified criteria based on Fold Change. Fold Change is calculated as: (mean signal in Group A)/(mean signal in Group B). Select and define the two groups to be filtered. Enter the threshold by which expression of genes in one group should exceed that of the other group. Select the appropriate ægreater-thanÆ or æless-thanÆ symbol to define which group should be more highly expressed than the other. Select æbothÆ to keep genes in which either groupÆs expression level exceeds the other by the defined threshold.
Adjust Intensities of Zero
This option is turned on by default. This means that if either (but not both) of the cy3 or the cy5 intensities for an element is recorded as zero, that intensity value will be reset to 1. In this case, the expression ratios will be calculated as cy5/1 or 1/cy3, depending on which value is zero, and the element is included in subsequent analyses. Sometimes, the user may desire this. However, the user should be aware that the expression ratios for such elements are spurious. You might want to turn this option off, if you want to eliminate all those elements from the analysis that have at least one zero intensity value.
If you deselect this option if either intensity is zero, then the log ratio computed for analysis is set to a ōNot-A-Valueö flag (NaN) and it is not used during any analysis and appears as a gray element in the expression image. Note that with either option any elements with two zero intensities have the computed log ratio is set to the NaN flag since a log ratio cannot be computed.
Bioconductor detection call noise filter
Select Bioconductor detection call noise filter to filter the genes for which the absent call percentage across all samples is above the level users define in the dialog. This will not delete any data, but will only exclude the genes from analysis. Users can check how many genes are filtered from history log.
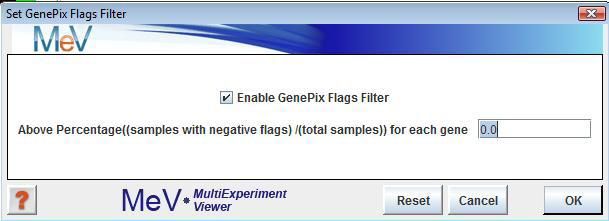
GenePix Flags Filter
The GenePix Flags Filter allows the removal of genes for which the samples with negative Flags percentage across all samples is above the level users define in the dialog. This will not delete any data, but will only exclude the genes from analysis. This option is sometimes useful in speeding up module calculation since many zeros will often slow them down.
To determine which genes will be excluded, select and enter a percentage value. To enable this option, check the ōEnable GenePix Flags Filterö checkbox just below the ōSet GenePix Flags Filterö menu option, and uncheck it to disable this option. A value of 0.0% indicates that all genes will be used in the analysis. To require that every one of the geneÆs expression values must be valid to be included, set the value to 100. This option is disabled by default.
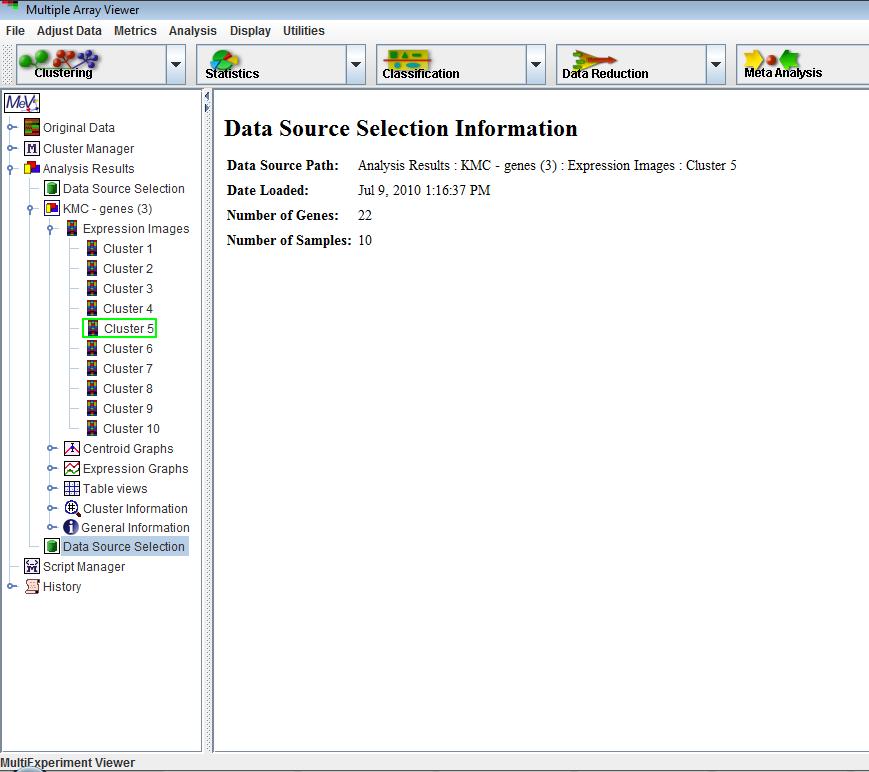
An important aspect of data analysis or data mining is what might be called analysis branching. This involves the initial selection of a gene or sample set based on a preliminary screen or analysis technique such as a statistical method, and then taking this subset of elements and performing more detailed analysis to find constituent features such as prevalent expression patterns. A right click on a result viewer node in the result navigation tree will present a menu option (when applicable) to set the contained data as the primary data set for subsequent analysis. The selected data source node in the navigation tree will be highlighted by a green rectangle which indicates that this is the primary data source for downstream analysis. As an indication of data source change, a node is placed on the result navigation tree to indicate the source of the data and the number of genes and samples in the selected data set. Subsequent analysis runs will use only this data subset until a new data source is selected.