Loading Tab Delimited, Multiple Sample Files (TDMS Format)
MeV can interpret files of several types, including the MultiExperiment Viewer format (.mev), the TIGR ArrayViewer format (.tav), the TDMS file format (Tab Delimited, Multiple Sample format), the Affymetrix file format, and GenePix file format (.gpr). See section 4 for details regarding the different file formats.
In addition to being formatted correctly, the input data should already be normalized. Using normalized data as input will result in more statistically valid output. MIDAS, a member of the TM4 software suite, is one program that can do this normalization.
MeV and other TIGR Files
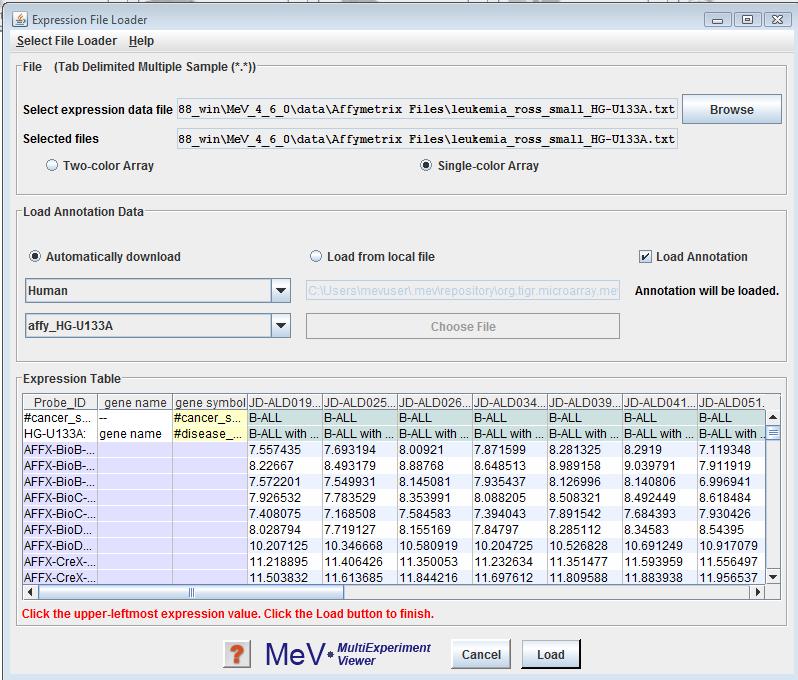
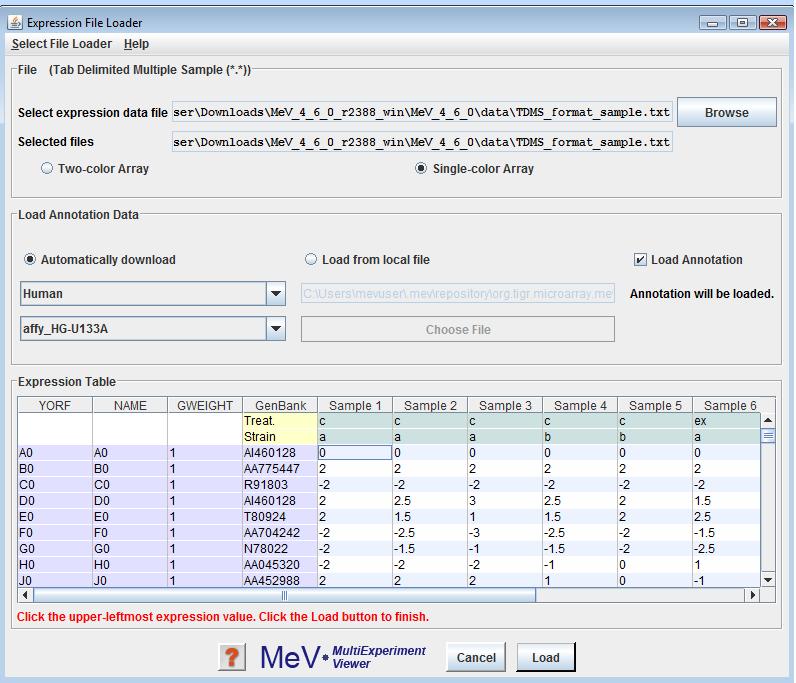
The Expression File Loader should be the screen that automatically comes up once you select from the menu. If not, click option from the drop-down menu to load TDMS format files. Use the browse button in the panel to select the desired file. The file will be displayed in a tabular format in the file loader preview table. Select either the or the radio button to indicate the data type of the expression data. Please read Using the Annotation Feature, for information on the same. Click the cell in the table which contains the upper-leftmost in the file. That is, click the upper-leftmost cell that contains measuered data of the genes. MeV will color-code the cells of the display table to indicate which cells it will load as expression data (white and gray stripes), gene/row annotation (purple), sample annotation (blue) or sample annotation labels (yellow). Gene annotation labels will be displayed in the column headers. Data in cells with white backgrounds will not be loaded. MeV allows you to have as many columns as you want of labels and annotation, but you must tell it where the labels end and the expression data begins. Check that the correct fields are listed before clicking .
One of the features of MeV release 4.1 is enhanced support for gene annotations. MeV provides users an alternative to fetch additional gene annotation, from the web based resource providing annotation based on The Gene Indices (TGI) for commonly available microarray resources, including widely used clone sets and Affymetrix GeneChip Arrays namely; RESOURCERER. Please refer to the developer’s manual for further information on the Annotation model. This feature is currently provided only for Affymetrix data.
Steps for using this feature
Select the organism your expression data comes from using the Choose Organism drop-down menu. The list of arrays in the Choose Array drop-down menu will be updated with the available array types. Choose the one that your data was collected from. The button to the right of the Choose Array drop-down menu will update, and will ready “Download” if the file has not already been downloaded. Click this button and MeV will attempt to download the file from the internet. If the file has been previously downloaded, this button will read “Select” instead of Download, indicating that internet access is not required to use this annotation. Click “Select” to choose this annotation type.
If internet access is not available and you have an annotation file of the appropriate format, you can still select an annotation file from your filesystem. Click the “Browse” button, located beneath the “Download” button, and select the file. Annotation file formats that are accepted include the Resourcerer file format and the Affymetrix .csv file format.
Follow any further instructions present in the file loader panel before clicking the button. In the example shown here, you will click on the upper leftmost in the panel before clicking the button.
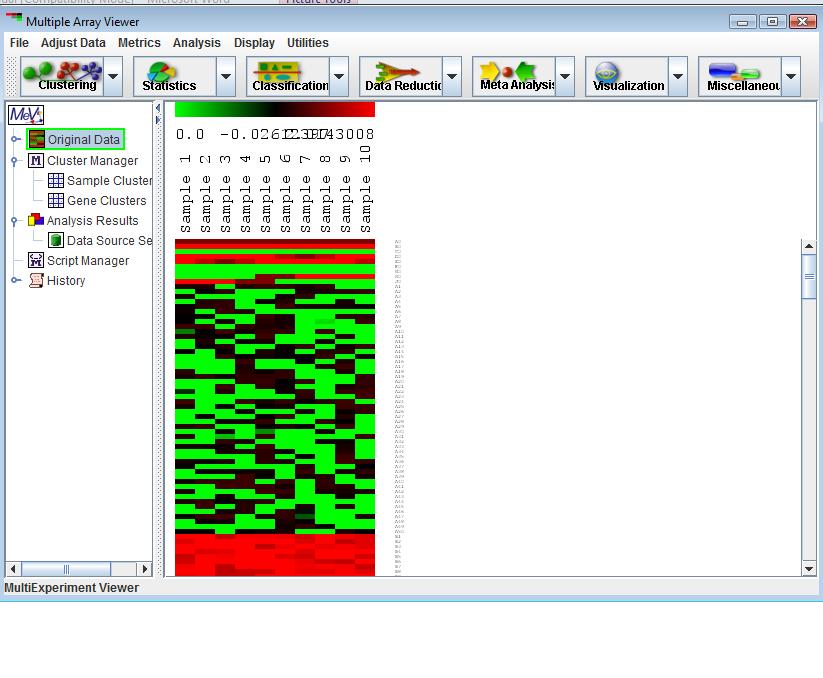
For each set of loaded, a column is added to the main display (4.16.1). This display is an Expression Image viewer, in which each column represents a single sample and each row represents a gene. The names of the samples are displayed vertically above each column, and any annotation field of interest from the input files can be displayed to the right of each row. MeV expects that each sample loaded will have the same number of elements, in the same order, and that each gene (spot) is aligned with that element in every other sample loaded. For example, using that rule, all input files will have data for gene x in row y. Clicking on a spot displays a dialog with detailed information about that spot. For more detail regarding the Expression Images viewer, see section 7.2.
The left side of the main interface is a navigation tree.
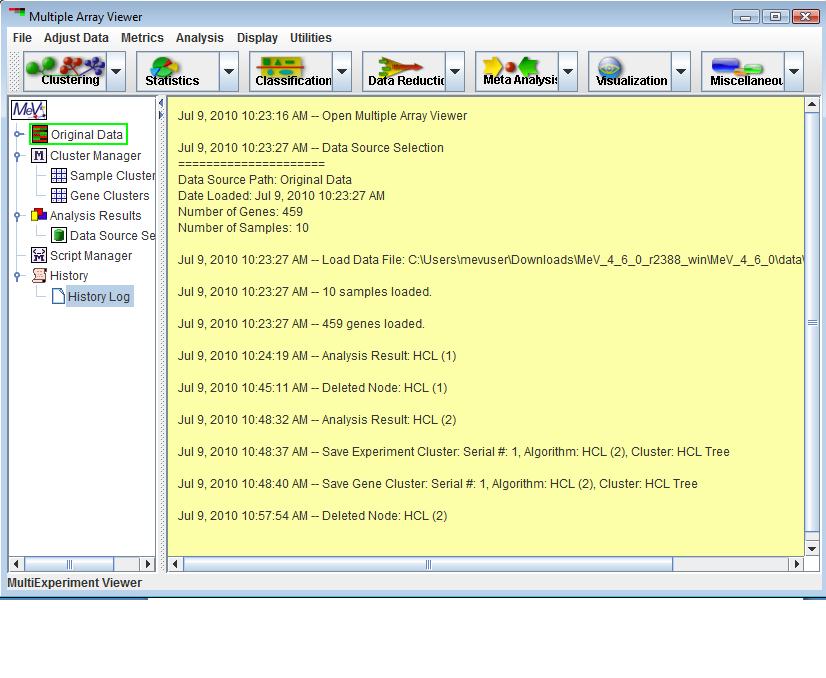
The History Node contains a log of most activities. For each log entry a date and time is recorded. Major events such as file loading, analysis loading, script loading, algorithm execution, and cluster storage events are logged to the History Log. If the analysis is stored to a file, then the History is retained and restored so that new events can be logged. The history log can be stored to a text file by right clicking in the viewer and selecting the Save History to menu option.