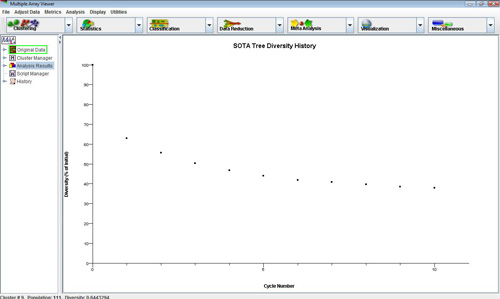
SOTA diversity viewer
(Dopazo et al. 1997, Herrero et al. 2001)
The initialization form shown below (0) is divided into four main areas. The SOTA algorithm constructs a binary tree (dendrogram) in which the terminal nodes are the resulting clusters.
Topology
The topology of the resulting tree is a binary tree structure where each terminal node represents a cluster.
Node
A structure which contains a Centroid Vector and a number of associated expression profiles (members).
Cell
A Node which is the terminal Node in a branch of the tree (a.k.a. leaf node). The members of the cell are considered members of an expression cluster.
Centroid Vector
A vector that is representative of the membership of a node.
Max Cycles
This integer value represents the maximum iterations allowed. The resulting number of clusters produced by SOTA is (Max Cycles +1) unless other criteria are satisfied prior the indicated maximum number of cycles.
Max epochs/cycle
This integer value indicates the maximum number of training epochs allowed per cycle.
Max. Cell Diversity
This value represents a maximum variability allowed within a cluster. All resulting clusters will fall below this level of 'diversity' (mean gene to cluster centroid distance) if diversity is used as the cell division criteria. (Unless Max cycles are reached at which time some clusters may still exceed this parameter)
Min Epoch Error Improvement
This value is used as a threshold for signaling the start of a new cycle and a cell division. The tree diversity is monitored during a training epoch and when the diversity fails to improve by more than this value then training has been considered to have stabilized and a new cycle begins.
Run Maximum Number of Cycles (unrestricted growth)
The algorithm will run until Max Cycles or until all of the input set are fully partitioned such that each cluster has one gene or several identical gene vectors.
Migration Weights
These values are used to scale the movement of cluster centroids (characteristic gene expression patterns) toward a gene vector which has been associated with a neighborhood. When a gene is associated with a cluster the centroid adapts to become more like the newly associated gene vector. The parent and sister cell migration weights should be smaller than the weight for the winning cell (Cell to which the gene vector is associated.).
Neighborhood Level
This value determines which cells are candidates to accept new expression elements. When elements are considered for redistribution to new node during a cell division candidate cells are determined by moving up the tree toward the root this number of levels. From that node, all cells (terminal nodes) within this subtree are targets for possibly accepting expression vectors. (Each vector moves into the cell to which it is most similar).
Use Cell Diversity
Cell diversity is the mean distance between the cell's members (expression profiles) to the cell's centroid vector. When considering which cell to divide, the cell with the greatest diversity is split. (providing it's diversity exceeds Max Cell Diversity (see above)
Use Cell Variability
Cell variability is the maximum element-to-element distance within a cell. The cell having the largest internal gene-to-gene distance is selected as the next cell to divide. In this case the stopping criteria is changed so that growth continues until the most variable cell falls below a variability criteria generated using the provided pValue (see below)
pValue
This value is used when using variability as the cell division criteria. A distribution of all element to element distances is generated by resampling the data set with each expression vector having randomized ordering of vector elements. The resulting distribution represents random gene to gene distances. The pValue supplied is applied to this resampled distribution to generate a variability cutoff. Clusters falling below this variability cutoff have a probability of having members that are paired by chance at or below the supplied pValue.
This check box selects whether to perform hierarchical clustering on the elements in each cluster created.
The result views created by the SOTA algorithm include the basic viewers with the addition of two SOTA specific viewers and enhancements to expression image viewers to include more cluster information.
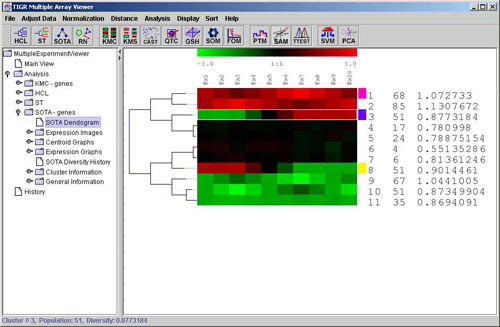
One of the SOTA specific viewers is the SOTA dendrogram (below) which displays the generated tree with the expression image of each resulting cluster’s centroid gene. The text to the right of the centroid expression image includes a cluster id number, the cluster population (number of genes in the cluster), and the cluster diversity (mean gene to centroid distance). Clusters can be colored and saved from this viewer and a left click over a cluster centroid jumps to the expression image for that cluster.
The SOTA diversity viewer shows the change in the summation of gene to associated centroid distance vectors for all genes in the tree. This is a measure of overall tree diversity. This can reveal how much diversity improvement is achieved with each cycle (new cluster addition).
: This floating point parameter is used as a cutoff value. Elements on nodes which have distances below this threshold can be considered as one entity (or cluster). Consequently the lower level detail of the tree is ignored.
: This integer is the minimum height of a node in the tree in units of pixels. Nodes which are close and would ordinarily have a node height below this value are forced to appear this number of pixels above the lower level node.
: Maximum Pixel Distance (integer) is the maximum distance that any node can have. Nodes which are distant and would ordinarily have a node height greater than this value are constrained to appear this number of pixels above the lower level node.