EASE Annotation Analysis Dialog
(Hosack et al. 2003)
The implementation of EASE within the MeV framework provides a method to give the researcher an initial biological interpretation of gene clusters based on the indices provided in the input data set and information linking those indices to biological “themes”. These themes are generally GO terms, KEGG pathways, or any other descriptive term related to biological role or biochemical pathway information.
The result of the analysis is a group of biological themes which are represented in the cluster. A statistic reports the probability that the prevalence of a particular theme within the cluster is due to chance alone given the prevalence of that theme in the population of genes under study (all “genes” loaded into MeV).
This implementation is based on the over-representation analysis feature of the EASE application available at http://david.niaid.nih.gov/david/ease.htm. Two classes have been utilized from the EASEOpensource package with modifications to enable some of the options described below. A full description to the theory behind EASE and test studies can be found in the EASE reference, Hosack, et al., 2003.
There are two main ways in which users can operate the MeV implementation of EASE annotation analysis on a given gene cluster: a default run and a custom run.
Default Run
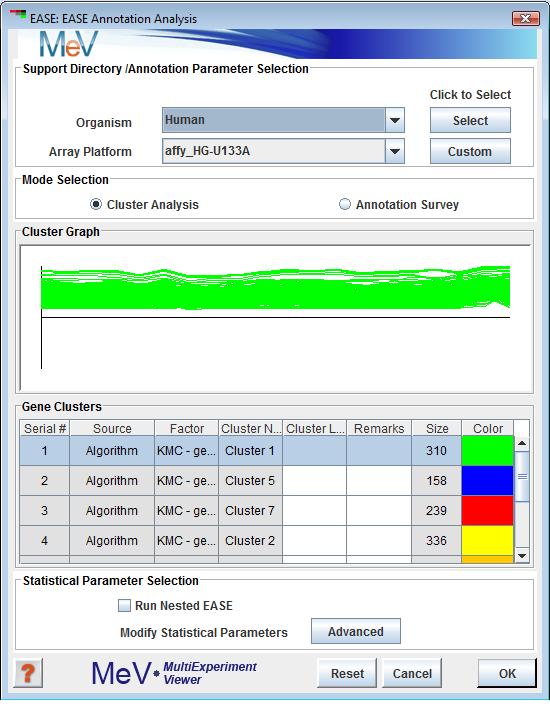
This mode is ideal for quick runs. Among the few parameters that need to be specified in the EASE Annotation Analysis dialog (fig 11.26.1) is the data files containing annotation information that match the desired species and array under study, the mode of operation (Cluster or Slide Annotation Analysis) and which subset is to be used from the available gene population. All other data necessary to run EASE such as gene population selection, statistical parameters, and gene ontology files for biological processes, biological roles, cell location and biochemical pathways will be obtained automatically. The following section on “Support Directory / Annotation Parameter Selection” explains in detail the steps to follow.
Custom Run
This mode is designed for tailored runs and can be used by clicking the “Custom” button at the top of the EASE Annotation Analysis dialog. Among the several parameters that can be specified by customizing EASE is the location of the necessary data files containing gene indices for loaded expression data, the selection of the background population against which cluster results will be compared, annotation keys used to uniquely identify genes, gene ontology files linking indices to biological themes and conversion files in case that the indices used by MeV are different than those in current linking files. Clicking on the “Custom” button on the upper right of the EASE Annotation Analysis window will bring up the EASE Advanced Parameters dialog which will allow the user to adjust default parameters to specific needs. To obtain more instructions refer to the “Advanced Parameters Dialog” section.
As in the case of the default run, if not specified otherwise, advanced statistical parameter for reported statistics, trim parameters and multiplicity corrections remain set to default values and will be used automatically.
Selecting an EASE File System
There are two methods of providing EASE with the data files it needs to do its analysis. The first is the simplest, standard method. At the top of the EASE Annotation Analysis dialog (fig 11.26.1) is a panel with drop down menus where you can select the species and array name that corresponds to your loaded data. If you used the automatic annotation loader to get your annotation, these values should already be selected. The button to the right of the species selector will indicate whether MeV already has the data for this array type downloaded. If the button says “Select”, then the required data files for the displayed array type are already downloaded to MeV’s repository. Click “Select” to select these data files for use. If the button text reads “Download”, then MeV has not yet downloaded and stored the required files locally. Click the Download button to begin downloading.
If your array is not listed in the drop-down menus then you will need to manually provide the data files, as described above, and choose the location of those files. To do so, click on the “Custom” button to bring up the EASE Advanced Parameters dialog, next click on the “Browse” button in the Directory Selection for Support Files panel. Do not use the Browse button if you have already selected an array with the drop-down menus and the Download/Select button.
The EASE implementation in MeV provides two major modes of operation, modes.
Cluster Analysis
This mode performs annotation analysis on a selected subset (sample list or cluster) of the full data set loaded in MeV. The output is a list of biological 'themes' represented in the cluster and a statistic reporting the probability that a particular theme is over represented in the cluster relative to it's representation in the entire data set. The resulting table will initially be sorted by this statistic.
Slide Annotation Survey
The survey mode simply produces a list of biological themes that are represented in the slide. The initial ordering of the output table is based on the prevalence of a theme in the data set (hit count). This mode can be used to cluster genes based on biological themes. The clusters can then be stored and marked (colored) for tracking during cluster analysis.
These two panels display gene clusters currently stored in MeV's cluster repository. If no clusters have been saved then a blank browser page will be displayed on this page and the Cluster Analysis mode option will be disabled. Selecting a row in the cluster table will display the cluster in the expression graph area of the browser. EASE cluster analysis will operate on the selected cluster.
Nested EASE
Check if you would like to run the Nested EASE algorithm after the EASE run is complete. The nEASE algorithm executes a second, sub-level, iterative Fisher’s Exact Test on significantly enriched GO terms identified in a first-level EASE analysis. This sub-classification approach provides increased sensitivity for detecting enriched GO terms and thus affords a deeper understanding of possible mechanisms underlying a given condition under study. nEASE was added to MeV as a new feature for version 4.5.
To further specify reported statistical and trimming parameters, click on the “Advanced” button, which will bring up the Statistical Parameters Dialog.
Directory Selection for Support File
This pane allows the user to manually provide an EASE file system from a local directory by clicking on the “Browse” button.
Analysis Population Selection
This panel provides options to specify a gene population list and has two options for list selection. The first option for selecting a background population is to use a population file. This is simply a file containing all gene indices from which the cluster was selected. Often this includes all slide annotation or a large subset of the slide with bad data and control spots removed. The file format is a simple list of indices with one entry per line.
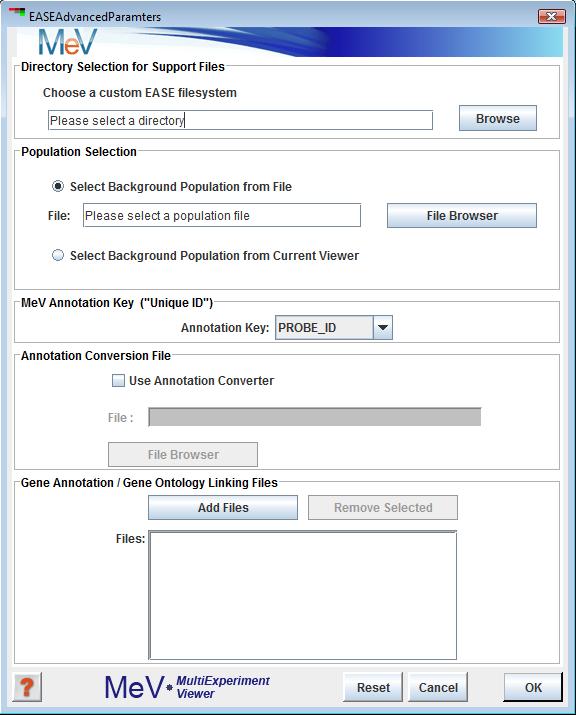
The second option for population definition is to simply use all of the genes currently loaded into MeV. It is often necessary to use the file to define the gene population because often the current viewer may not contain all genes considered to be part of the population. This is the case when the viewer was launched as a new viewer on a data subset or if the viewer was initially loaded with a previously saved cluster.
MeV Annotation Key
This area contains a drop down list which contains a list of available annotation types which can be used identify genes. Generally it's best to use an index or accession 'uniquely' identifying the spotted material.
Annotation Conversion File
This optional file provides the mapping from your annotation key (above) to the index used to map to biological themes (GO terms, KEGG pathways, etc.). If your annotation key type is the one used in the linking file (below) then this conversion (mapping) is not needed. These files if needed are typically stored in the Convert directory. This file selection tool will be disabled if you have selected "Use loaded array population as background".
Gene Annotation/Gene Ontology Linking Files
This section allows one to specify one or more annotation files. These files contain gene indices paired with biological themes such as GO terms. These files typically reside in the Class directory. If the user does not visit the EASE Advanced Parameters dialog when running EASE, all linking files in the current working directory will be loaded.
Several sections on this page are used to specify the reported statistic, optional multiplicity corrections, and optional result trimming parameters.
Reported Statistic
Fisher Exact Probability
The Fisher's Exact Probability reports the probability that a biological theme is over-represented in the cluster of interest relative to the representation of that theme in the total gene population. For example, suppose that one has a gene list of 50 genes from a population of 10,000 genes. Now suppose that 10 of the 50 genes were related to pathway "A" but only 13 genes in the total population were associated with pathway "A". This scenario would yield a low probability that the observed number of hits (occurrences of pathway "A") within the small sample could be due to chance alone. This statistic is based on the hypergeometric distribution and has benefits over chi-square in that it is appropriate for finite populations. The reference sited for EASE describes this statistic at length.
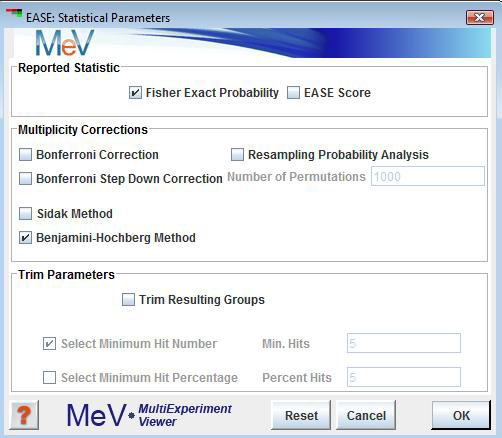
EASE Score
The EASE Score reported is essentially a jackknifed Fisher's Exact Probability that is arrived at by calculation of the Fisher's Exact where one occurrence (list hit for a term) has been removed.
Multiplicity Corrections
: This correction simply multiplies the statistic by the number of results generated. This is the most stringent correction of the three options.
: This modified Bonferroni correction ranks the results by the statistic in ascending order. Each value is multiplied by (n-rank) where n is the number of results. In the case of a tie, where two results have the same probability the rank is kept constant until the next element occurs having a higher probability value. The rank is then adjusted for the number of tied elements where rank was constant.
:This correction uses the following formula where v' is the corrected value and k is the rank of the result in terms of original statistic value. In this case ties in rank are handled as described in the step down Bonferroni correction described above.
v' = 1-(1-v)k (Sidak method formula)
: The resampling option performs a number of resampling iterations where random gene lists of the initial input size are selected from the population without replacement and run through the analysis. The result for each biological theme is a probability which indicates the probability of the original significance level (EASE score or Fisher Exact) occurring by chance alone.
Trim Parameters
The trim parameters can be applied to filter the analysis results based on either the of hits within the cluster or on the of genes in the cluster that are represented by an annotation term. Sometimes a term can be found significant but does not represent a large segment of the cluster of interest. These options can be applied to be certain that a minimum number of genes in the cluster fall under that particular annotation class. This feature should be used with caution so that biological themes represented by very few genes are not excluded.
The primary result is reported in a table in which entries are ordered based on the reported statistic. The table can be sorted on any column. A right click in the table will launch a menu allowing several operations:
Stores the genes associated with a biological theme as a cluster that will be stored in the cluster manager.
Opens one of three possible viewers containing the genes within the biological theme. These viewers are also accessible from a node in the result tree which follows the table node in result navigation tree.
Stores the result table to a tab delimited file.
Opens the default web browser using the URL associated with the theme file (e.g. KEGG pathway.txt) using the available accession or index. If the accession numbers are not available (in the Tags directory) or no URL file has been entered in the URL Data directory this feature will be disabled.
The GO Hierarchy Viewer is a hierarchical representation of GO terms resulting from an EASE cluster analysis. Each of the GO terms found in the cluster under analysis is represented by a node in the hierarchy and as one descends down a path in the hierarchy the terms represented by the nodes in the path tend to become narrower in scope in terms of identifying a particular biological theme. The color of each node represents the theme’s p-value relative to user-defined thresholds.
The header represents the currently selected node in verbose rendering or the hierarchy’s root in the case where no node is selected. The header also provides the key to relate node color to the two user defined thresholds.
Node Style
Node style dictates the rendering of the go tree nodes. rendering represents each node as a circle with the color representing the p-value’s relation to the defined thresholds. The rendering provides more information about the identity of the GO term including, GO id, GO term name, the p-value, and the number of genes in the cluster and in the population that are related to this GO term. Note the example of verbose rendering in the header of the Tree Viewer figure above.
Connector Style
Two connector styles are available, curved and strait. Under some circumstances, the strait rendering provides a more easily traced path.
Set Thresholds
Two user-defined p-value thresholds can be set using this option. The initial default levels are 0.05 and 0.01 for the upper and lower thresholds respectively. Representation of p-value significance by discrete colors provides a quick means to focus on significant results. Alterations to the thresholds are immediately represented in the header and the tree’s node colors.
Selection Polarity
The selection polarity option provides the option to modify tree path selection.The default is in which the nodes above (to the root node) and below the selected node are all selected. The forces path selection to extend from the selected node up to the root node of the tree. The option forces path selection to extend from the selected node down the tree.
Create Subset Viewer
Extracting subsets of nodes from the main hierarchy is perhaps the most important feature of this viewer. After selection of a tree path, it is possible to use this option to build a new GO Hierarchy Viewer from the nodes in the selected path. The extracted trees can be rendered in a new window or docked in MeV’s main viewer panel. Note that if the option it taken to render the new tree docked in MeV’s viewer panel then a node is placed in the result tree so that the subtree can be saved in the analysis.
Open Viewer
The open viewer option provides a shortcut method to jump from a node of interest to a viewer containing all of the cluster’s genes that are related to the selected theme node.
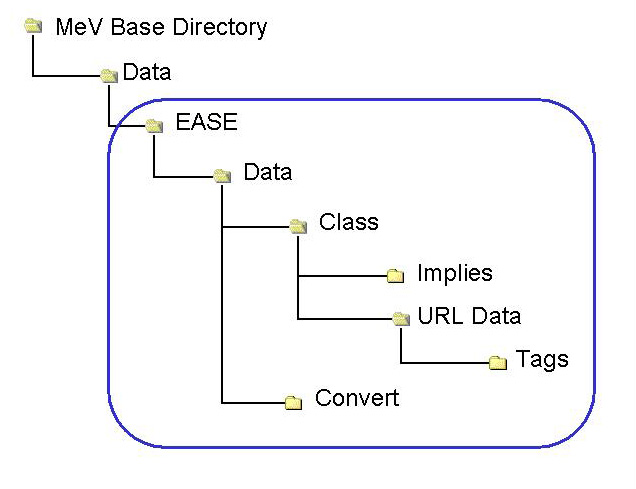
Behind the MeV version of EASE there is a file structure that contains files required for annotation conversion and linking indices to biological themes. The file structure mimics much of the file structure behind the stand-alone version of EASE. Advanced users interested in creating custom EASE support directories should be especially familiar with the following section.
The following table lists the directories used in the EASE implementation within MeV. The primary directories, and each contain files used by EASE. The minimal requirement is a file in the Class directory to map gene indices to themes.
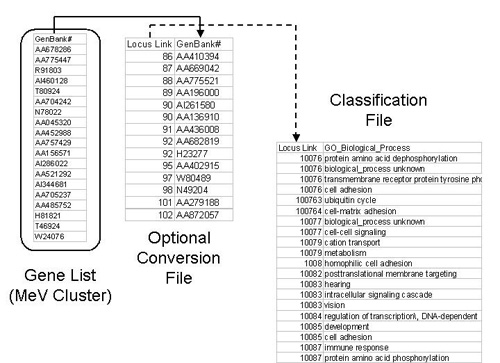
The files behind EASE are often used to link one annotation key to another annotation value and for that purpose most files are arranged in rows containing key/value pairs separated by a tab delimiter. The figure below shows a scenario which demonstrates how a primary index in MeV can be mapped through a secondary index to a biological theme, in this case a GO term.
| EASE | Root of the EASE file structure. |
| Data | Encompasses EASE data files. |
| Convert | Contains files linking indices (e.g. GenBank#-->Locus Link ID) These files are optional and are not needed if the annotation indices for each gene are the same as the keys in the Classification File (below). |
| Class | Contains files linking indices to biological themes (e.g. locus link id-->GO Biological Process) (MINIMAL REQUIREMENT) |
| Implies | Contains files relating themes to other themes (e.g. hydrogen ion transport “Implies” cation transport) |
| URL Data | Contains files describing a url indicating the tag (accession placement). The contents of these files act as a models when constructing links to resources using annotation accession numbers. |
| Tags | Contains files linking biological theme or pathway to accession numbers |