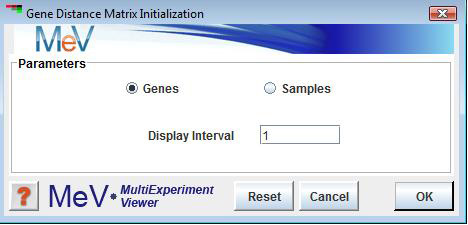
GDM Initialization Dialog
Most of the clustering methods found in MeV form clusters by algorithms that group genes based on similarity of expression pattern. The distance, inverse of similarity, between two genes is calculated using a distance metric (see ‘Distance’ menu and manual section 13, the appendix on metrics). The GDM gives an intuitive and comprehensive view of the distance (or similarity) between any two genes loaded into MeV by creating a colored matrix representing all gene-to-gene distances. The GDM module is useful for taking a distance survey as well as discovering which genes are similar in expression pattern to a particular gene of interest. Like most of the MeV modules, the GDM module can also be used with experiments as input.
The GDM module can be started by using the GDM button or by selecting the GDM menu item from the analysis menu. When creating a gene matrix it is possible to display a subset of the full data set. The creation of an nxn matrix is expensive from a computer memory standpoint and by using the “Display Interval” option it is possible to make a smaller matrix and conserve memory.
The Distance Matrix is used to view distances between elements in the data set. All clustering algorithms partition the data based on these computed distances and this viewer can provide a direct view of these distances.
Sample Selection
The sample selection option indicates whether to display a matrix of gene distances or experiment distances.
Display Interval
This allows a user to only display distances for a smaller sampling of the data by skipping (not including) distances by the increment given. This option is useful when one doesn't need or want to create a full size matrix which is organized by cluster membership. In this case the user can use the matrix with a few representatives from each cluster to get a feel for intra-cluster distances.
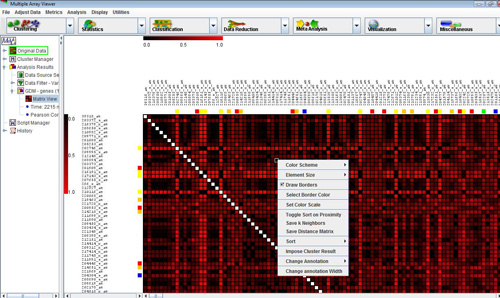
The matrix viewer has annotation headers that can be used to identify the gene associated with a column or row. Each square element within the matrix is rendered as a color that represents the distance between the two genes associated with the element. The main diagonal is simply rendered as white for identification.
Like most viewers in MeV, the GDM has a right click menu that provides options for extracting information from the viewer and manipulating the appearance of the viewer. In the sections below each of the menu options are described.
Color Scheme
Two default color schemes are available as well as the option to select a custom color scheme.
Element Size
Five preset element sizes are offered as well as the option to select a custom size. Changing the size is a good way to get either a detailed look at specific genes or to take a broad survey of the matrix.
Draw Borders
The Draw Borders options places borders between elements and can help with visual alignment when viewing the distance of one gene to several other genes on a single row of the matrix. The color of the border can be selected from the menu to contrast the colors used to represent distance.
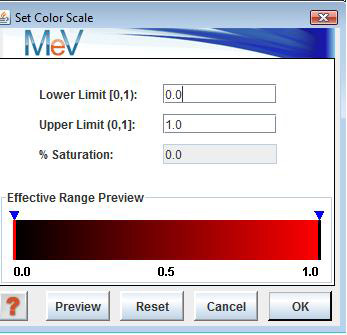
Set Color Scale
The GDM menu provides the option of selecting the limits of the displayed color scale. By altering the lower and upper limits of the scale, gene distances map to a different location on the color scale. The figure of the Color Scale Dialog illustrates this. The lower limit is at 0.0 while the upper limit is set to 0.4. Any element having a distance greater than 0.4 will appear in color at the bright red end of the gradient. The effective range is 0.0 to 0.4 and this will accentuate distances in this low-end range. By imposing different limits it is possible to get better resolution (color differentiation) within a given range. When setting the upper or lower limit to values other than 0.0 and 1.0 respectively, there will always be some gene pairs that have distances that fall off of the upper or lower effective range. The percentage of elements in the matrix that are saturated is displayed as a guide to the percentage of elements that are off of the effective range. When altering color scale it is often useful to hit the button to view the effects on the actual matrix. will return the values to the values that were in effect when the dialog was launched. will return the limits to the original values in effect when the dialog was launched and will dismiss the dialog. Note that the current limits are always displayed in the labels on the header color gradient.
This dialog controls the range over which distances will be differentially colored based on the color gradient selected. e.g. if the range is black to red in color and the range limits are 0.1 (lower limit) to 0.5 (upper limit), all distances below 0.1 will be represented by black, all distances above 0.5 will be represented by red, and distances within the range will be represented by a color corresponding to their position on the color gradient. The distances outside of the defined range are said to be saturated (in terms of color representation). The Dynamic Range Preview panel clearly represents the current limits applied to the matrix.
Lower Limit
The lower range limit defines the distance below which distances will be uniformly represented by the lower extreme color of the gradient. This value must be in the range [0,1) and be less than the upper limit.
Upper Limit
The upper range limit defines the distance above which distances will be uniformly represented by the upper extreme color of the gradient. This value must be in the range of (0,1] and be greater than the lower limit.
% Saturation
The percent saturation value represents the number of matrix elements which fall outside of the current range. Note that this field is only updated upon hitting the 'Preview' button.
Effective Range Preview
This color gradient displays the current limits. (Initial values or entered values after hitting the 'preview' button.
Toggle Sort on Proximity
In the main matrix figure you may note that a gene in the column header is selected as denoted by the rectangle around the gene identifier. Moving the mouse cursor over the header enacts item selection. If you click on the label in the header then that element is moved to the left (or top if in row header) and the remaining elements are ordered by proximity to the selected element. Typically you should see the first row and column appear as a gradient since the neighbors are ordered by proximity. The sort menu options can be used to impose other orderings. The Toggle Sort on Proximity menu item turns this capability on or off.
Save k Neighbors
The Save k Neighbors menu option is used in conjunction with proximity sort. Once sorted by proximity the Save k Neighbors options saves any number of the selected gene’s (or sample’s) nearest neighbors as displayed in the viewer.
Sort
The Sort menu provides methods to sort the genes or samples according to the order specified in the input file (default) or by a selected annotation key. This provides a useful method to be used with proximity sort. First one can order by annotation which enables easy selection of the gene of interest. Once found, clicking on the gene’s label will shift it to the corner position with its nearest neighbors in order of proximity.
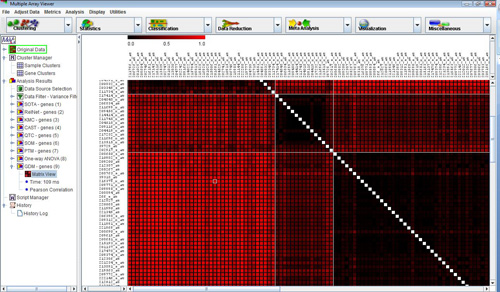
Impose Cluster Result
The Impose Cluster Result option is among the most useful features of the GDM. When selected the current MeV session is surveyed for appropriate clustering results to apply to the GDM. Application of the clustering result reorders the genes such that the rows and columns are grouped by cluster membership. Cluster boundaries are represented by a white border. Notice the figure displaying a distance matrix with a K-means clustering result imposed with five clusters. The elements within a cluster are similar as evidenced by the very dark squares on the main diagonal. Note that the element size was reduced in order to view the entire matrix and that every third gene was displayed.
Change Annotation
The change annotation feature allows the selection of an annotation type to be displayed in the headers.
Change Annotation Width
This option allows the expansion or contraction of the header to permit viewing of the header without excessive scrolling or if contracted more of the matrix will be visible.
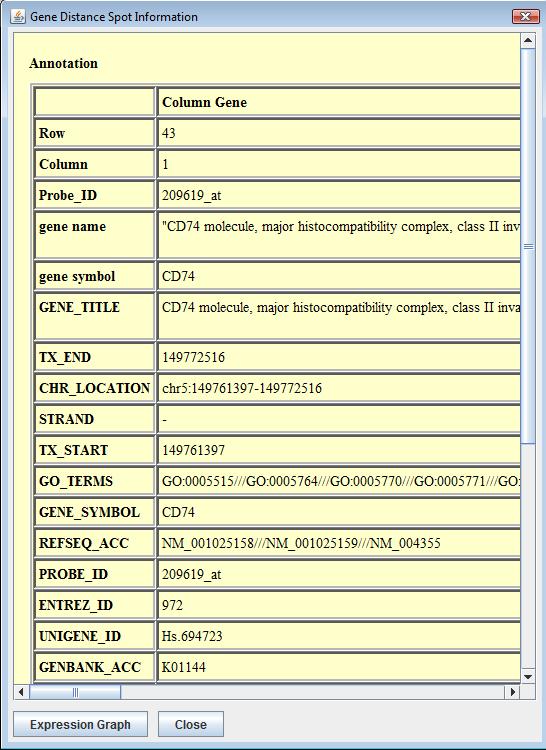
If one clicks on a spot an information record is displayed describing several attributes of the element. The annotation identifying each element as well as the raw and scaled (0-1) distances and parameters related to taking the distance such as distance metric are reported. From this report page a graph can be displayed using the Expression Graph button. The graph overlays the expression graphs of the two genes.