SVM Process Overview
(Brown et al., 2000)
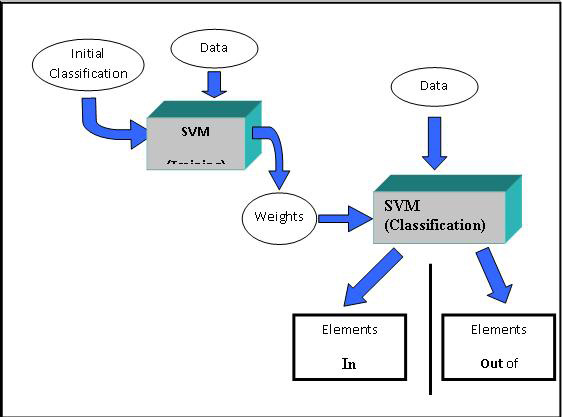
Although SVMs have been used in various fields of study, the use of SVMs for gene expression analysis was described in detail by Brown et al. SVM is a supervised learning classification technique. The algorithm uses supplied information about existing relationships between members of a subset of the elements to be classified. The supplied information, an initial presumed relationship between a set of elements, coupled with the expression pattern data leads to a binary classification of each element. Each element is considered either in or out of the initial presumptive classification.
The algorithm proceeds through two main phases. The first of these phases, , uses the presumptive classification (supplied knowledge) and the expression data as inputs to produce a set of weights which will be used during the next phase. The second phase, , uses the weights created during training and the expression data to assign a discriminant or score to each element. Based on this score each element is placed into or out of the class.
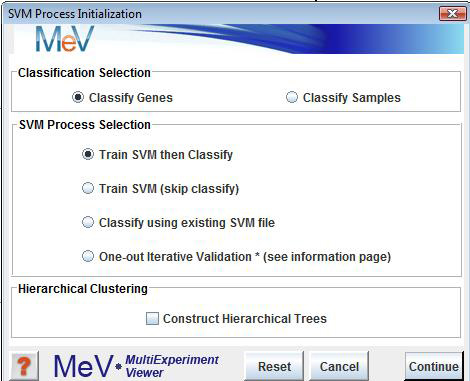
The initial dialog is used to define the basic SVM mode. One can select to classify genes or experiments and can select to perform one or both phases of the algorithm. The Train and Classify option allows one to run both phases of the algorithm. Starting with a presumptive classification and expression data the result is a final classification of each element. The Train only option produces a list of weights which can be stored as an ‘SVM’ file along with training parameters so that they can be applied to data to classify at a later time. The Classify only option prompts the user for an SVM file of weights and parameters and results in final classification. The user also has an option to produce hierarchical trees on the two resulting sets of elements.
Sample Selection
The sample selection option indicates whether to cluster genes or experiments.
Process Selection
The SVM algorithm works by performing two main processes, training and classification. One can elect to perform training only, classification only, or both phases of the SVM classification technique.
The option results in a set of numerical weights which can stored as an SVM file and used for classification at a later time.
The option takes a file input of weights generated from training and results in a binary classification of the elements.
The option provides the ability to use the input set as a training set to produce weights which are immediately applied to perform the classification.
The iteratively performs an SVM training and classification run. On each iteration one element is moved to the neutral classification and therefore will not impact the SVM training nor the classification of elements. The final classification will not be biased by an initial classification of the element.
Hierarchical Clustering
This check box selects whether to perform hierarchical clustering on the elements in each cluster created.
Classification Input
The SVM training process requires the supplied expression data and an additional initial presumptive classification which indicates which elements are initially presumed to have a relationship. Two options are provided for selecting members of the initial classification.
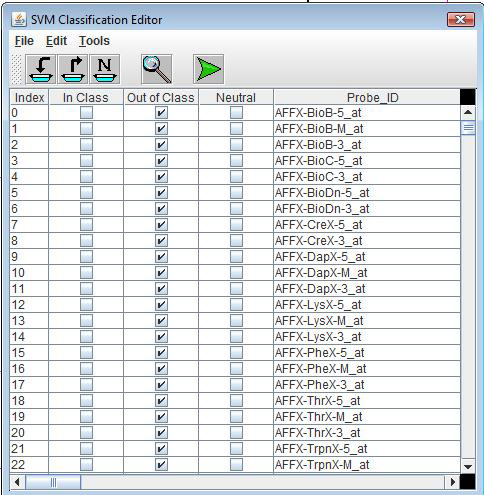
Use SVM Classification Editor
This option causes an editor application to be launched in order to allow a flexible tool for finding and marking elements to be positive members of the initial classification. This classification can be saved as an SVC file for later recovery of these initial settings.
Use Classification File
This allows the loading of an initial classification from an existing SVC file.
Kernel Matrix Construction
One can select to construct a polynomial or a radial kernel matrix.
Constant: An additive constant. (c)
Coefficient: A multiplicative constant. (w)
Power: A power factor. (p)
The Radial Basis checkbox is used to select to use this type of Kernel generating function.
Width Factor: Radial width factor (w, see in below formula).
Radial Basis Kernel Function
K(x,y) = e( - (||x - y||^2)/(2w^2))
Diagonal Factor
Constant added to the main diagonal of the kernel matrix. Adding this factor to the main diagonal of the kernel is required to force the matrix to be 'positive definite'. The definition of a positive definite matrix is best reviewed in books devoted to linear algebra but this state is achieved by selecting a constant of sufficient magnitude.
This positive definite state of the kernel matrix is required for the SVM algorithm to yield meaningful results. Testing values starting at 1.0 and increasing may be required to find an appropriate value. If the value is too low all elements will be partitioned in the negative class. For a range of values for this factor a stable set of elements may be classified as positive. At very high values there is a tendency to force all positive examples to be in the positive class regardless of their similarity of expression.
Threshold
This value is used as a stopping criteria for the weight optimization phase of training. Optimizing the weights produced during training is an iterative process which converges on an optimal set of weights to separate the positive and negative examples. This threshold dictates how stable the weights must be before the optimization process is terminated. Selection of a threshold that is very low could cause the optimization process to take an extremely long time and yet yield similar results to those where a higher threshold value was used which terminated the process earlier.
Constraints
This check box selects to apply limits to weights produced during training.
Positive Constraint
The upper limit to produced weights.
Negative Constraint
The lower limit to produced weights.
The SVC file format is a tab delimited text file with the following columns for each element,
The SVM Classification Editor allows one to use searches on supplied annotation as well as SVC files to assign membership to the initial presumptive classification. The editor allows the user to sort the list based on classification or annotation fields. The constructed initial classification can be stored in SVC format and later reloaded to allow alterations to produce what could be several initial classifications for a given study. The SVC files, once created, can be used to supply the initial classification thereby skipping the editor step. If the editor is used a button or menu selection launches the algorithm based on the current classification selection.
The second dialog also defines parameters used for creating the kernel matrix. The following is an overview of the training parameters.
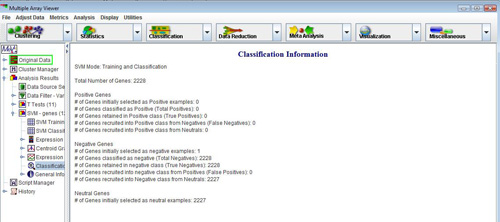
The final result of an SVM run depends upon the process run. Training results in a set of weights that can be viewed along with the parameters for kernel construction. Note that from this viewer the training results can be saved as an SVM file. Classification results in a viewer that indicates each element’s discriminant value and a final classification. The SVM Classification Information Viewer describes how many elements were initially selected as positive examples and how many elements were later recruited into the positive and negative classifications as well as other overview statistics.
Expression image viewers reveal which elements have been recruited into each of the final classification partitions by coloring the annotation red. Other result viewers are essentially the same as those describe in the K-Means clustering section.