A typical workflow looks like this:
Optimal Syntenic Layouter
Summary
We developed the software OSLay for ordering and sorting contigs of unfinished genome assemblies employing the synteny between related sequences at nucleotide level.In contrast to existing tools, OSLay is even capable of using fragmented assemblies as reference to detect supercontigs. Our approach enables the meta-assembly of a genome i.e. to use data obtained form two different sequencing techniques to close gaps. Besides facilitating the visual validation of the current assembly status, results can be directly imported into the assembly editing tool Consed to support the generation of applicable primer pairs.
Idea
Generally speaking, the OSL algorithm tries to find a contig layout by moving and flipping contigs of a target assembly, for a fixed ordering of reference assembly, to elongate local diagonals provided by overlapping sequence matches.Download...
Installers for several operation systems can be downloaded here.Installation
- Unix/Linux
Execute oslay_unix_0_x.sh and follow the gui installation routine.
Not being root, simply install the application into your home directory.
Otherwise your are proposed to install it into /opt/.
Start by executing /yourPath/oslay.
In the program folder you will find a file named OSLay.desktop. If you like, move this to your desktop for faster access. - MacOS X
Simpy doubleclick the downloaded file oslay_macos_0_x.dmg and follow the installation routine.
After that you should find an icon named OSLay on your desktop.
The program folder is located in /Applications/OSLay unless you changed the folder during installation process. - Windows
Simpy doubleclick the downloaded file oslay_windows_0_x.exe and follow the installation routine.
After that you should find an icon named OSLay on your desktop.
The program folder is located in C:\ProgramFolder\OSLay unless you changed the folder during installation process.
Uninstallation
- MacOS X and Linux
Simply remove the OSLay folder from your system or use the uninstaller in your program directory. - Windows
Double click the file called uninstall.exe in your installed OSLay directory.
Start OSLay:
Four windows will appear providing different views and options:
An additional message window is available when clicking Window->Messages... in the result window.
Find some useful hints applying OSlay here
Import Files:
You need to have three files at hand to get OSLay running.
- Query FASTA File:
Your multiFASTA file which contains DNA sequences of contigs you want to order. - Subject FASTA File:
Your FASTA (multiFASTA) file of the subject sequence (assembly) which guides the contig layout process. - BLAST Matches file:
A BLAST file (standard or tabular format) which is the alignment of the query fasta file against the subject fasta file using BLASTN. (NUCmer .coords file is also readable.)
Result Window:
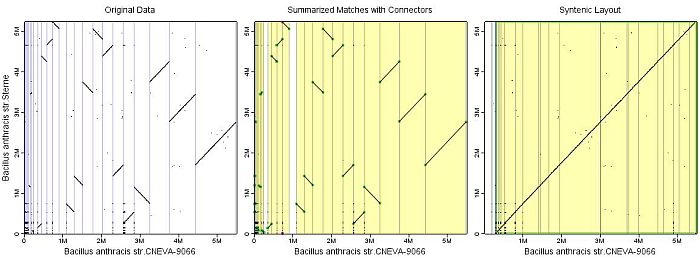
Three views are shown in the result window:
- Original Data
This view shows the raw data as it is parsed from the BLAST result file. Thin blue lines (horizontal and vertical) indicate the contig borders. Contigs are sorted by their length. - Summarized Matches with Connectors
This view shows the filtered and cleaned data. Match diagonals are smoother than in the raw data view because the numerous, short BLAST matches are now substituted by one-piece diagonals, the so-called summarized matches.
Some cells in the comparison grid are shaded yellow indicating a contained summarized match gives rise to a connector.
The green dots (red dots) represent locations where summarized maches touch or would touch the contig border of the target (reference) contigs on the xAxis. They are used exclusively to order the xAxis (yAxis) assembly.
- Syntenic Layout
This view contains the original matches but now, the connectors do not appear any longer because a syntenic layout is now established.
Green boxes enclose ordered and sorted supercontigs of the target assembly.
In case you sorted the yAxis as well, red boxes represent the computed yAxis supercontigs.
- undo and redo any kind of action
- select any data object and see its coordinates and info in the status bar by clicking the black arrow
- move any view
- zoom in and out ('-' and '+' on keyboard)
- zoom the data so that it fits the view window
Analyzing results and adapting parameters - Parameters Window:
The following configurations can be all adjusted in the Parameter Window.Typical values (bp) are given in brackets.
Generally, small values are more suitable for bacterial genome sizes (up to ~6MB), bigger values for e.g. mammals genomes (~120Mb)
Hovering the mouse over the parameter names in the window shows tooltips explaining them.
After the adjustment of parameters it is recommended to check visually or
statistically whether these changes could improve your results.
|| Summarizing Matches ||
| Minimal Match Size: Every sequence match smaller than this value will be removed from the view.
Hint: Use this filter if a lot of noise matches
appear in the Original Data view which might complicate the computation.
|
|
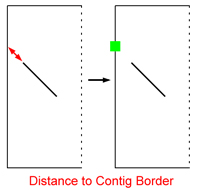
| Maximal Distance to Contig Border: Only summarized matches lying within this distance give rise to a connector and therefore can be locally extended.
Hint1: If fewer connectors and matches appear in the Summarized Matches view
as you have expected, try to increase this value. |
 |
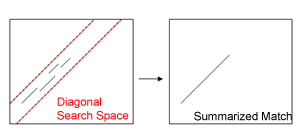
| Width of Diagonal Search Space:
Longer stretches of similar DNA sequences in the dot-plot usually consist of a bunch
of seperated, short BLAST matches. These match clusters are substituted by a one-piece diagonal for easier handling.
Hint: If summarized matches appear to be shorter than the corresponding BLAST matches in the
Original Data view, increase this value to extend the search space.
|
 |
| Maximal Gap Length between Consecutive Matches:
Sequence matches which previously were positioned within a diagonal, now are succeedingly traversed trying
to elongate the summarized match as much as possible. [~10000-20000 bp]
|
 |
|| Contig Layout ||
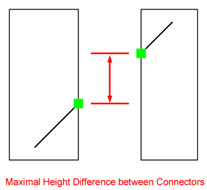
| Maximal Height Difference between Connectors: Only connectors coming from different contigs and lying within this distance can be connected.
Hint: This value represents the permitted gap size between two contigs. Be careful when choosing large
values: they might bias the result since short contigs originally positioned between these two contigs, could be skipped.
|
 |
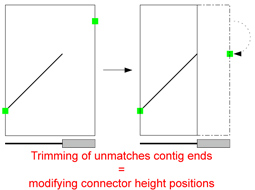
| Trim Unmatched Contig Ends:
Due to inserts of foreign DNA in only one genome for instance, unmatched contig ends (grey region in picture) appear. They often bias the
positioning of connectors i.e. calculation of the point where a match would touch the contig border. |
 |
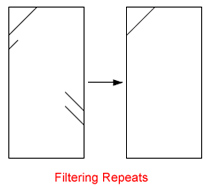
| Filter Repeats:
Summarized Matches starting or ending at nearly the same coordinates (x and y axis) get removed. Hint: Removing of repetetive regions located near contig borders can facilitate the layout process because it eliminate unwanted connectors. |
 |
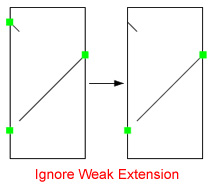
| Avoid Weak Extensions:
Contig ends might contain short match segments which align to other regions than the rest of the target contig.
If these short segments give rise to connectors, this can mislead the layout process.
|
 |
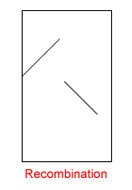
| Show Only Cells containing Recombinations:
If checked, only contigs are shown containing "broken" matches. Hint: This option does not modify the contig layout! It just keeps the concerned cells visible whereas the others are hidden. It gives the user the possiblity to check whether recombinations or misassemblies exist. |
 |
| Compute Layout for xAxis (rather than yAxis):
If checked, only the vertical (green) connectors are used for computing a layout for the xAxis assembly. |
|
| Compute Layout for Both Axis:
If checked, both axis are sorted and oriented subsequently. The layout computation
of one axis is totally independent from the other axis. |
|
| Export Syntenic Layout: If checked, a window appears providing several possibilities to write results to files. |
|
Visualization Parameters
The following configurations can be all adjusted in the Visualizations Window.
- Show only Boundaries of Contigs larger than:
If the data set contains many short contigs, their borders normaly shown as thin, blue lines may be visible as an opaque blue bar depending on the zoom factor.
By typing a number, only those contigs borders are drawn coming from contigs longer than this value. - Query Label and Subject Label:
Choose a name for the x and y axis. - Antialiasing:
Check this for smoother visualization. Data looks better when you want to export the result views. - xAxis (yAxis) Supercontigs:
Choose a color for the boxes indicating the supercontigs on xAxis (yAxis). - Background Color Summarized Matches View:
Choose a color for cell background in Summarized Matches View. - Background Color Syntenic Layout View:
Choose a color for cell background in Syntenic Layout View. - Window Background:
Choose a color for the background in the result window. - Visibility Options:
Check if a particular view should be hidden in result window as well as in exported pictures.
Message Window
Once opened by selecting Window > Messages... in the result window, the user is provided with the statistical output of each run.Get information about
- number of matches
- number of summarized matches
- number of connectors
- names of contigs containing broken matches
- ordered list of contig names
- percentage of contigs successfully layouted
- ...
Output
OSLay exports the results into several files which can be chosen from the following window:
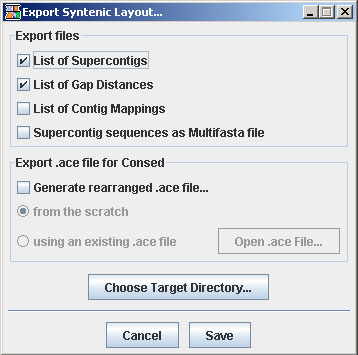
- List of Supercontigs
OSLay writes a file containing a list of the sorted and oriented contig names.
The file is named supercontigsList.#.txt where '#' is substituted with x or y depending on which axis was layouted. Ordering both axis in one run generates two files.A typical file would look like this:
1 (4) Contig1* Contig5* Contig2 Contig3*This example shows 2 supercontigs (indicated by line numbers).
2 (3) Contig4 Contig6* Contig7*
...
The first supercontig contains 4, the second supercontig 3 contigs (indicated by numbers in parenthesis)
The concatenated '*' means that the contig was flipped i.e. it changed its orientation.
This information is also available in the message window. - List of Gap Distances
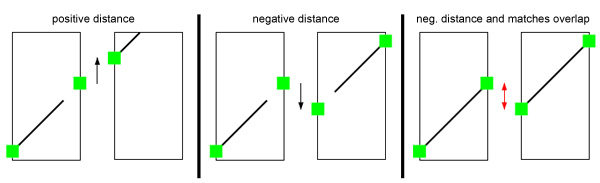
OSLay is able to predict gap distances between succeeding contigs by measuring the connector height difference of the two concerned contig sides which are neighbored in the contig layout. These distances can be helpful when designing primers on both contig ends (e.g. within Consed).
Note that these predicted distances are inferred only from the computed connectors ("Anchor point where a summarized match would touch the contig margin"). Thus, negative distances might represent contig overlappings. Therefore with every negative overlap there comes additional information (in squared brackets) if matches do overlap as well. In this case neighbored contig ends may be merged in the assembly.
The following image illustrates the three situations:
Example:
Contig10 1825 Contig5
Contig5 56 Contig74
Contig74 -613 Contig3 [Matches Overlap: 308bp]
Contig3 -205 Contig9
... - List of Contig Mappings
In case the reference sequence is an already finished genome, OSLay is able to print out an ascending list of coordinates where each target contig (and its summarized matches respectively) maps onto the reference sequence.
Therefore every summarized match gives rise to a single record in this list. Thus, contig ids may appear more than once in this list since matches can be distributed in a single contig sequence. A record has the following format:<target contigID> --> <start ref genome> <stop ref genome> <[length]> <reverse-complemented>
Example:
Contig3 --> 409 7800 [7391] *
Contig107 --> 511 1246 [735]
Contig_066 --> 8872 11002 [2130] *
... - Supercontig Sequences
If checked, a multifasta file is written containing the correctly sorted and oriented contig sequences plus the remaining contigs as DNA sequence. Each supercontig sequence is represented as one entry in the fasta file. The gap distances between contigs within every supercontig are filled with N's depending on the connector height difference.
The file is named supercontigSequences.#.fna where '#' is substituted with 'x' or 'y' depending on which axis was layouted. - Rearranged ACE file for Consed
Consed is a widely-used tool for viewing, editing and finishing sequence assemblies.
OSLay writes a self generated ACE file which assists the user with obtaining primer pairs for neighbored contigs.
Two options are available:- No ACE file available
OSLay creates a new one. - ACE file is already available from previous assembly
OSLay reads in an existing ACE file which has to be chosen by the user and creates a second, modified ACE file.
Generally, OSLay creates a new ACE file with rearranged and flipped contigs according to OSLay's computed contig layout. (All coordinates e.g. of concerned reads or affected tags are adapted as well.) Opening the rearranged ACE file in Consed and having the list of supercontigs and the list of gap distances at hand, the user is able to easily connect subsequent contigs by a primer pair bridging the gap between them.
Untouched contigs not being contained in supercontigs, are appended subsequently at the end of the ACE file. - No ACE file available
- Export images
You are able to export your current view to .png, .eps, .svg, .jpg, or .gif files.
Exported images look better if you antialias them first.Every view is resizable:
- first select the view by clicking on it so a red frame becomes visible
- press Ctrl and at the same time drag the nodes at the corners
If you want to hide certain views check these options. Maybe you want to change the background color of the window.
Handling project files
- Saving .cgv files
To not being asked to import all files and to readjust all parameter again when restarting OSLay, you can save your results and configurations in a .cgv file.
Therefore select File > Save > View and Data... and choose a file name.
All data plus your current views are saved so you do not have to import the raw data again. - Opening .cgv files
To open a given .cgv file, start OSLay.
Then select File > Open... and choose your file.
Useful Hints:
The goal of the program is to obtain one or several straight match diagonals in the dot-plot from the bottom left to the upper right corner.
The contig order of the target assembly is determined by the reference genome or assembly.The presence of extended match diagonals imply that OSLay could sort and orient the contigs by exploiting the collinearity of the two genomes.
- Original Data (OD) View :
If a lot of noise matches appear (very short matches ("dots"), distributed all over the plot), increase the match size filter. This might reduce possible bias. - Compare OD View with Summarized Matches (SM) View:
As described here, OSLay substitutes the original BLAST matches with summarized matches which are more convenient to handle. To obtain proper results, adequately adapt parameters in the 'Summarizing Matches' section so that the original BLAST matches are well represented in the summarized matches view:-
Use the '+'magnifier of the menubar to zoom into the view.
Both, OD and the SM view are connected, so when you zoom one view the other will directly follow.
Like this comparing is made easy. -
If diagonals being visible in the OD view do not appear in the SM view,
try to increase the Maximal Distance to Contig Border. Summarized Matches do only appear in SM view if they give rise to connctors, i.e. they (nearly) touch the contig border. Otherwise, if the actual distance between the end point of a match and the contig border is too large, no connector is generated and no summarized match is visible. -
If diagonals in SM view are substantially shorter than in OD view or if they are gapped,
try to increase the 'Width of Diagonal Search Space' and 'Maximal Gap Length between consecutive Matches' value. Since more original BLAST matches are then included in the computation, summarized matches can be enlongated.
-
Use the '+'magnifier of the menubar to zoom into the view.
- Syntenic Layout View
Once, all summarized matches give rise to connectors in the SM view, the final syntenic layout can be verified:- Was the computation successful?
If straight diagonals could be computed and most (or even all) of the contigs are located in supercontigs (check the message window output) you are done :)
In case you have a fragmented reference assembly, you won't be able to obtain _one_ single diagonal in the dot-plot but rather several of them. - Check visual output:
Check if most of the contigs are located in green (red) framed boxes indicating supercontigs at x axis (y axis), respectively. The more contigs can be used the better it is for the contig layout. If certain contigs could not be included in the syntenic layout, they are located ahead (left) of framed boxes. - Check statistics:
Look at the message window output telling you how many contigs could have been extended and how many percent of the total number of bases could be used for the contig layout. - Order of supercontigs:
Notice that even when OSLay detected several supercontigs and places them in a certain order in the final view, their order among themselves is still unknown. OSLay tries to group all supercontigs in increasing order concerning their yStart coordinate.
- Was the computation successful?
Author: Daniel C. Richter - Last change: 01/08/07
The OSLay software you are using is still beta and under development.