Rationale: Genomes contain
enormous amounts of evolutionary information, which tell us not
only about evolutionary histories of species, but also about
genome organization and structure. For this reason, we need robust
graphical tools that create views of the data bring out the
important features of genomes. In this tutorial, we will compare a
yeast genomes in the genus Saccharomyces, using the baker's yeast,
S. cereviseae as the reference genome.
Goal:
To discover major
genome rearrangements
in a pairwise
comparison of two complete genomes.
1. Comparison of S. cereviseae and S.
arboricola genomes
The Last package
contains a number of tools for comparative genomics. To
create a dotplot comparing the two species, we first need to
do a sequence alignment. In Last, this is done in two setps:
first create a database from the reference sequence for use
in later steps, and secondly, to align S. arboricola with S.
cereveseae, using that database.
When working with large files, it's best to get an idea of
how long various steps will take. The Unix time command can
preceed any other command, and will print out a report of
the time used in executing the command. To make the
database, type
time lastdb
-cR01 Scer GCA_000146045.2_R64_genomic.fna real 0m5.283s user 0m4.772s sys 0m0.052s
The database will be written to a number of files with the
base name Scer:
-rw-rw-r--. 1 psgendb psgendb
5842128 Nov 13 13:44 Scer.bck -rw-rw-r--. 1 psgendb
psgendb 176 Nov 13 13:44 Scer.des -rw-rw-r--. 1 psgendb
psgendb 509 Nov 13 13:44 Scer.prj -rw-rw-r--. 1 psgendb
psgendb 136 Nov 13 13:44 Scer.sds -rw-rw-r--. 1 psgendb
psgendb 136 Nov 13 13:44 Scer.ssp -rw-rw-r--. 1 psgendb psgendb 34842136 Nov 13 13:44
Scer.suf -rw-rw-r--. 1 psgendb psgendb 12071343 Nov 13 13:44
Scer.tis
The output of the time command tells us the time elapsed
during the execution of the program (real), the CPU time
used by the program (user) and the time required for system
overhead (sys).
To create the alignment, type
time lastal
Scer GCA_000292725.1_SacArb1.0_genomic.fna > ScerSarb.maf
real 0m30.982s
user 0m29.582s
sys 0m0.066s
This
run takes about 31 sec. on our system (500 Gb RAM, 40 CPUs).
Finally, to see the results in a dotplot,
time
last-dotplot ScerSarb.maf ScerSarb.png
last-dotplot: reading
alignments... last-dotplot: done last-dotplot: choosing bp per pixel... last-dotplot: bp per pixel = 12951 last-dotplot: processing alignments... last-dotplot: done real 0m3.779s user 0m2.967s sys 0m0.084s
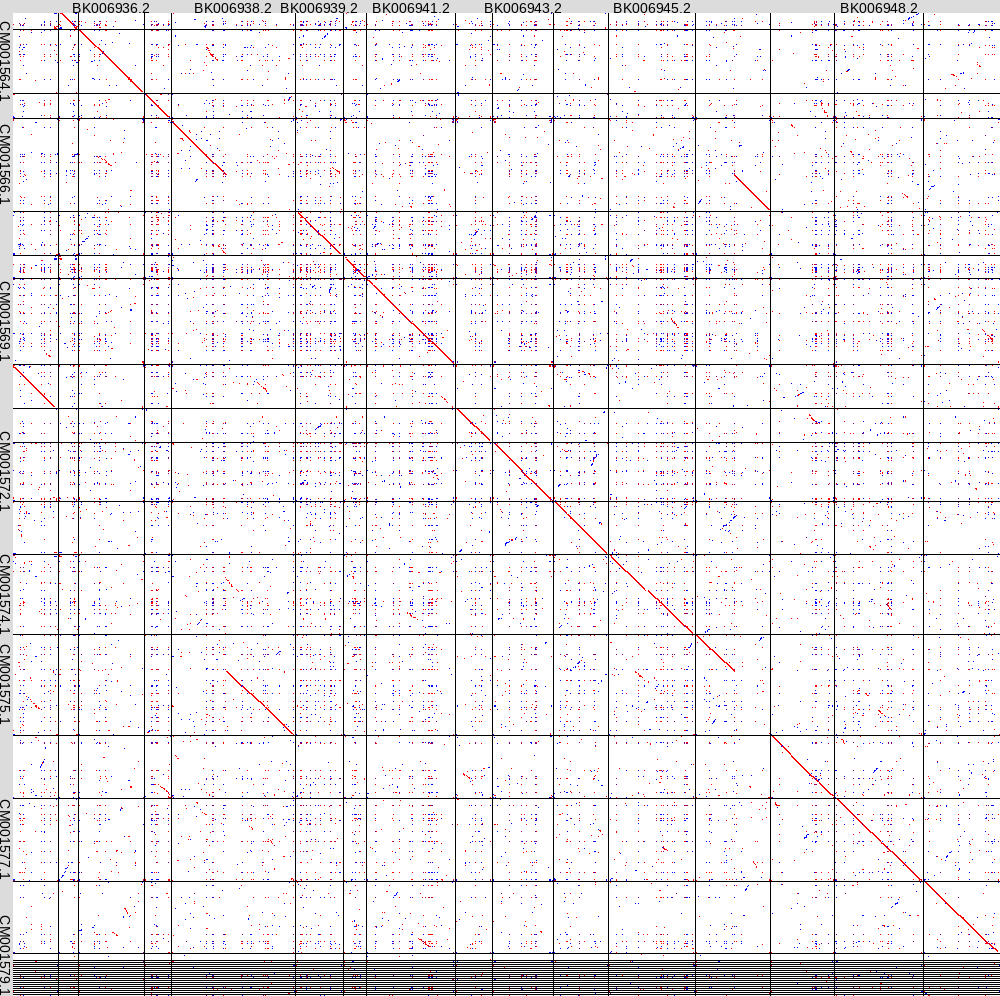
You can double-click on ScerSarb.png to view the output.
The X-axis sequence at top is the S. cer. genome, and the
Y-axis at the left is S. arb. There are several points to
note:
Each chromosome in
each genome appears in the order in which they are found in
the input file eg. for S. cer, they are in the roman numeral
order I - XVIII plus mitochondrial at the end. Not all
sequence names were able to fit in the output. However, you
will see thin grey lines in the matrix plot that delineate the
extents of each chromosome. For publication purposes, one
could edit the genome files to say something like ScerI,
ScerII etc, rather than the Accession numbers. With the
default output, unfortunately, if you want to know which
chromosome you are looking at, you need to count from left to
right or top to bottom.
Diagonals
representing matches between two chromosomes on the forward
strand go top left to bottom right, and are colored red.
Diagonals representing matches between two chromosomes on the
reverse strands go bottom left to top right, and are shown in
blue.
The plot tells us
several things of importance:
The two genomes are substantially colinear, as indicated by
the fact that the main diagonal spans all chromosomes.
A reciprocal translocation between Chromosomes IV and XIII is
indicated by offset diagonals and gaps in the main diagonal.
It is important to keep
in mind that the scale of the plots is at an extremely low
level of resolution in order to view 12 Mb in a single
image. What seem like minor diagonals in the plot actually
span thousands of base pairs.