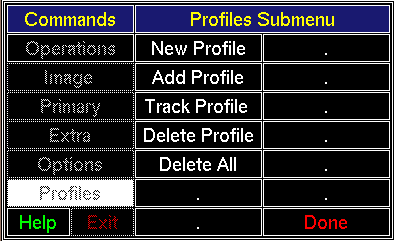
The options of the Profiles Submenu allow one to view vertical profile intensity graphs for the primary image and any extra images. To open the Profiles Submenu, click [Profiles] in the Commands Menu. The Profiles Submenu will be displayed as in Figure 4.7.

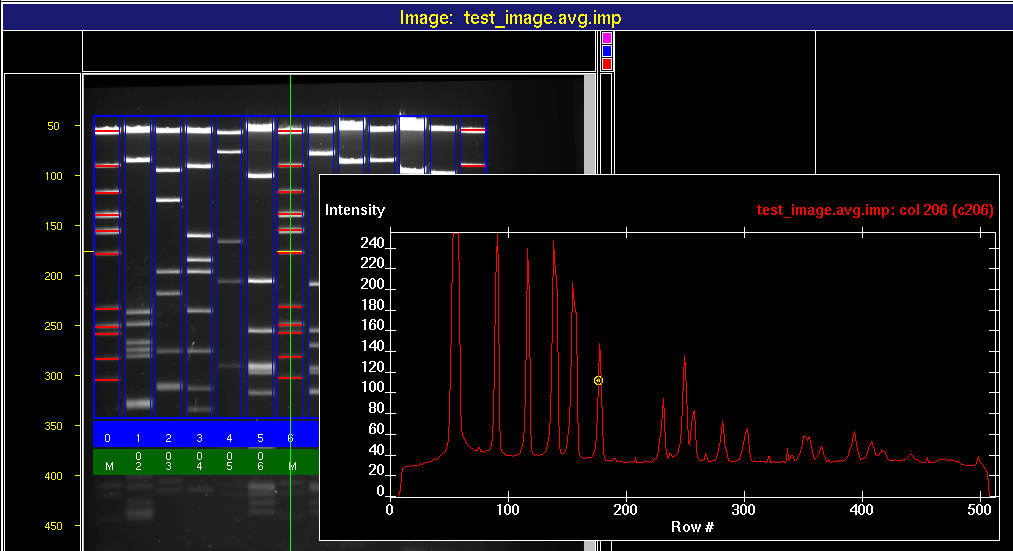
Figure 4.8 shows image k102 with a single vertical profile line and superimposed "Vertical Profile Graph". This Figure will be referenced in the subsections which follow.

Clicking [New Profile] allows you to get a one-dimensional vertical profile anywhere in the primary image or any extra image (although there are slight differences). Move the pointer into the primary image, then depress and hold MB1; a vertical line appears in the image. As long as MB1 is depressed, the vertical line can be moved from side-to-side. When MB1 is released, the line is fixed. In Figure 4.8, a vertical line has been placed at column 152 of the image; the vertical line stretches from top to bottom. The line is black in the Figure but green on the screen. When MB1 is released, a graph of intensity values versus row numbers appears in the lower-right hand corner. In the Figure, the Vertical Profile Graph has been superimposed over the image. You may continue to add profiles without re-clicking [New Profile] . A subsequent depress of MB1 in the image will create a new vertical line and a new Vertical Profile Graph. While the vertical lines will all be visible, a new graph is placed over previous ones, as in a stack of paper. However, the graphs can be moved around using the Move option in the Extra Image Submenu. A graph may also be resized using the Resize option in the Extra Image Submenu. For profiles in extra images, only the green profile line and temporary profile graph are shown.
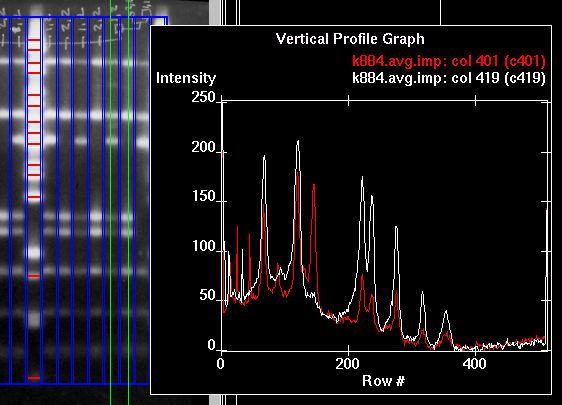
Clicking [Add Profile] is ineffective until a profile exists. To display two profiles in the same Vertical Profile Graph (after the New Profile option has been selected), click [Add Profile] and then depress MB1 in the image. Subsequent depression of MB1 in the image continues to superimpose profile data graphs on the original. Superimposed plots alternate in three different colors which can be modified by editing the applications-default resource file. Added profiles need not all come from the primary image; they may come from extra images as well. In Figure 4.9, two profiles are superimposed.

This option applies only to the primary image and only when lane boundaries have been detected and displayed. If the last new profile is in a lane of the primary image, click [Track Profile] , then move the pointer to the last Vertical Profile Graph established from the primary image. Depress MB1 in the Vertical Profile Graph. Keep MB1 depressed and move the pointer back and forth in a horizontal direction. While so doing, the program plots a small double circle which will track along the data in the Vertical Profile Graph and give the appearance of a bouncing ball. In Figure 4.8, the circle can be seen atop the second major peak from the left. At the same time, a horizontal line moves up and down in the lane corresponding to the profile graph; in the Figure, a white line appears across Lane 5 just above the 150-pixel level. Also, a smaller horizontal line moves up and down to the left of the primary image next to the pixel-index axis to give an idea of the pixel location; in the Figure, a short black line appears just above and to the right of the 150-pixel tic mark. The bouncing ball and horizontal lines are intended to visually coordinate the position in the Vertical Profile Graph with the position in the primary image. When MB1 is released, the tracking circles and horizontal lines in the image disappear. They reappear when MB1 is depressed again.
To remove a profile, click [Delete Profile] , then move the pointer into the Vertical Profile Graph which is to be removed. Click MB1; the graph and vertical line on the image will disappear.
To remove all profiles, click [Delete All] .
Click [Done] to close the Profiles Submenu and reactivate the Commands Menu. Any displayed profiles remain.
Backward to Chapter 4, section 4.4