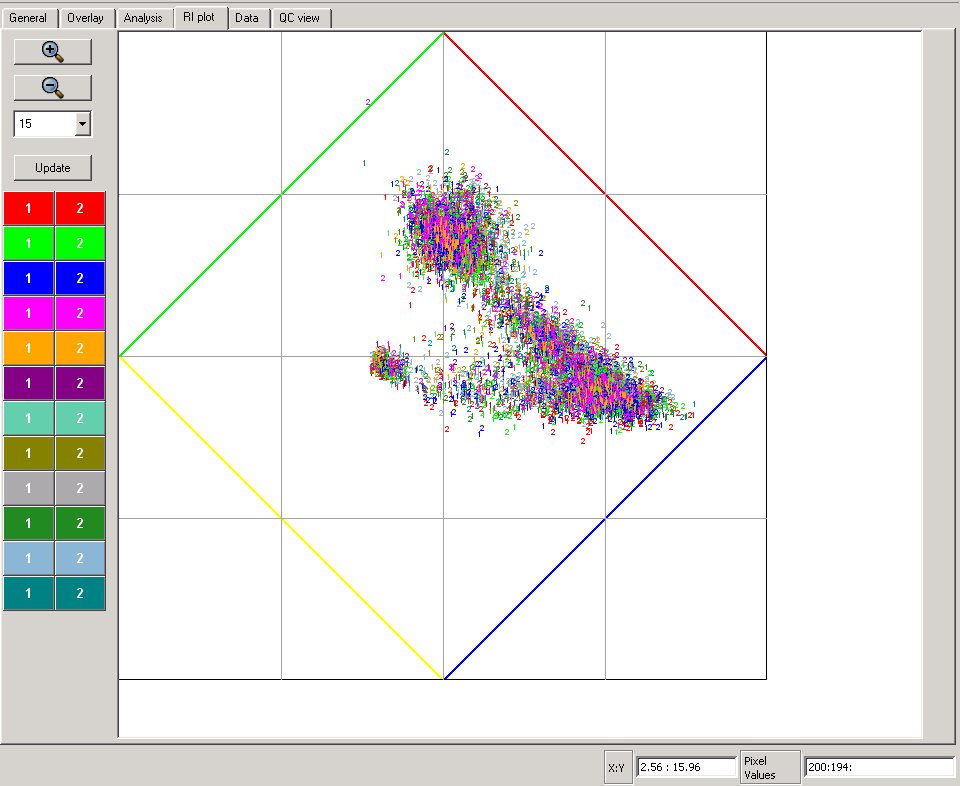
RI Plot Page is a home of an interactive RI plot view of plot Log2(A/B) vs. Log2(A*B), where A and B are the background corrected medians for channels A and B respectively. Every spot/gene is presented by a colored number on RI plot view. Color represents metarow, and number represents metacolumn. User can zoom RI plot view in and out, as well as scroll it, and change symbol size and visibility for every grid individually. Interactivity is implemented as ability for user to click on selected spot/gene and automatically swicth to the Data page where the same selected spot/gene highlighted in the MEV table.
Note: Because of the interactive functionality RI plot view can be very slow when redrawing and updating itself with large data sets (hight density slides).
User can disable RI plot view from Program Settings to improve program performance and responsivness in interactive mode.
The yellow, red, blue, and green lines on RI plot view are the limits of log-ratios desribed in [4].
The meaning of these limit lines is that the data points corresponding to the real spots cannot be shown outside of the diamond.
Any data points shown outside the diamond lines is result of some errors in the procedure.
It is most likely to be the incorrect background correction as result of the wrong spot boundaries detection.
For this reason the RI plot view can be used as quick visual quality control of spotfinding procedure.
 Zoom In and
  Zoom Out buttons can be used for zooming image in and out.
 This combo box is a Symbol Size Selector.
It allows user to set the symbol size (digits) showing the spots/genes on RI plot view.
Default value is 2, which is good for detailed view at high zoom values.
This combo box is a Symbol Size Selector.
It allows user to set the symbol size (digits) showing the spots/genes on RI plot view.
Default value is 2, which is good for detailed view at high zoom values.
 The push button Update forces to redraw the whole RI plot view.
It should be used to update the changes made in symbol size or/and Grid Selector.
The push button Update forces to redraw the whole RI plot view.
It should be used to update the changes made in symbol size or/and Grid Selector.
|
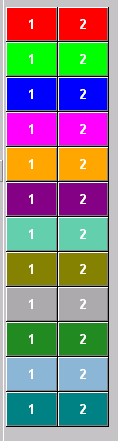
The Grid Selector is a set of the colored buttons arranged in the same way as the grids on a slide. Every button corresponds to one grid of slide. Geometry of Grid Selector is defined at the time of grid loading from file or grid creation from dialog. See Grid Menu for details of this. The color buttons are labeled by numbers rising from left to the right. The numbers are the indices of metacolumns. The buttons in one row are colored in the same color and denotes one metarow. User can turn on and off the drawing of the spots/genes on RI plot view for any grid by pushing the corresponding button on Grid Selector. The pushed (shaded) button stands for grid set no to be painted on RI plot view, while normal button stands for painted grid. For instance, red symbol 1 is used for drawing on RI plot view all genes/spot of the grid in first metacolumn and first metarow. A number of symbols 1 will be visible on RI plot view when red button labeled by number one is at normal. Similarly, when the same button is pushed down non of red ones ( 1 ) is shown on the RI plot view. |
 The X:Y indicator on status bar shows the RI pot coordinates when RI plot is visible.
The cordinates are shown in log2 scale, as result the whole plot area has limits from 0 to 32 in X coordinate and from -16 to 16 in Y coordinate.
The X:Y indicator on status bar shows the RI pot coordinates when RI plot is visible.
The cordinates are shown in log2 scale, as result the whole plot area has limits from 0 to 32 in X coordinate and from -16 to 16 in Y coordinate.