BIRCH

return to tutorials

TUTORIAL: Comparing genomes using Mauve


Nov. 22, 2023


References:

Mauve Web Site

This tutorial continues from the previous tutorial Comparing genomes using dotplots.
Note: The current version of Mauve (2015-12-13) requires Java8. On some systems Java11 is the default. If Mauve fails to launch you may need to install OpenJDK8 on your system.


Rationale: It's pointless to do sophisticated analysis and generate large quantities of output if we can't make sense of the results. One of the big challenges in bioinformatics is presenting big data in such a way that we can explore it and understand it.  As in the previous tutorial, we will compare S. cereviseae and S. arboricola, this time using a Mauve, a genome comparison tool.

Localized Co-linear Blocks (LCB) - The key concept underlying Mauve is that as genomes diverge from an ancestral species into two or more modern species, chromosomes undergo many sorts of rearrangements, including insertions, deletions, inversions and translocations. Much of the same sequences remain even after long periods of evolutionary history, but in different arrangements from one species to the next. In Mauve, Localized Co-Linear Blocks are regions of chromosomes that appear to be conserved across all species being examined. If an entire chromosome is unchanged, then the entire chromosome would be a single LCB in all species in the alignment. Many chromosomes will be a mosiac of several LCBs. In other cases, an LCB on one chromosome will be found on a different chromosome, indicating a translocation. The purpose of Mauve, then is to calculate the LCBs shared between two or more genomes, and to display them visually.

Goal: To gain a more in-depth understanding of the chromosomal changes occurring since the divergence of S. cereviseae and S. arboricola.


0. Univ. of Manitoba CCL system only: Log into HPC node.

Multiple genome alignment is a highly memory-intensive task. For this reason, we want to avoid adding load to the login hosts (eg. mars, venus, jupiter, neptune) and instead run mauve on one of the cc machines as described in Using High Performance Compute Nodes . Open a new terminal window and type:

sshcc
login to a compute node. sshcc will automatically choose a machine with the lowest load average.
You should see the command prompt change to indicate which machine you are logged into (eg. cc07). Keep in mind that while this terminal window is now on a cc node, the rest of your desktop is still running on the original login host.
cd tutorials/getgenome When you login to a new machine using ssh, you start out in your $HOME directory. Therefore, we need to go to the getgenome directory to work in that directory.

1. Comparison of S. cereviseae and S. arboricola genomes

Mauve is an interactive genome viewer specialized for identifying syntenic regions between two or more genomes. It can be launched by typing

mauve

To produce a Mauve alignment, go to the File menu and run Align with progressive Mauve.

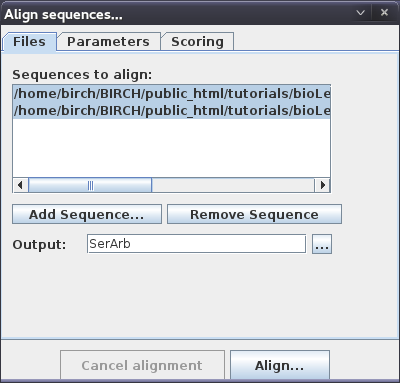
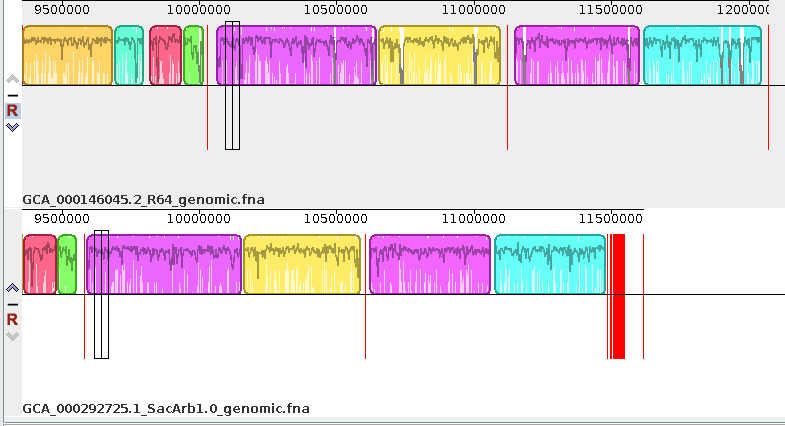
You can add as many genomes as you wish in the Align sequences window. For now, read in

GCA_000146045.2_R64_genomic.fna
GCA_000292725.1_SacArb1.0_genomic.fna

We'll use the Output name "SerArb" for this comparison.


Click the Align button to begin the alignment.
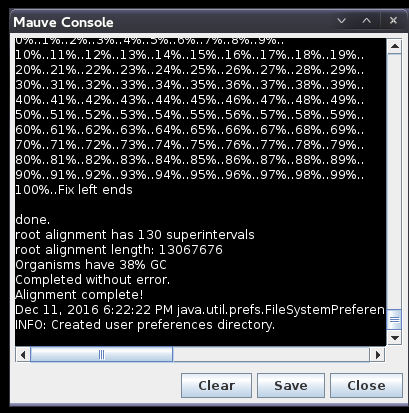
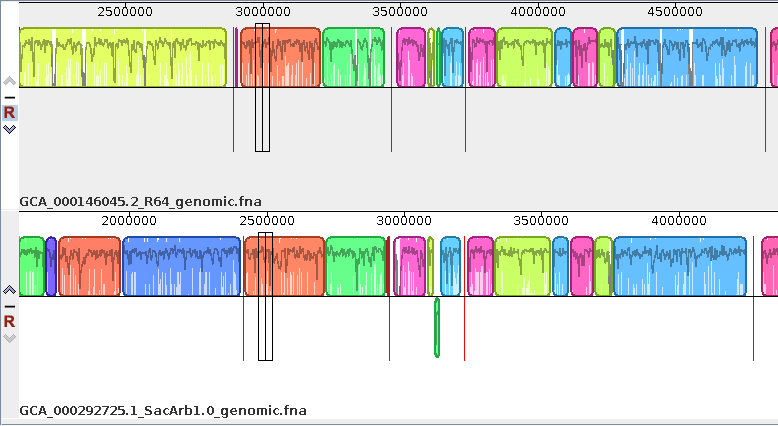
 
Progress of the alignment is shown in a popup window. This alignment will probably take several minutes.

The window will indicate "Done" when the alignment is complete. After a slight delay, the alignment will appear in a new Mauve window.


To make it easier to see the distinct LCBs conserved between the two species, choose View --> Style --> LCB outlines. In this example, Mauve read the S. arb. genome first, so that was set as the reference genome. Since S. cer. is the best characterized yeast, move the S. cer. to the top of the alignment by clicking on the up arrow (^) next to the GCF_000146045.2_R64 sequence. The alignment should now look like this:


A quick guide to the Mauve viewer

Try the following: 1. Press the Zoom (+) button and pan all the way to the right. Repeat this two more times.  You should see something like this:


The cluster of parallel red lines indicate the Unaligned Scaffolds, all of which are fairly short. The last pair of red lines denotes the mitochondrial genomes of Ser and Arb. You can see that there have been a number of rearranged LCBs since the divergence of these mitochondrial genomes. Most of the Ser mito. genome is on the reverse strand, relative to the Arb mito genome, although some LCBs in Ser are on the forward strand, relative to Arb.The last pair of red lines on the lower (S. arb.) genome denotes the mitochondrial genomes. It is completely white because the S. cer. reference genome doesn't include the mitochondrial sequence, so there is no LCB for S. cer.

Scroll left to around 3000000. (You may also need to zoom in.)


The bottom sequence (Sarb) has a blue LCB below the other LCBs. In Scer (top) the dark green LCB is on the top line.The lower line indicates LCBs on the opposite strand, relative to the reference strand. Put another way, this dark green LCB represents an internal inversion in this chromosome, since the divergence of S. cer. from S. arb. Without further information, there is no way to know which is the original and which is the inversion.


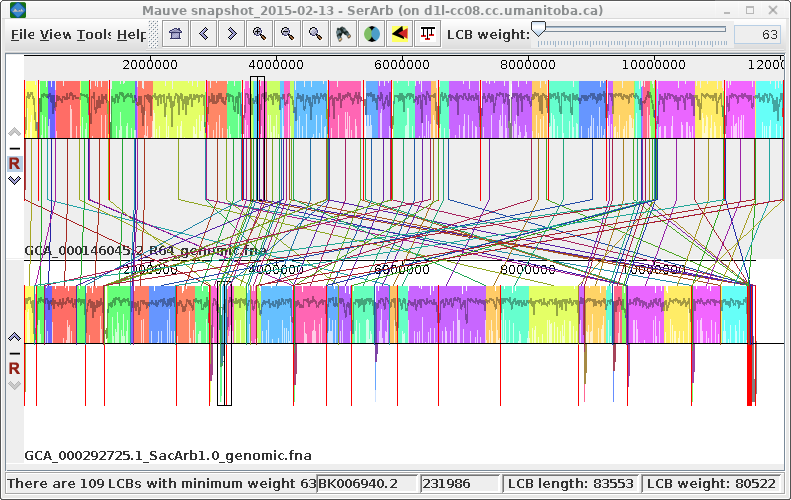
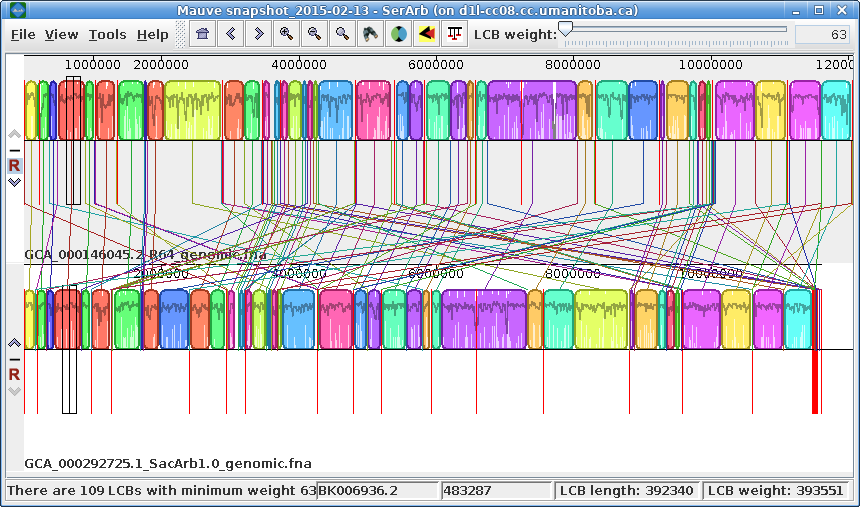
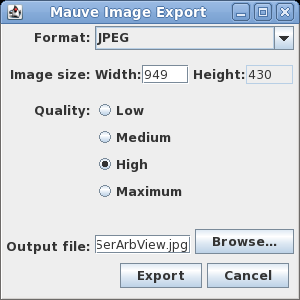
Exporting images - You can export the current view of the alignment to an image file by choosing Tools --> Export Image.

In the example at right, the default format is JPEG, and the image is saved to a file called SerArbView.jpg.


Resuming a Mauve session - When creating the alignment, Mauve saves all files related to the alignment in the current working directory. In the example, we ran Mauve with the Output name 'SerArb'. All files will begin with SerArb as the basename eg. SerArb.guide_tree. You can quit Mauve and resume your session by choosing File --> Open Alignment. Click on the file named SerArb (with no extension) and the alignment files will be read back into Mauve.