BIRCH
Workflow example: Analysis of
population structure for green foxtail in Manitoba
Green Foxtail is a weed that
grows widely throughout Manitoba. To find out whether the plants
sampled across the province represent a single interbreeding
population, of several distinct subpopulations, RAPD markers were
screened in 12 Manitoba populations, plus the Chinese accession 439-86.
This tutorial describes a simple workflow that uses parsimony analysis
of these markers to assess population structure.
Start blmarker by typing
blmarker
The first step is to read in Phylip-formatted marker file.
Save the file manitoba.phyl in
your
current working directory. In blmarker, choose File --> Import Phylip
Discrete Data,
and type in the name manitoba.phyl.
The markers will be read into blmarker. Next, select all markers and
choose Phylogeny -->
RFLP/RAPD/AFLP etc.
Parsimony.
Set a random number seed for jumbling the order in which foxtail
accessions are added to the tree, and click on Run. Output will be sent
to several windows:
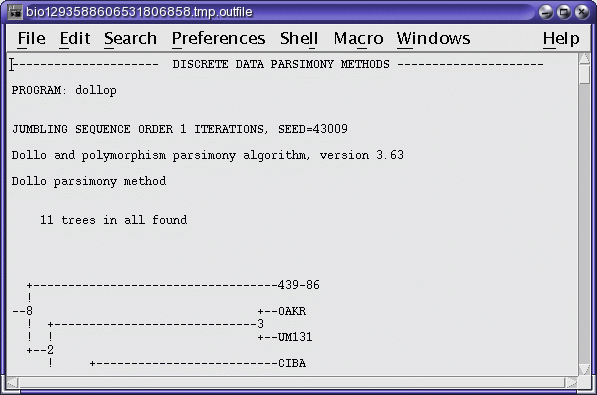
DOLLOP report in a text edit window (dollop_report.txt)
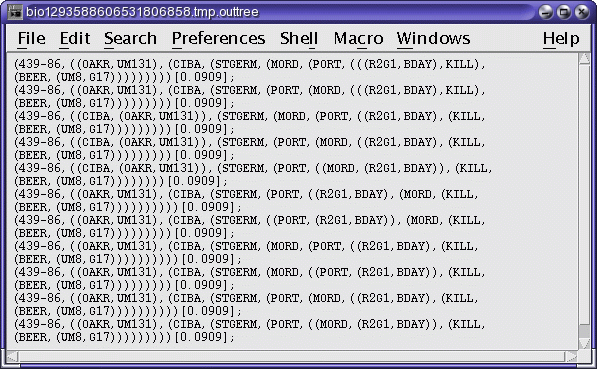
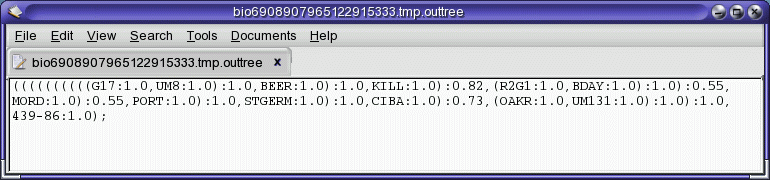
Phylip-formatted trees in a text edit window (dollop_trees.treefile)
Phylogenetic trees in a bltree window
You will note that this search produced 11 equally-parsimonious trees.
(The number of parsimonous trees can vary greatly depending on the
input order of accessions. It is usually best to jumble the order
several times, rather than once, as shown in this example).
The next step is to create a consensus tree from these 11 trees. In the
bltree window, select all trees, and choose Evaluate --> Consense.
No defaults need to be changed, so click on Run. Output will be sent to
several windows.
Consense report (consense_report.txt)

The consensus tree (consense.treefile)
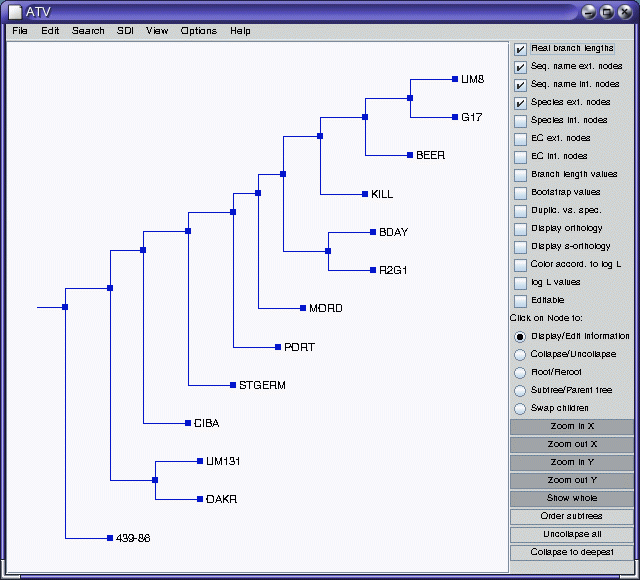
Consensus tree in the ATV tree editor
Consensus tree in bltree
It is sometimes also instructive to view the tree in other types of
displays. The Phylip Drawgram program provides draws phenograms. In
the bltree window, select the consensus tree and choose Draw --> Drawgram.
Click on OK to launch the program. By default, output will go to a
PostScript viewer.
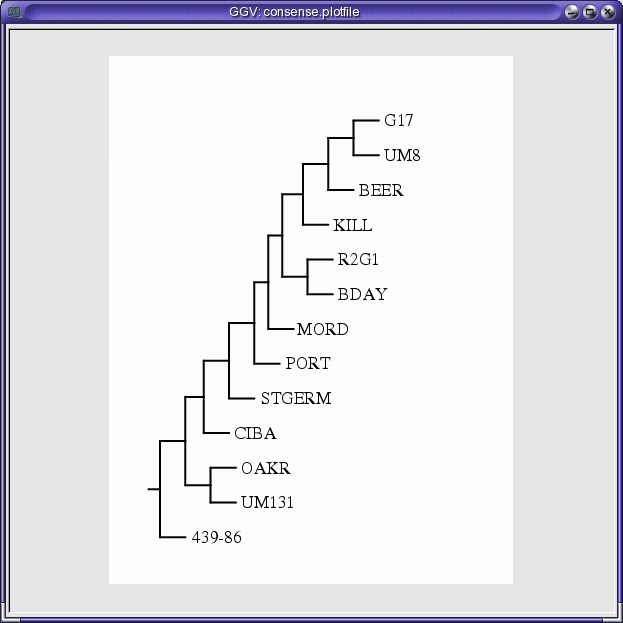
The results presented here are not by themselves compelling. Four of
the populations (UM8, BDAY, G17 and R2G1) seem to cluster together,
while no othe obvious clusters are apparent. As expected, the Chinese
accession 439-86 does indeed behave as an outgroup. It would be best to
re-do the analysis using bootstrapping to see how robust these groups
are.