TUTORIAL: CHARACTER PHYLOGENY METHODS Parsimony
and Maximum Likelihood
|
June 24, 2021 |
TUTORIAL: CHARACTER PHYLOGENY METHODS Parsimony
and Maximum Likelihood
|
June 24, 2021 |
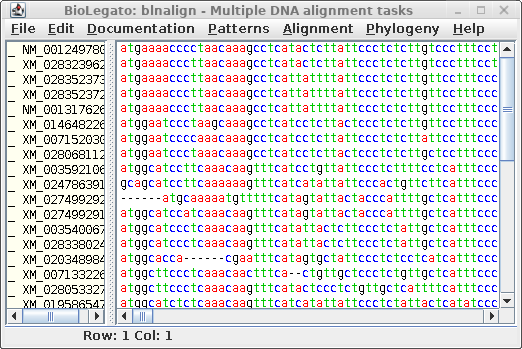
| This tutorial continues from the previous tutorial Phylogenetic
Analysis Using Distance Methods. It begins with
multiply aligned protein and DNA sequences for plant type
III chitinases. To eliminate gappy positions, the
alignments were processed by Gblocks. The starting point
for this tutorial is the Gblocks output alignments. |
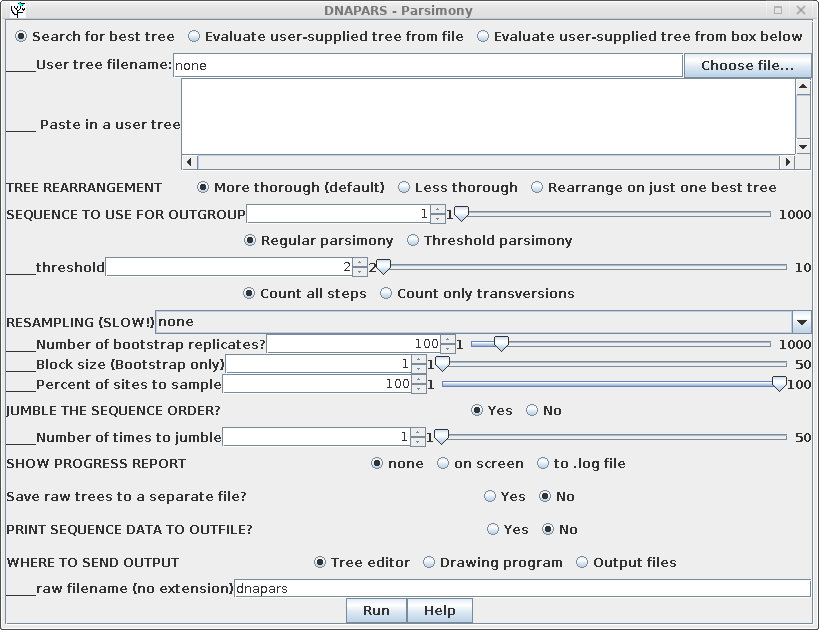
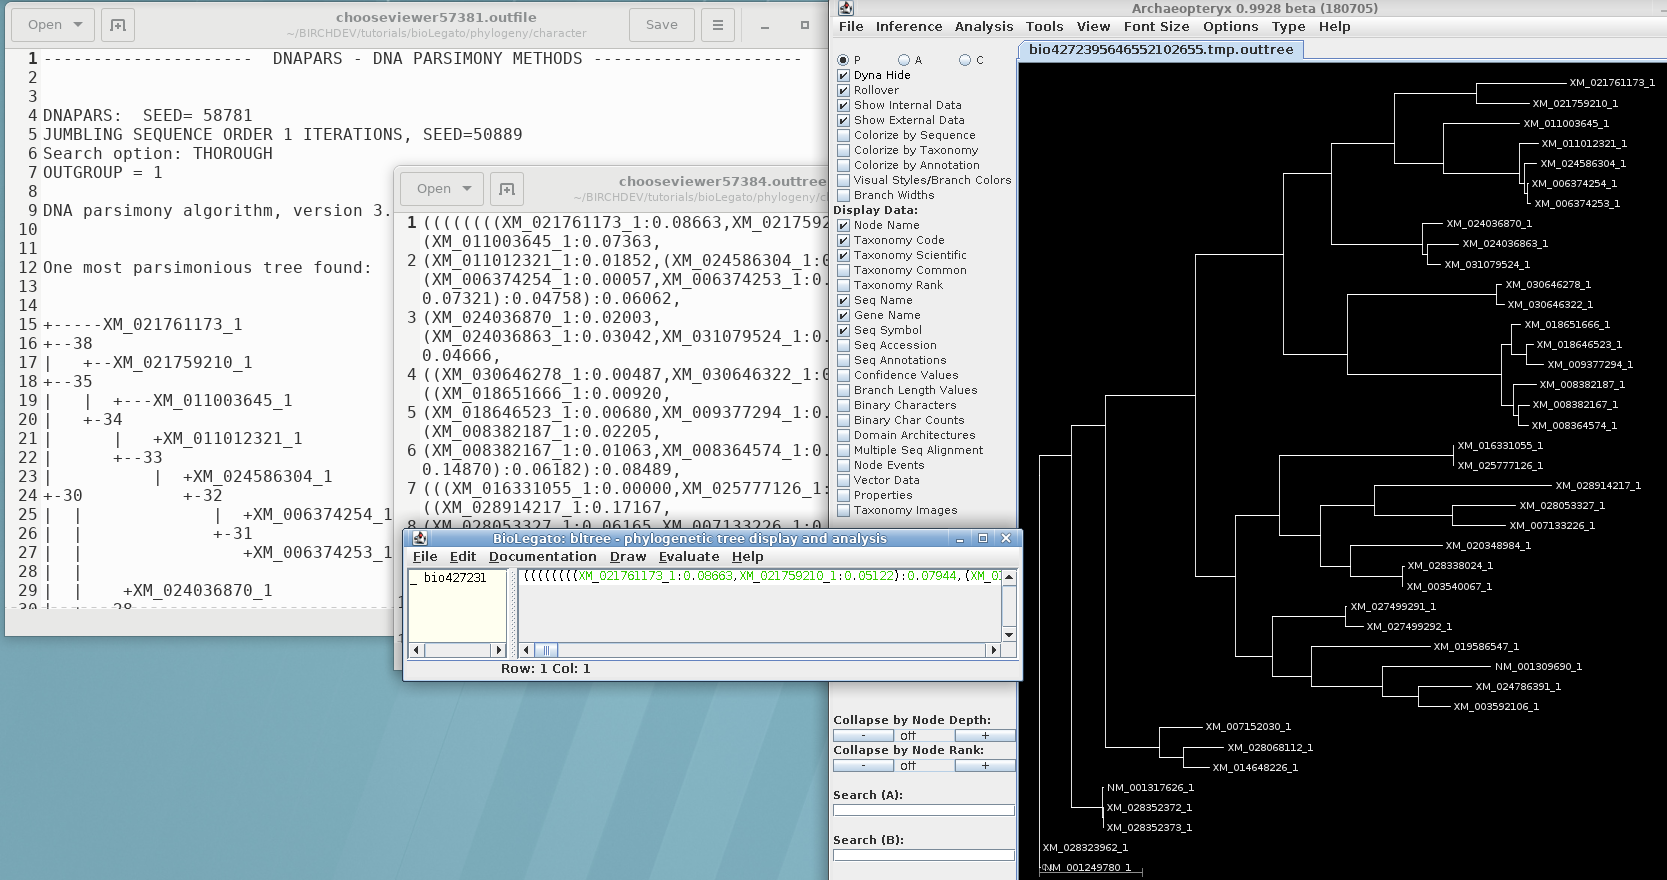
Parsimony methods set out to build a tree by successively adding sequences to the tree, until all sequences have been added. Unlike distance methods, which tend towards a single answer, the tree you get could be strongly influenced by the order in which branches are added.
To randomize the order of sequence addition, choose 'Yes' in the
Jumble area of the DNAPARS menu. BioLegato will automatically set
a random number seed to create a list of random numbers used for
jumbling. Usually only a few jumbles are needed to uncover most of
the alternate trees. In the example, the search is repeated 5
times with a random order of sequences.

Three equally parsimonious trees are produced, as shown in
bltree:
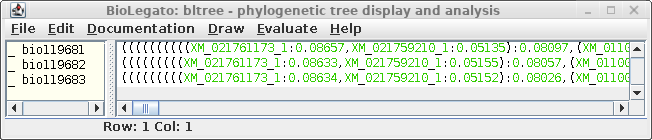
| An example shows 1 subtree from the complete
tree for each of the three resultant trees. One subtree that is mostly conserved between the three trees illustrates the differences, solely due to redoing the analysis by adding the sequences to the tree in different orders. For example, In A and C, the subbranch containing sequences whose names end in 8984, 3327,3226, 8024, and 0067 are conserved. Comparing B and C, both have an additional sequence ending in 6547, in B as an outgroup, and in C as an internal node. |
A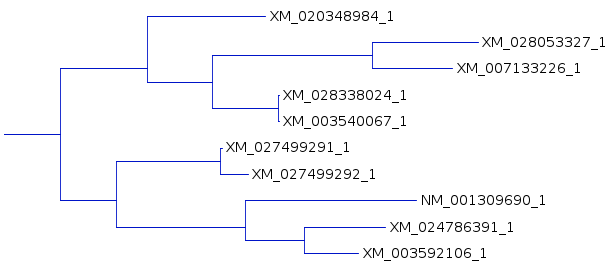 |
B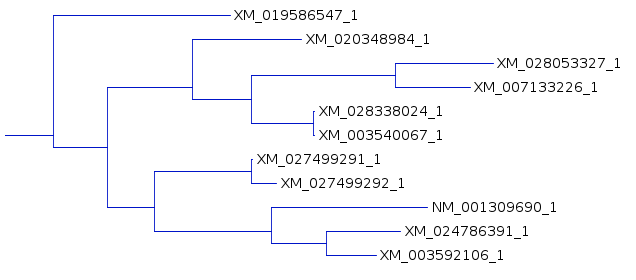 |
C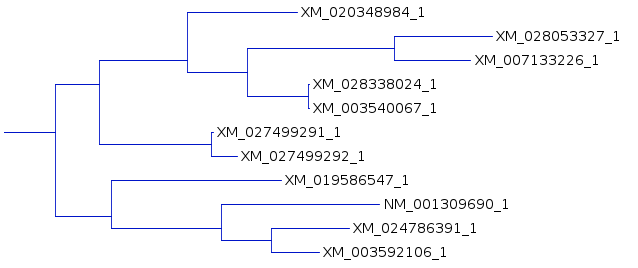 |
There are other differences when the larger tree is considered,
but this example serves to demonstrate that parsimony is sensitive
to the order in which sequences are added. For this reason,
jumbling should always be done in when using either parsimony or
maximum likelihood.
The other thing to take not of in the output report is the time
elapsed:
Elapsed time on cc14.cc.umanitoba.ca:
8.55016589165 seconds.
This will be important in the next section.
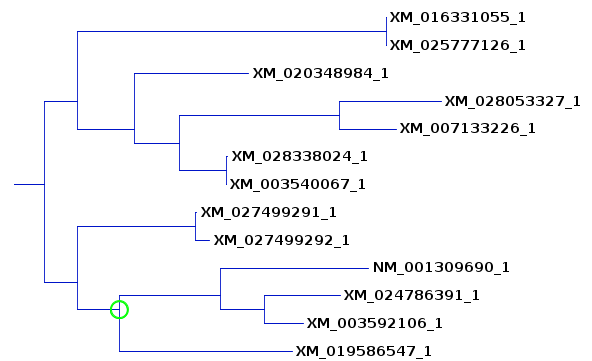
| This tree compares well with the previous
ones, although in order to include 8984 we also had to
include another clade, 1055 and 7126. As we will see
later from bootstrap replication, this is because many of
the internal branches are not as reproducible as the more
terminal branches. |
 |
| WARNING
Maximum likelihood methods are very slow, because they attempt to consider an enormous number of possible trees. The time required increases exponentially with the number of sequences. Therefore doubling the number of sequences does not double the execution time. In fact for DNAML, the time required increases roughly with the 4th power of the number of the sequences! For most practical purposes, direct tree construction with greater than 30 sequences requires prohibitive amounts of time. Since bootstrapping multiplies the time required often by
a factor of 100 or more, we usually don't have the luxury
of bootstrapping with maximum likelihood methods. However,
as illustrated above, we can bootstrap with a less time
consuming method such as parsimony, and then build the
final tree with Maximum Likelihood. |
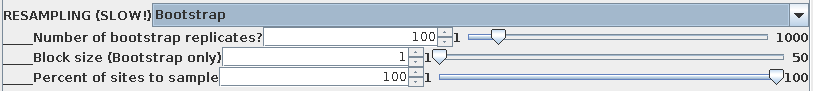
By default, 100 bootstrap replicate datasets will be created,
each containing positions sampled at random from the sequence
alignment . In each set, some positions will be overrepresented,
and others underrepresented. A large enough set of replicates
should ensure that all parts of the sequence are equally biased
among the replicates as a whole. If the original tree was simply
due to a fortuitous circumstance that a few positions tipped the
balance between one topology and another, different topologies
will appear as each replicate dataset is evaluated. If the data
are robust, meaning that a given branch appears regardless of
which sites are omitted from the sample, then that branch is
strongly supported by the data.
Since 100 bootstraps require 100 iterations of the tree building
process, the time required can be substantial when there are large
numbers of sequences. If 1 iteration took 8.55 sec., then 100
iterations will require about 855 seconds, or about 14 min. 15
sec. It is therefore a good practice to send output to files,
rather than to windows:
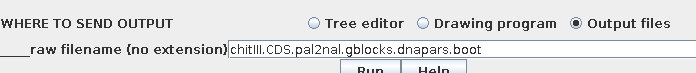
In this case two files will be created:
Report: chitIII.CDS.pal2nal.gblocks.dnapars.boot.outfileThe report tells us
Bootstrap replicate trees: chitIII.CDS.pal2nal.gblocks.dnapars.boot.alltrees.treefile
Consensus tree: chitIII.CDS.pal2nal.gblocks.dnapars.boot.treefile
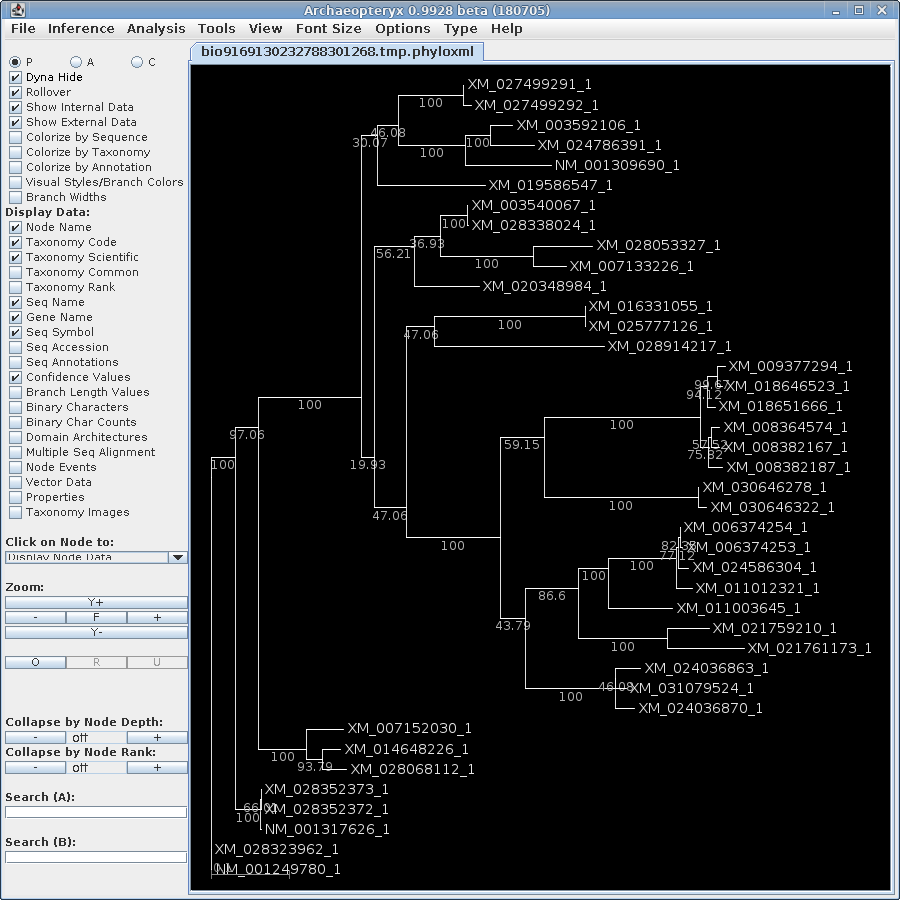
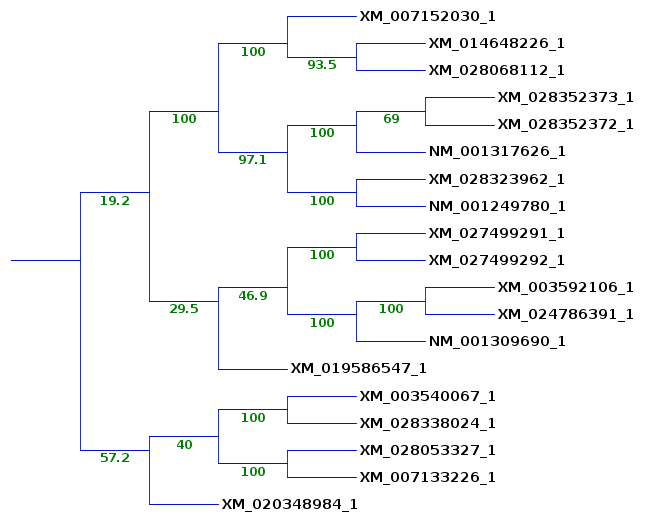
| The trees created during the 100 runs of
DNAPARS are combined into a consensus tree, showing the
number of times each branch occurred among 100 bootstrap
replicates. Note that branch lengths are arbitrary. This
tree ONLY gives us boostrap numbers telling how often a
group of sequences is found on the same clade. A larger subtree is shown to illustrate where sequences from the previous subtrees ended up. The 5 sequences on the lower clade are still found together, although the bootstrap value shows that these sequences cluster together only 57.2% of the time. (The bootstrap values are not always whole numbers because for each of 100 replicates we jumble 5 times, and may get several equally parsimonious trees with each jumble.) The remaining sequences from the original subtrees do cluster together 29.5% of the time. Since the deeper branches on this clade are 100%, it is likely that in other replicates, 6547 clusters on some other clade. This would be consistent with the fact that it was seen in 2 of the 3 previous subtrees. |
 |
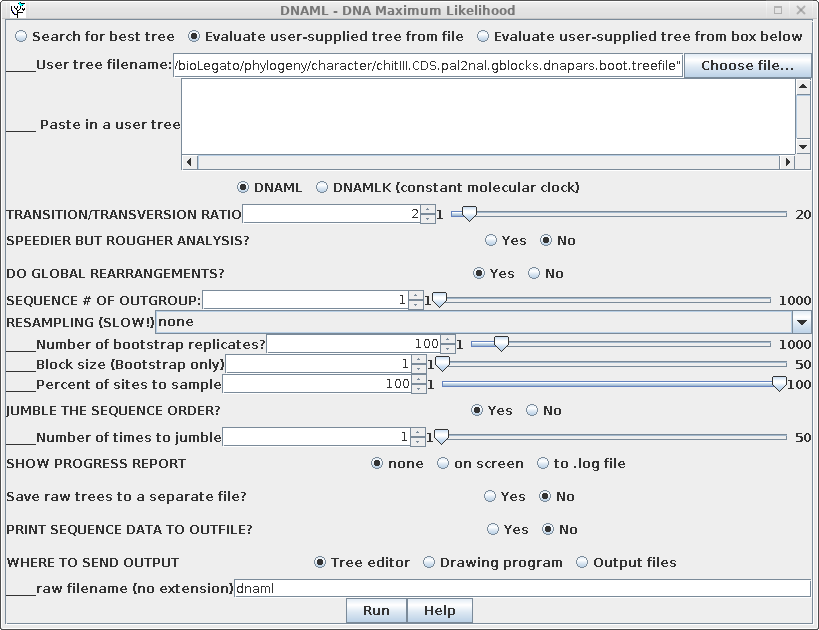
In this example, "Evaluate user-supplied tree" is chosen, and
"chitIII.CDS.pal2nal.gblocks.dnapars.boot.treefile" is chosen as
the treefile to use.Output is shown below:
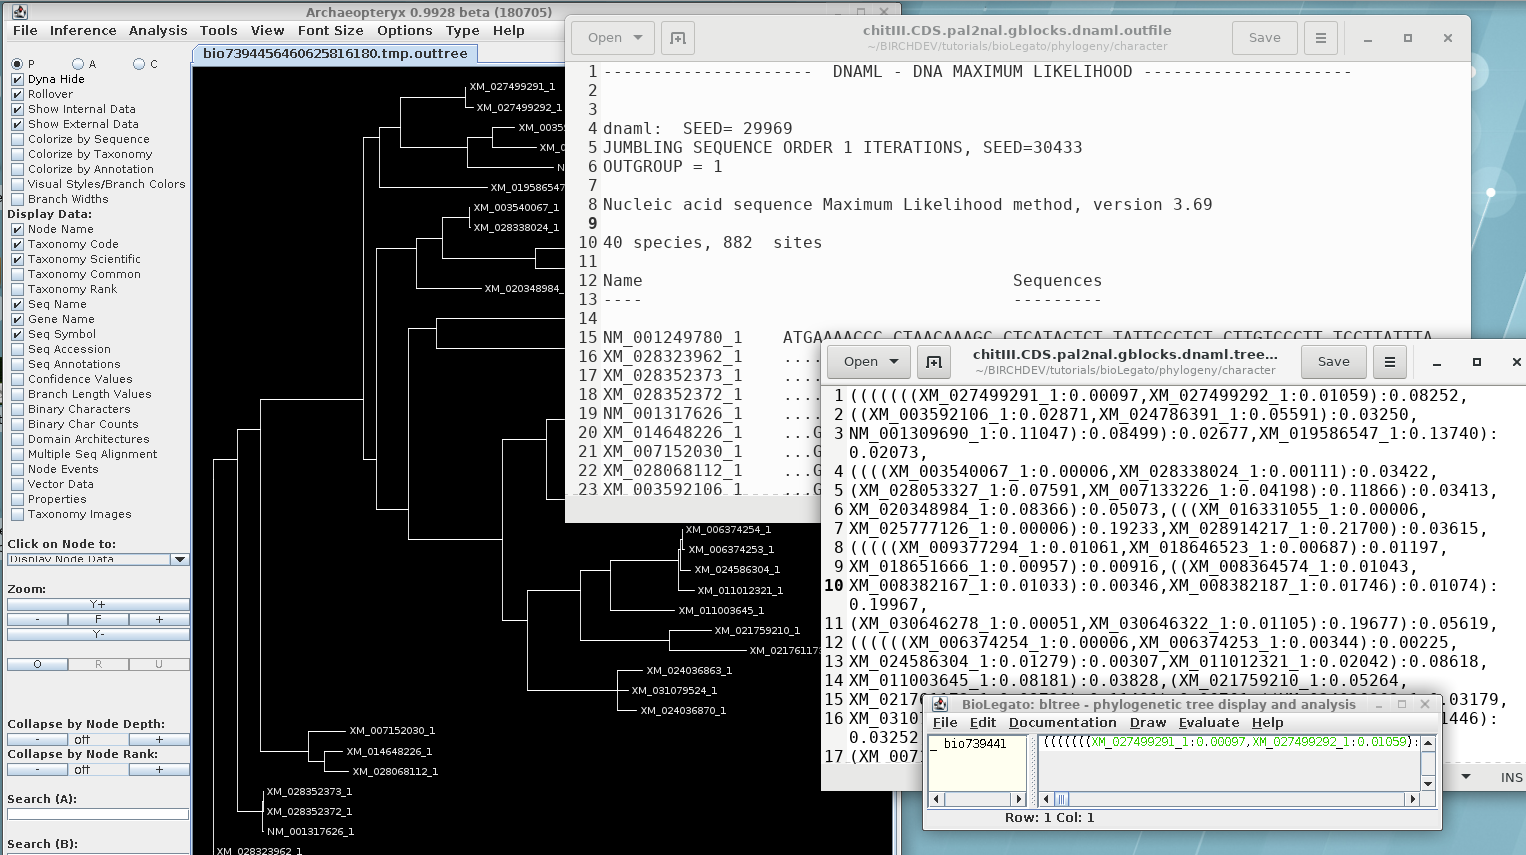
Report: chitIII.CDS.pal2nal.gblocks.dnaml.outfile
Consensus tree: chitIII.CDS.pal2nal.gblocks.dnaml.treefile
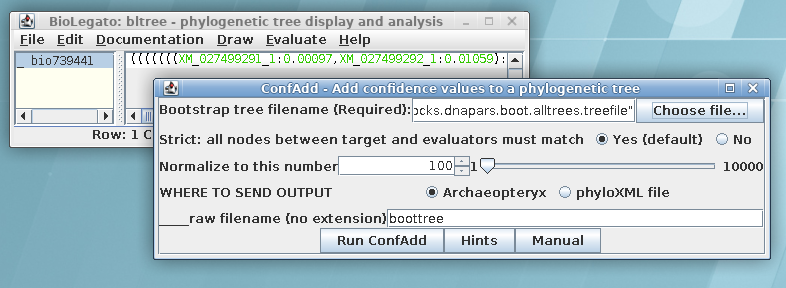
In order to visualize this tree with both branch lengths and
boostrap values, we need to create a phyloXML file from the
existing treefile. Select the maximum likelihood tree in bltree
and choose Draw --> ConfAdd. Set the Bootstrap tree
file name to
chitIII.CDS.pal2nal.gblocks.dnapars.boot.alltrees.treefile, which
we saved earlier. As shown, confadd will add the bootstrap values
to this tree and create a phyloXML file with the output. The
output will pop up in Archaeopteryx