Lecture 1, part 1 of 2
| PLNT4610/PLNT7690
Bioinformatics Lecture 1, part 1 of 2 |
1. What is Bioinformatics?
2. Much of the work of Bioinformatics is organizing raw data to create knowledge.
3. Knowledge is built by constructing relations between different kinds of data.
4. Public databases organize knowledge into models of things in the real world
5. The public databases are a laboratory for investigating scientific questions.
What I want you to get
out of this course, then, is not just a set of skills, but
rather a mindset. I want you to understand that the computer is
the ultimate general purpose tool, and I want you to have the
ability to use its capabilities in a creative way to attack
biological problems.
The terms
"bioinformatics" and "computational biology" mean a lot of
different things to a lot of people. There are no universally
accepted definitions for these terms. This may seem odd, until
you try to come up with definitions for terms such as "gene" or
"life". A very strict definition could actually be
counterproductive, missing many things that should be included.
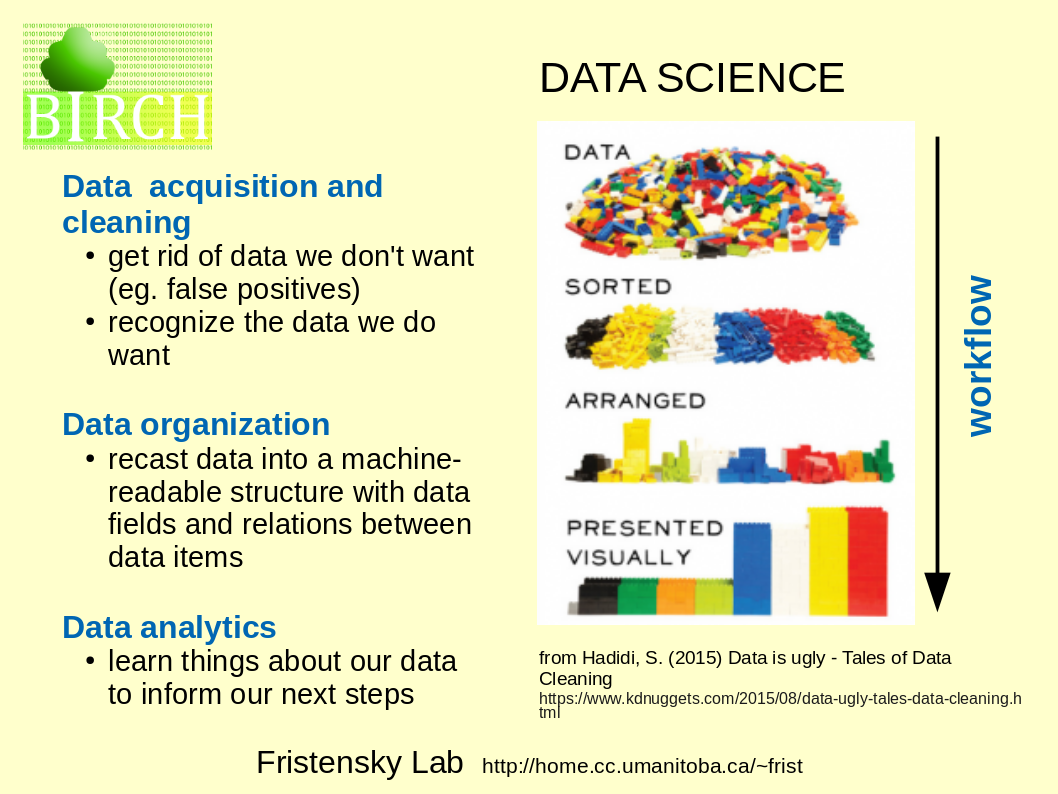
| The
term "Data Science encompasses all of the steps that we
might do in the process of discovery, starting with
acquisition of raw data, refining the dataset, and
analysis to learn things from our data. The series of steps to arrive at a goal is referred to as a workflow. |
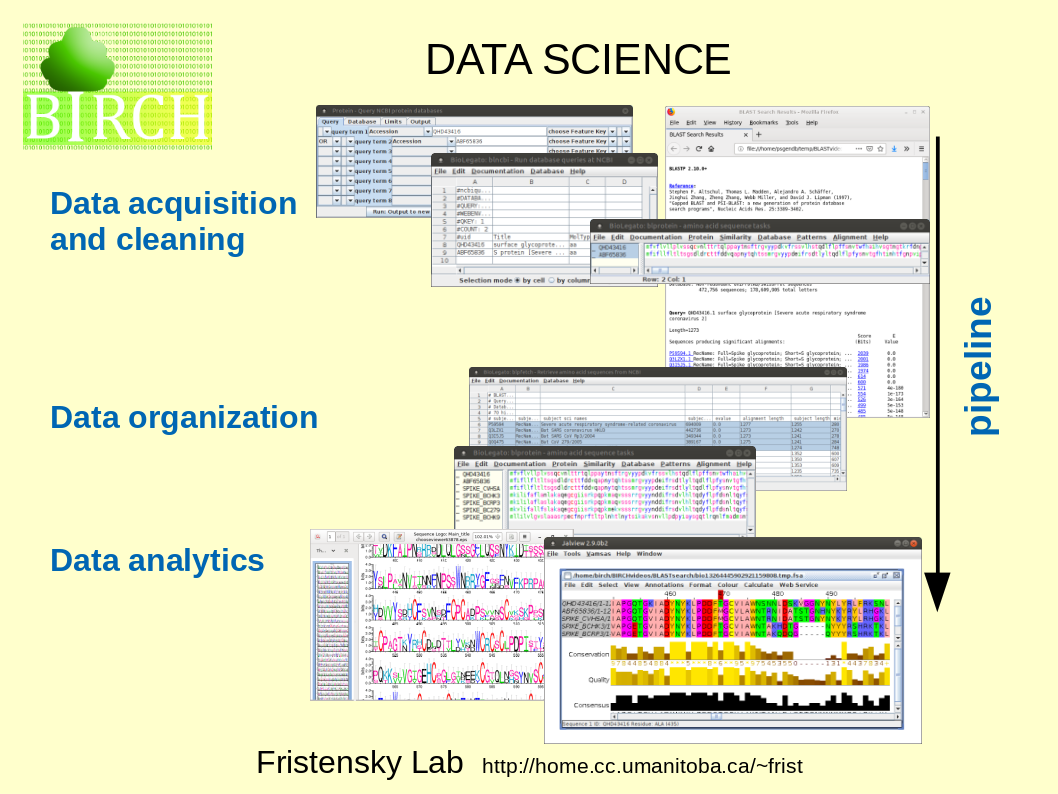
 |
Workflows can be implemented using a series of programs, each of which performs a single specific task. The chain of programs implementing a workflow is referred to as a data pipeline. |
 |
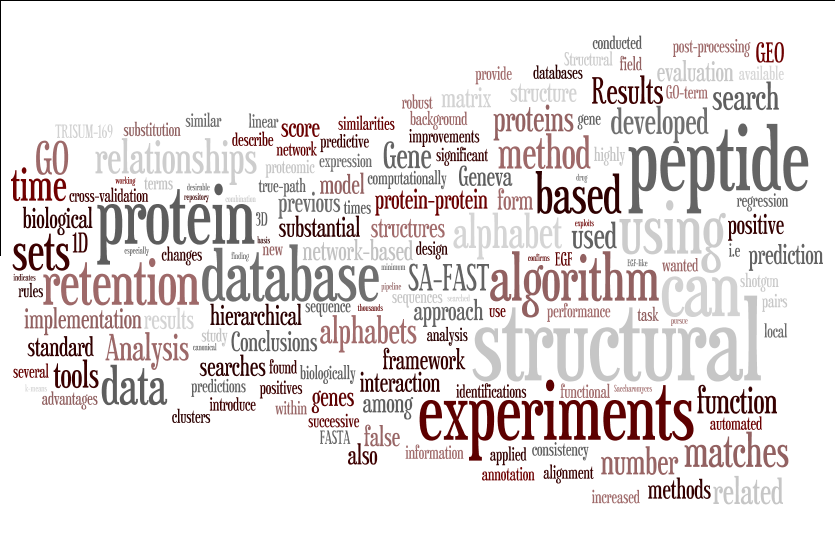
| Question: What conclusions can we
draw about this issue of BMC Bioinformatics? What
broader generalizations can we make about the field of
bioinformatics? |
| One
thing we take away from tag clouds is that visualization
can lead to important insights into information of any
type. This principle led to the development of Sequence
Logos by Tom Schneider and colleagues at the NCI. Sequence
logos use different colors and font sizes to represent the
frequency of nucleotides in a DNA sequence, or amino acids
in a protein. For example, the logo in the figure at right
shows the information content in bits, calculated from the
raw frequencies of nucleotides in sites bound by the
Lambda phage cI and cro proteins. At position 0, all four
nucleotides are found in near equal frequencies. Since
position 0 appears to have a random distribution of
nucleotides, its information content is very close to 0
bits. At position -7, all binding sites had an A,
indicating an extreme deviation from randomness.
Therefore, position -7 is said to have a very high
information content. (Sequence logos appear to predate the tag cloud concept.) figure from http://schneider.ncifcrf.gov/gallery/hawaii.fig1.gif Ref: Schneider TD, Stephens RM (1990) Sequence logos: a new way to display consensus sequences. Nucleic Acids Res. 18: 6097–6100. |
 |
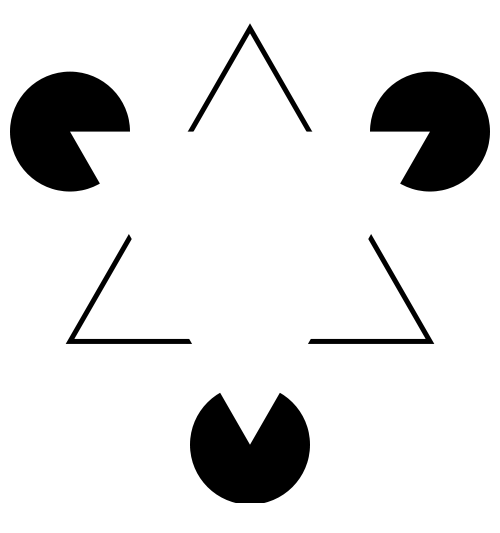
| The
human brain is superb at pattern recognition. We have an
innate tendency to impose order on raw or incomplete
information. "In the Kaniza illusion there appears to be a white triangle lying on top of a black-outlined one. But if you look closely, you'll see that there are no triangles in the figure. Our perceptual system completes or "fills in" information that isn't there". Levitin, DJ (2006) This is Your Brain on Music. Penguin Group, Canada. Image from http://en.wikipedia.org/wiki/Illusory_contours |
 |
| Part
of the goal of bioinformatics, therefore, is to discover
the relationships between different pieces of information
and assemble that information into a structure, or model,
that explains the data. Put another way, bioinformatics
creates knowledge from data. |
 |
| Or, another representation: | 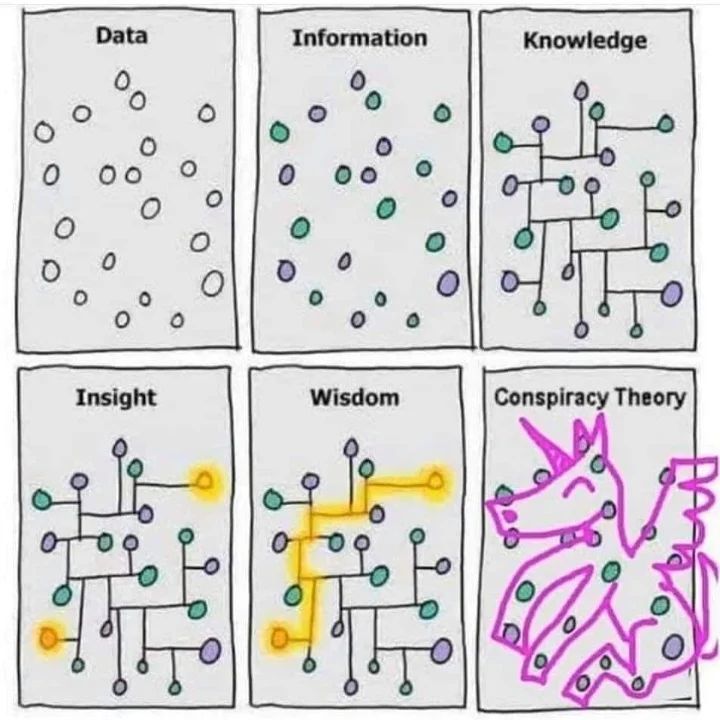 |
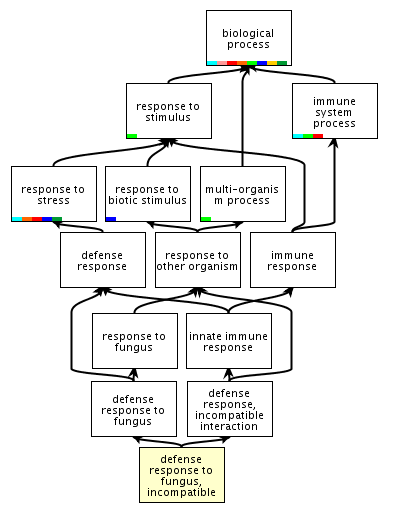
| One
way to organize biological concepts is through ontologies.
An ontology organizes concepts in a hierarchical
structure. For example the Amigo Gene Ontology database
classifies genes involved in plant incompatible
(resistant) defense responses to fungi as part of a
hierarchy whose root is "biological process". Link: http://amigo.geneontology.org/cgi-bin/amigo/term_details?term=GO:0009817&session_id=8221amigo1375399571 Ontologies express relationships between biological concepts in a way that is amenable to manipulation by computer programs. They codify ideas into a structure that matches as closely as possible the processes that occur in nature. |
 |
| The Duck and Penguin classes extend the bird class by adding different sets of Data and Methods, specific to either Duck or Penguin. (Note that "Bill" appears in both classes. If Bill was a characteristic of all possible birds, it would have been better to have added it to the Bird class. But birds like cardinals and chickadees have beaks, so to accommodate them, we don't add bill to the bird class.) | 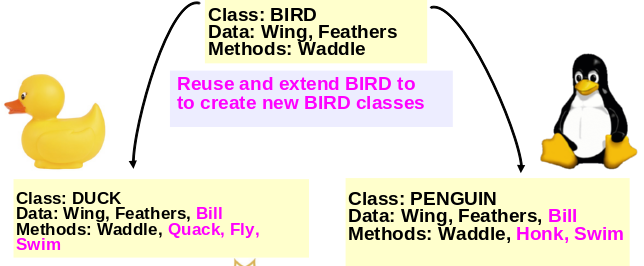 |
EXAMPLE: Pathogenesis-related protein PR10
in plants
The
PR10
family of proteins is found widely in dicotyledonous plants.
This gene is often activated by pathogens and in some species by
the hormone abcissic acid. It is constitutvely-expressed in the
roots of some plants, and has also been found isolated as a
pollen allergen in several tree species. Because of the range of
biological contexts in which this protein has been found it has
been called by a variety of names, such as PR10, Betvi, PR1,
SAM, RH2 etc. In peas, it has been shown to have
ribonuclease activity. Workers in one area might clone the gene
(eg. from birch pollen) and not know that it was in the same
protein family as pathogenesis-related proteins from other
plants. The UniProt database entry for this gene is P13239.
UniProt classifies PR10 homologues from all plant species in
which this protein has been found as the BetVI
pollen allergen family.
The entry for the Pea gene shows that automatically generated hypertext links to other databases provide the user with a complete picture of this gene family. For example, the link to the Pfam database provides information on protein domains, structure for this gene family. The knowledge encoded in these relations embodies information from a large number of research projects from many labs.
| Take home lessons: The example of knowledge that we have looked here may seem to be nothing more than common sense, and even trivial. Their significance becomes apparent when you realize that all of the information comes from raw pieces of data, such as raw sequence, similarity comparisons between sequences, protein structural analysis, and endless details written in research articles. The work of bioinformatics is not so much the acquisition of raw data, but the art of how we organize and analyze that data. |
One of the goals of
bioinformatics is to create models, data objects that represent
concepts from the real world. The more we make the model like
the real-world concept, the easier the model is to work with,
and the more useful it is. Here is view of chromosome III from
the nematode worm, Caenorhabditis elegans, displayed in
a web-based genome viewer.
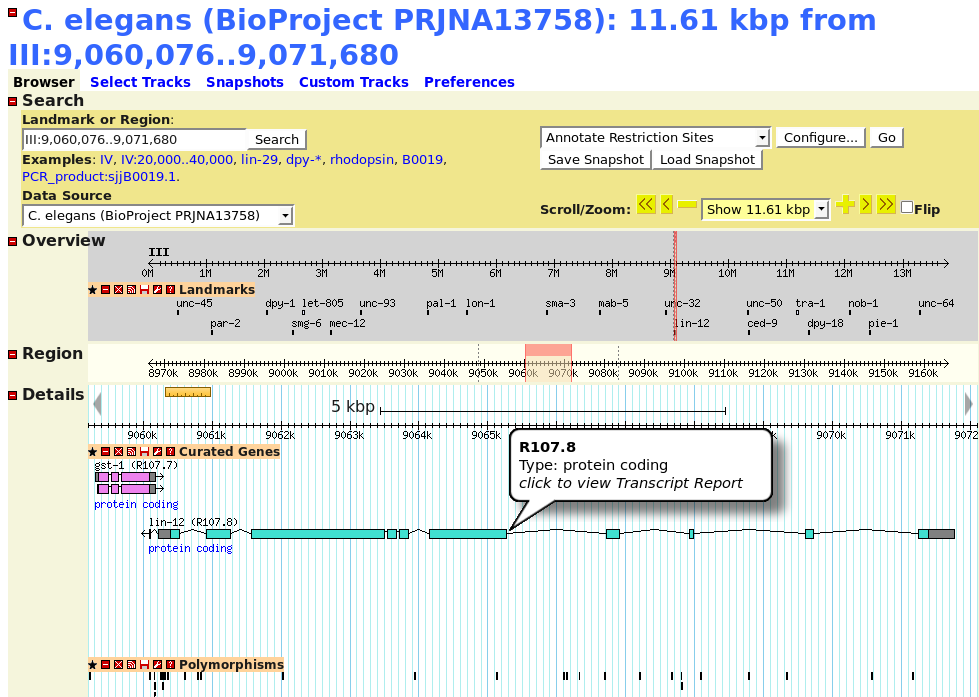
Questions:1. In what ways does this model accurately represent the chromosome? (In other words, what are the data and methods of this object?) |
EXAMPLE: Transposable elements in plants may carry regulatory sequences from gene to gene.
Bureau, TE and Wessler, SR (1994) Stowaway: A new family of inverted repeat elements associated with the genes of both monocotyledonous and dicotyledonous plants. Plant Cell 6:907-916.
Bureau and Wessler found a transposon called "Tourist" in the 5' non-coding region of the PEP carboxylase CP21 gene of sorghum. This Tourist element appears to contain another transposon, which they called "Stowaway".
Figure 1. The disrupted Tourist-Sb1 in the 5' flanking region of the sorghum phosphoenolpyruvate carboxylase CP21 gene (transcription start site, bent arrow). The 5' coding sequence has been expanded to show the position of Stowaway-Sb1. Triangles indicate terminal inverted repeats.
Stowaway had terminal inverted repeats characteristic of transposons. To test the hypothesis that Stoway is a transposon, they searched for Stowaway in other plant sequences in GenBank.
| Stowaway-St5 is located within intron 5 of the potato patatin pseudogene (STPATP1) but not in the corresponding position of three other members of the patatin gene family. |
STPATP1 TTTCTTAATATA>===St5====<TATAATAGAAAA |
| Stowaway-Ps2 is located in the 5' flanking region of the pea CAB80 gene but not in CAB66. |
PEACAB80 TATAATTAACTA>===Ps2====<TATATACTAGTT |
| Stowaway-Le2 is located in the 5' flanking region of the tomato rbcS1 gene (LERBSS1) but not in the corresponding position of the potato rbcS3 gene (STRBCS3). An asterisk indicates a short variable region, 7bp in LERBSS1 and 16bp in STRBCS3. |
LERBSS1 TCTTGTCTATTA>===Le2====<TAAAATAT*AAA |
| >,< - terminal inverted repeats; red - target sites presumed duplicated during transposition. |
The Stowaway-Le2 element is particularly interesting because about 50% of the sites protected in DNAse footprinting assays [Manzara et al., (1993) Plant Mol. Biol. 21:69-88] are found within this Le2 element of the LERBSS1 gene. In other words, Stowaway contains sites bound by light-specific DNA binding proteins.
Stowaways also make up most of the 3' non-translated region and polyA site mRNAs encoding stress-inducible thaumatin-like proteins Hv-1a, Hv-1b, Hv-1c and Hv2.
Hypothesis: Transposons could be a powerful way for regulatory elements to move from gene to gene. Mixing and matching cis-regulatory elements could make it easier for evolution to try out new regulatory strategies.
Do these data really support that hypothesis? It's a difficult question to answer:
| PLNT4610/PLNT7690
Bioinformatics Lecture 1, part 1 of 2 |