![]() Summer
of 2005 satellite images of Manitoba’s Great Lakes
Summer
of 2005 satellite images of Manitoba’s Great Lakes
MODIS images
The satellite images
on this page were recorded by the Moderate Resolution Imaging Spectroradiometer
(MODIS) now orbiting aboard two of NASA’s satellites, Terra and Aqua. Unless otherwise noted, the actual colour
renditions were prepared by the MODIS Rapid Response Team out of the University
of Maryland who provide near-real time colour composite images on their web
site http://rapidfire.sci.gsfc.nasa.gov/realtime/
-- except that I have changed the tone curve to emphasize colour differences in
the lake, at the expense of brighter areas like clouds.
Click on
each underlined date below to view a larger copy of the image.
25 November 2005 3 December 2005
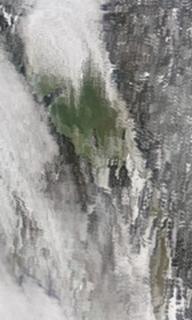
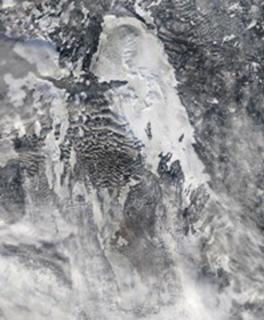
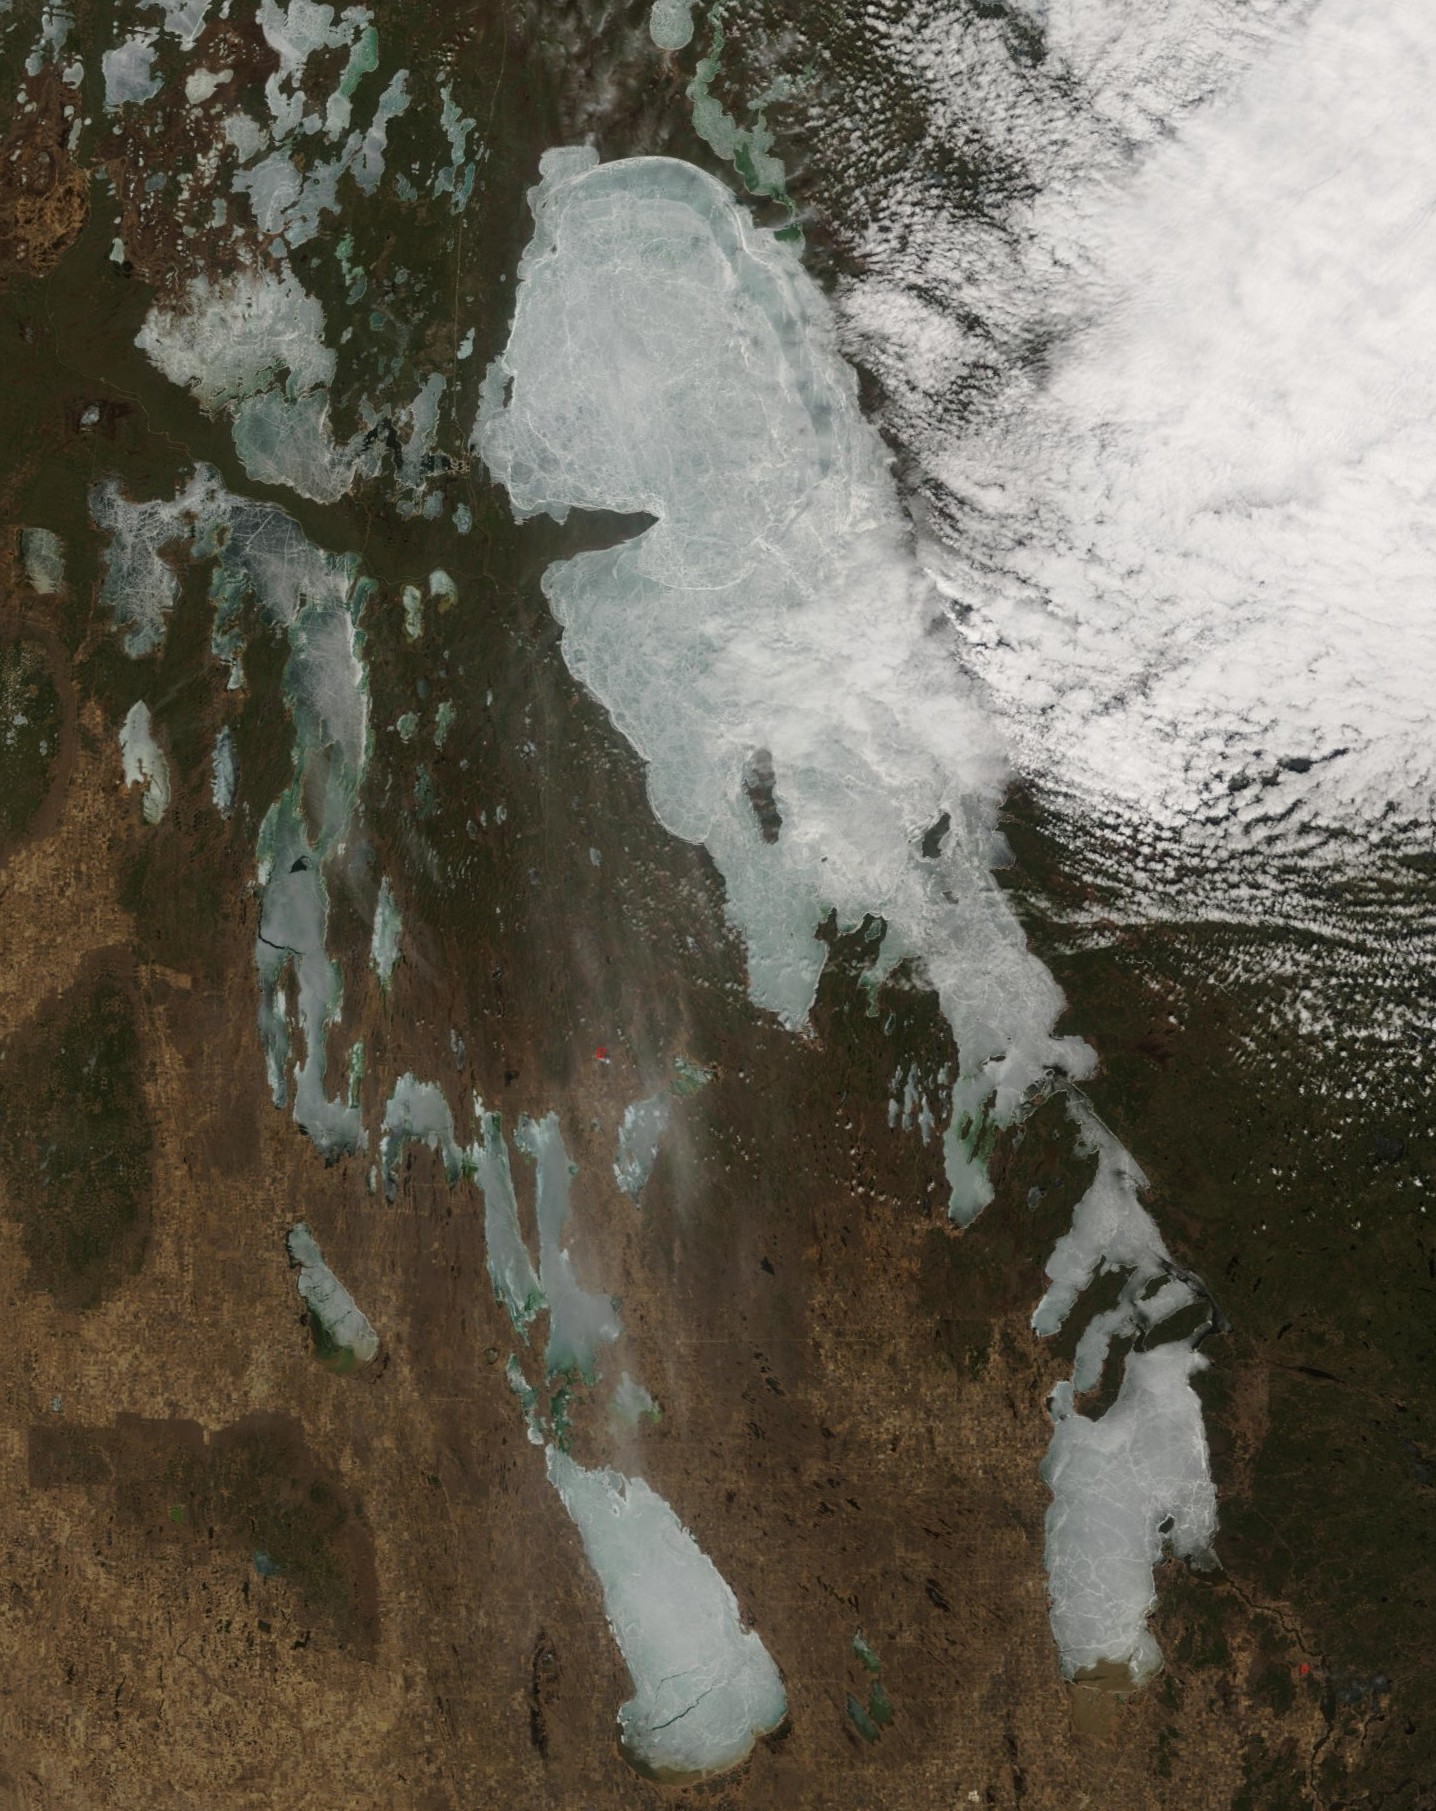
Over the last week, Lake Winnipeg has completely frozen over. Clouds obscured most of the lake most of November – consequently I haven’t seen any images inspiring enough to post (and I have had a thesis to write – concentrating my mind elsewhere.) The 25 November image is really poor quality – captured looking way off to the side from the satellite’s path. (The best ones are, of course, on the days when the satellite passes directly overhead – like the one above on 3 December.) But you can see that ice floes covered the western half of the South Basin already by the 25th – when the North Basin was still pretty much ice-free north of Berens and Reindeer Islands (including in the cloud-covered area north of Long Point – where it was still ice-free except along shore in a glimpse through the clouds on the 27th. Today – the 3rd of December – there’s no open water visible anywhere. The smooth white ice has a fresh snow cover over it. The darker ice, with cracks and ridges, is snow-free and probably a few days younger than the white.
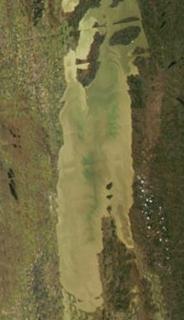

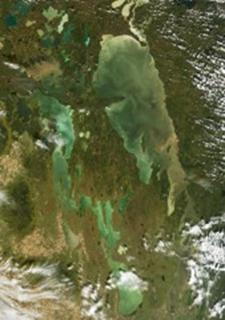
South Basin, 15 October 25 October 2005 12:30 Over the last month there have been only a couple of images clear enough to see parts of the lake, and those were very poor quality, the satellite looking across from too far to the east or west – hence, here’s the first since the 26th of September. The Namao is just finishing up her cruise this week. Though there don’t appear to have been extensive surface blooms since early September and though they did see a lot of diatoms, Aphanizomenon flos aquae – a bluegreen – was still the dominant species in the lake. There were surface blooms in the South Basin as late as the 15th of October – note the green NNW of Elk Island in the image of the South Basin on the left. For more on the algae, check this link. It’s by Hedy Kling, who looked at this summer’s samples (not only from the Namao, but from the Province earlier this summer, and others) under her microscope. She wrote a brief report on the algal species in Lake Winnipeg this summer, and posted some beautiful microphotographs of them.
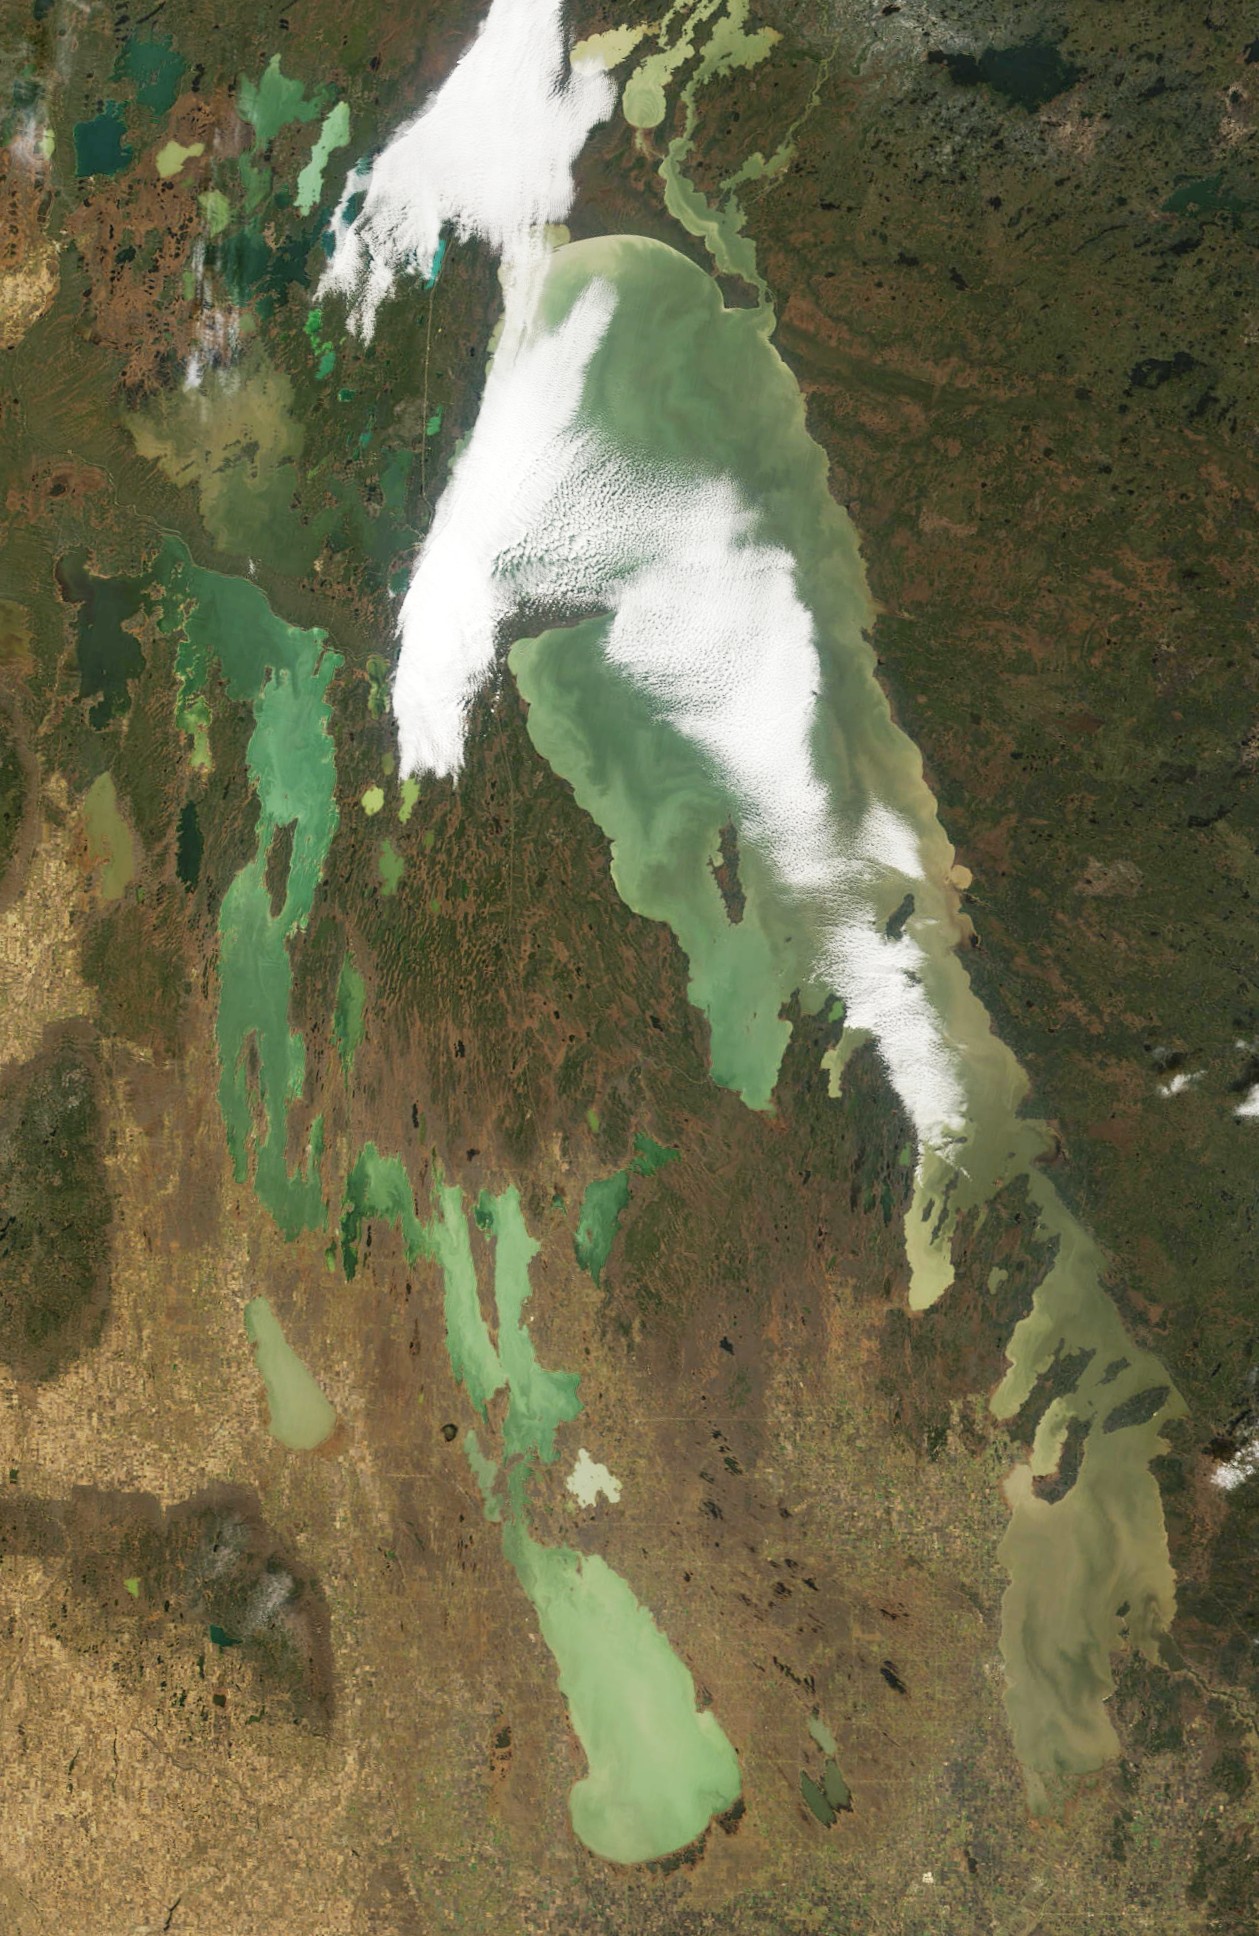
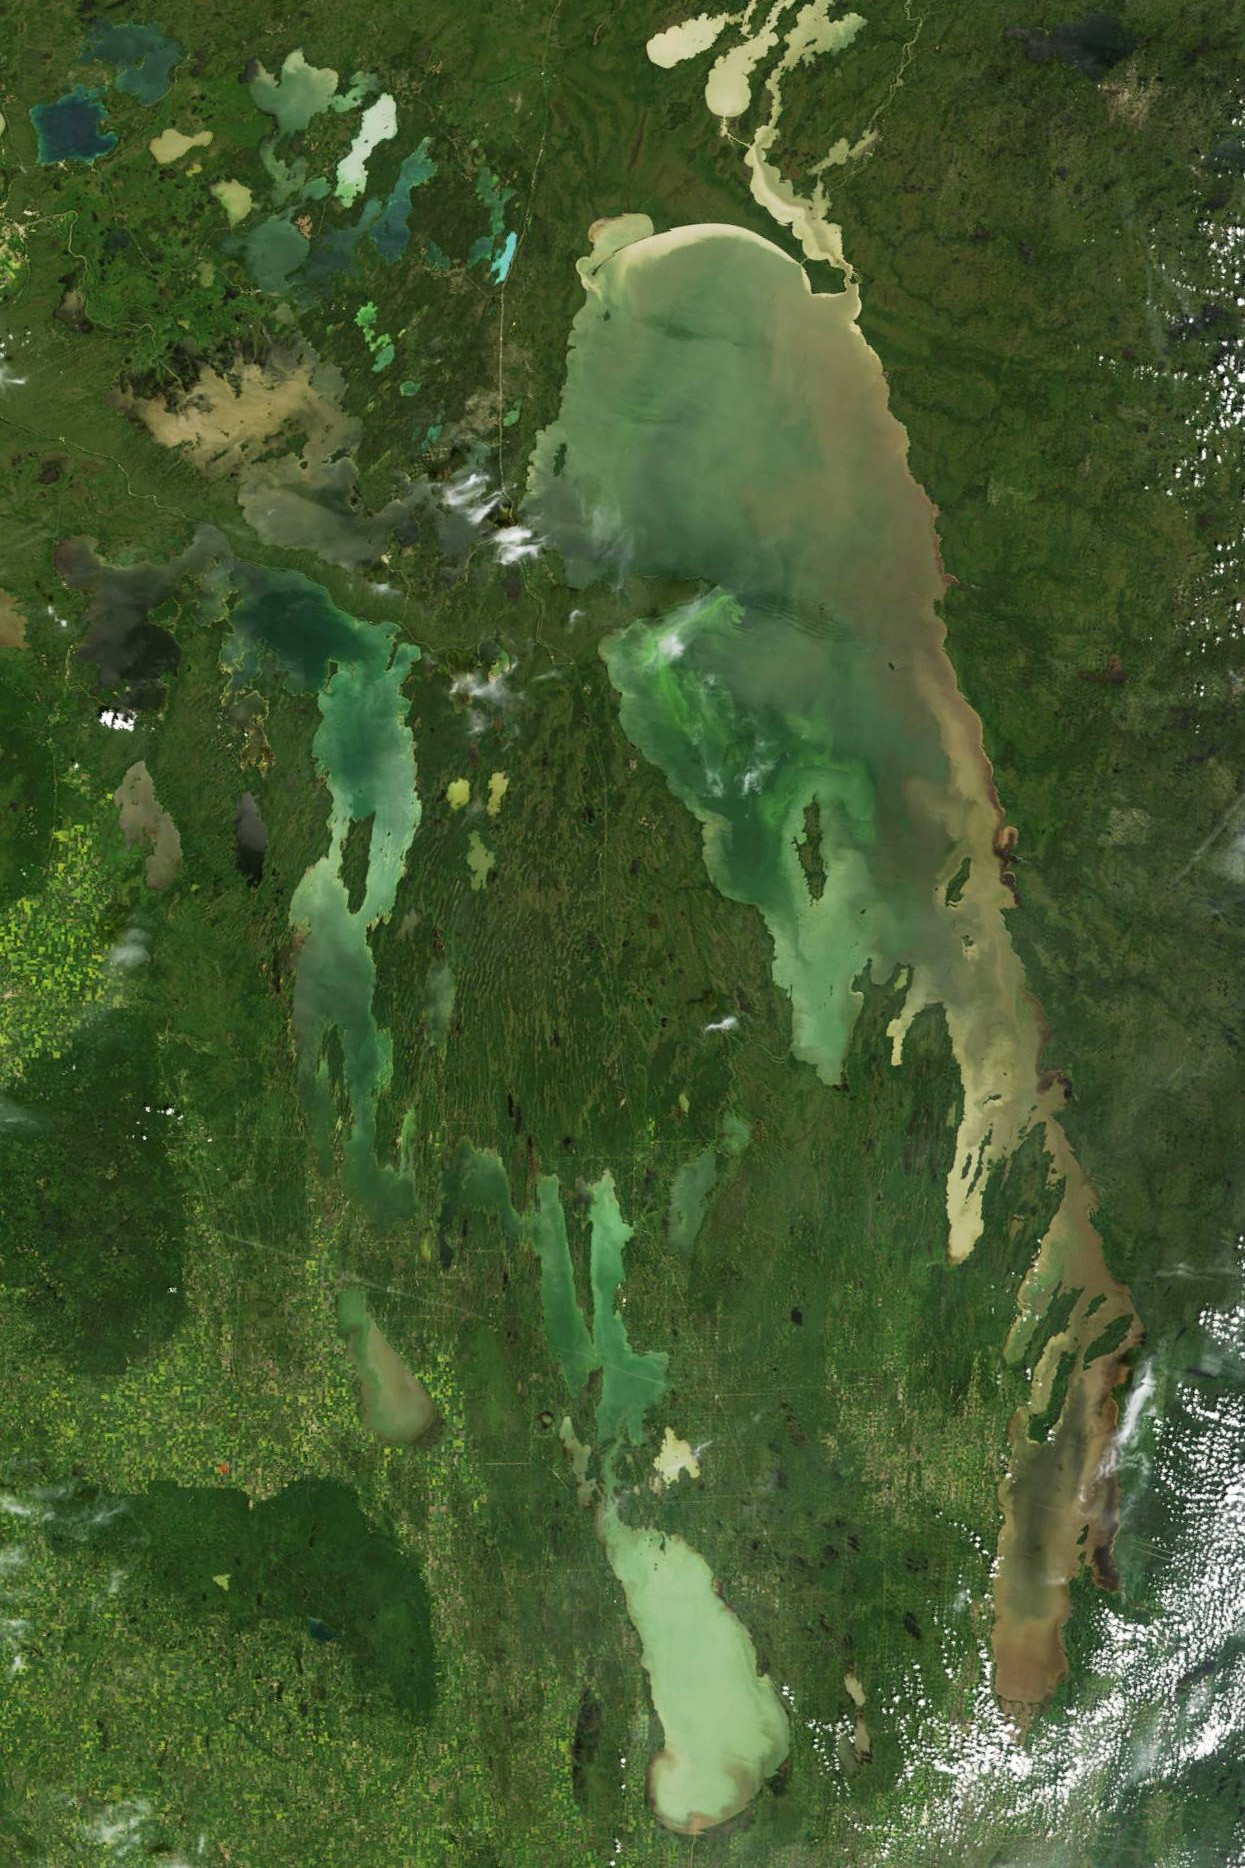
26 September 2005 13:00 There doesn’t appear to be much left of the intense algal blooms that we saw in the North Basin in late August/early September. Although the clearer water is still quite green, the patterns in the North Basin now appear to be mostly due to swirls of more turbid water. There’s been a lot of erosion along the north shore, and some along the east. If you look back through earlier images, you can see how huge gyres due to very large scale circulation can have carried plumes of more turbid water (with more particles of clay – tending to milkier colours, or light tan coloured as along the north shore) throughout the basin. For instance, check out the light-tan coloured strand curling counter-clockwise down from the turbid water along the northeast shore in the image of 7 September 2005.
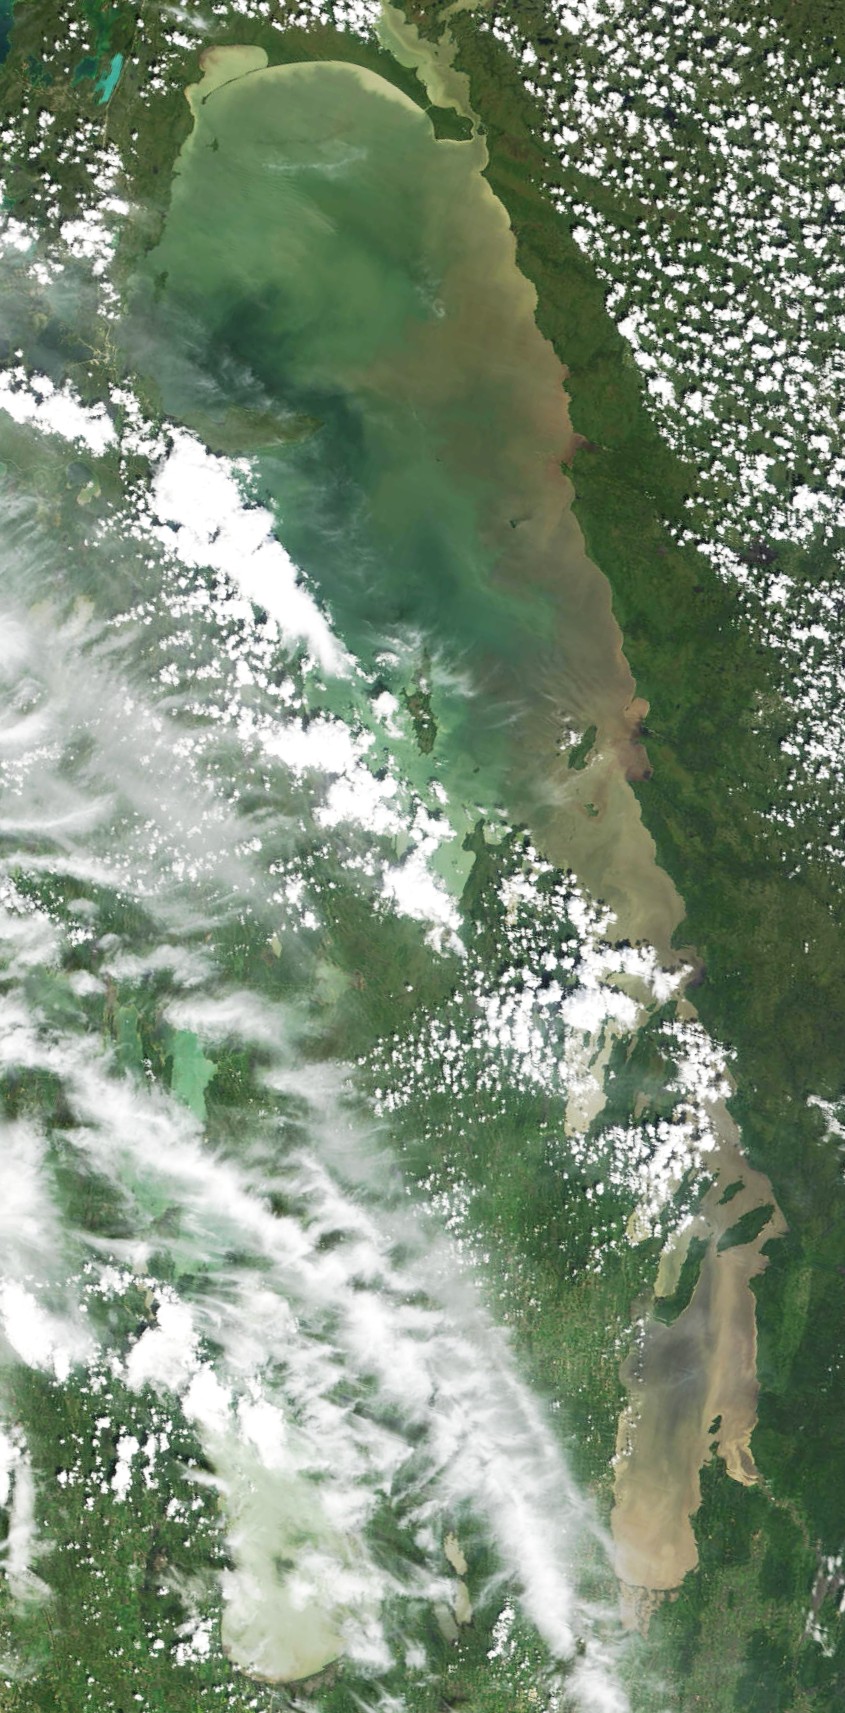
12:55 19 September & 12:40 21 September 2005 The bloom that was so intense in the South Basin on the 18th is not as sharp in this image – but the green is still visible – probably much the same amount of algae, but mixed back down into the water column and so partly hidden by the turbidity.

13:55 18 September 2005 Much of the North Basin is cloud-covered in this image, but what we can see may serve to help planning for the Namaos’s fall cruise, which is set to begin in less than a week now. Intense surface blooms of algae have developed offshore in the South Basin, now stretching up the centre of the basin from within 10 or 15 km of the Red River all the way up past Hecla Island. As over the last couple of weeks, they are in what appears to be relatively clear water (darker brown in these images) well offshore. As always, there is a mystery – why are there no blooms in the clearest water in the South Basin? – that is, in Traverse Bay at the mouth of the Winnipeg River. Maybe the Red River water is just that much more nutrient-rich. But I wonder if maybe the answer lies in how fast water is pushed through the bay, and how fast a bloom can develop. Looking back over the last few images, you can see that the blooms in the centre of the basin have been growing over more than a month – a little stronger in each image. The water in Traverse Bay is continually being diluted with new Winnipeg River water. Perhaps as fast as algae multiply there, they are carried out of the bay, into the basin. Traverse Bay may even be an incubator – lots of nutrients and light, so lots of algal production, but no accumulation until the bay opens out, the flow-through slows, et voila! a bloom where the Winnipeg and Red River water meet. But that, for now, is speculation. A few well-chosen stations on the fall cruise may tell us a lot.

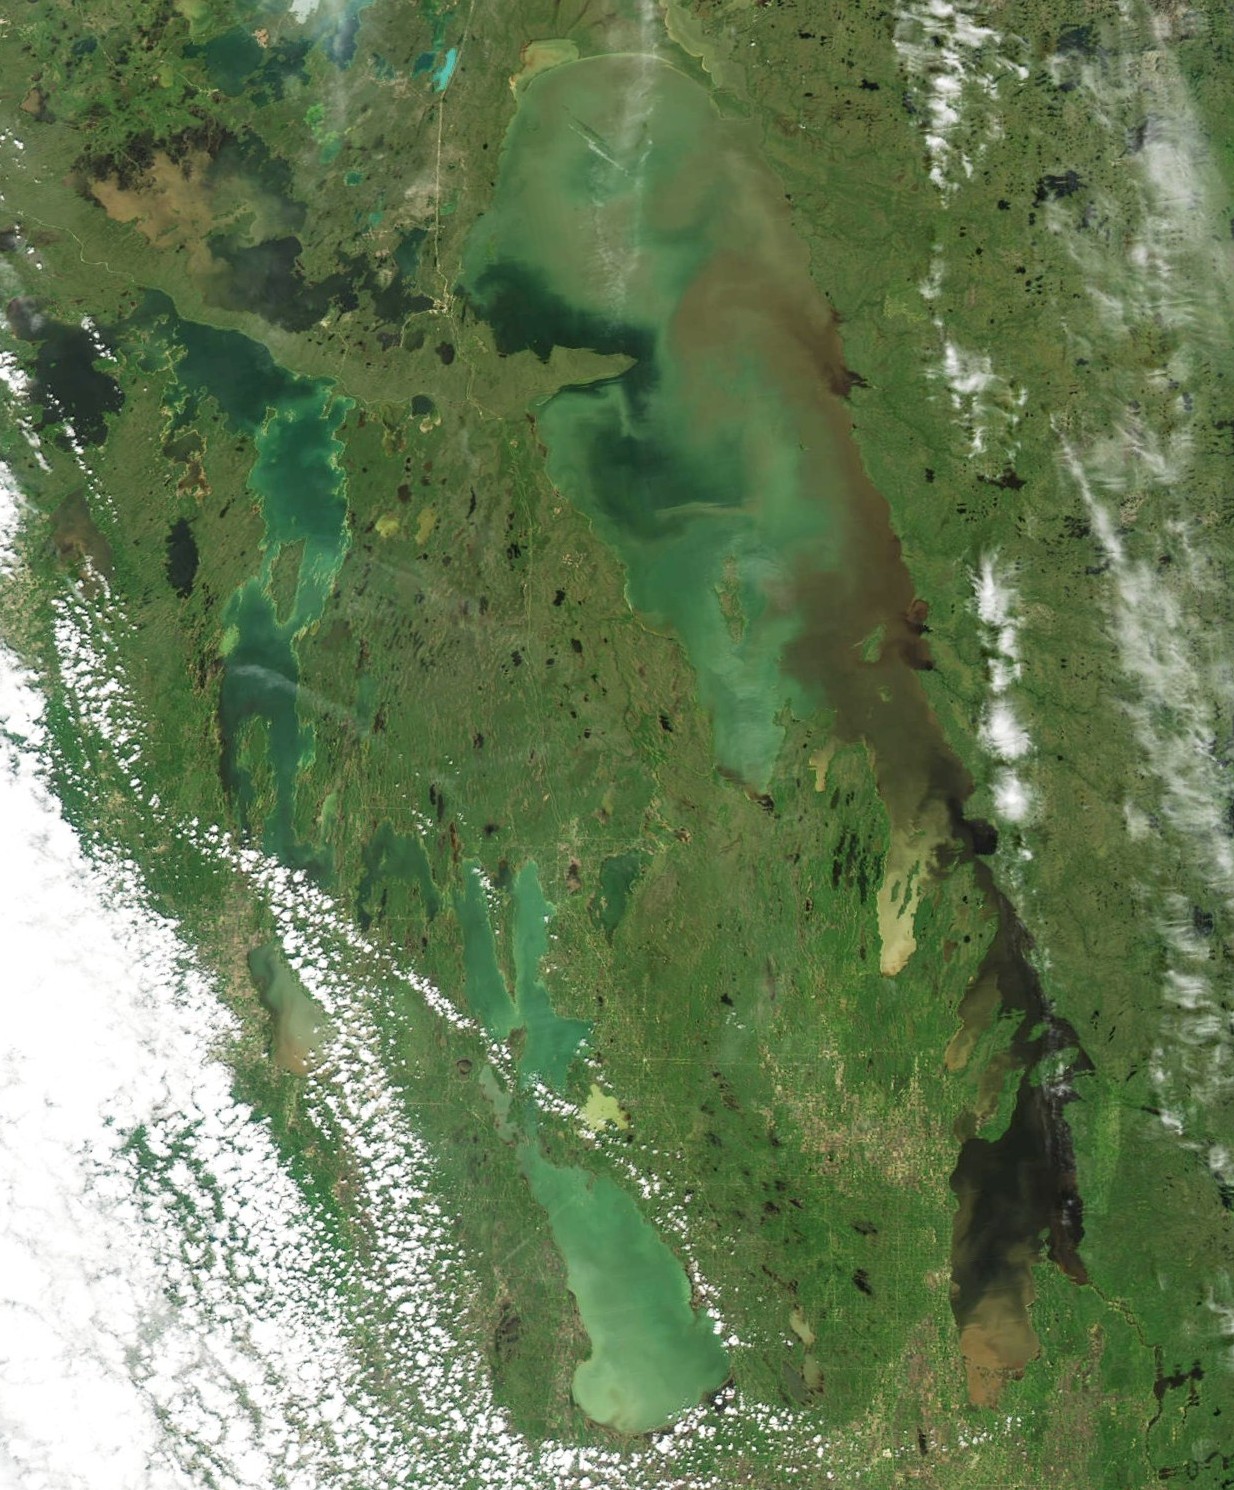
13:50 11 September 2005 The very extensive surface bloom that had covered much of the North Basin since late August has dissipated. All that is clearly visible in this image is a small, less intense surface bloom north of Reindeer Island. Much of the North Basin remains quite green – there is still algae there, but now mixed down through the water column. There is still a long narrow patch of algae a few kilometers off, and parallel to the west shore in the South Basin. The light tan colours on the east side of the basin indicate more turbid water; the darker, slightly greenish browns on either side of the green bloom indicate that it is surrounded by somewhat clearer water than along the east side – a slightly better lit environment for algae to grow in.
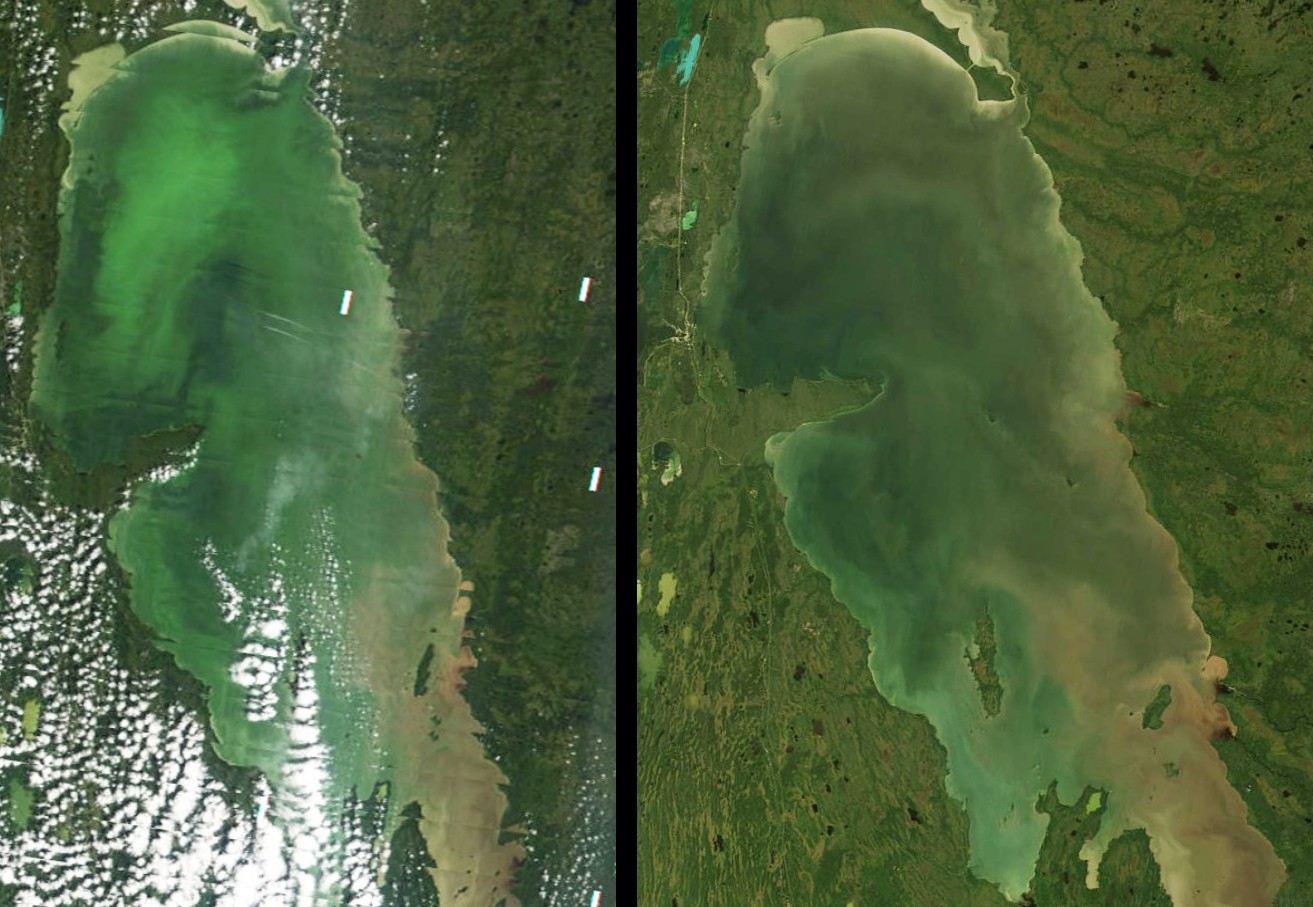
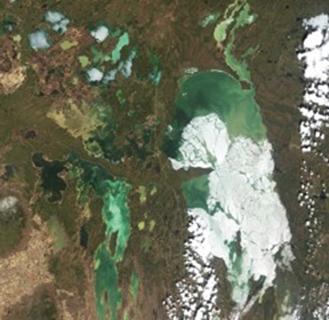
14:15 7 September 2005 South Basin at 12:30 and 14:15 7 September 2005
The surface bloom in the North Basin is very nearly as extensive as on the 29th of August, although not as intense in this image. In the South Basin on the 29th, there was a small patch of algae east of Elk Island. Today, there is a long, thin bloom few kilometers off the west shore. The difference between these two images of the South Basin shows how quickly surface blooms can develop. The two were recorded only one and three-quarters hours apart, and in that time a lot of algae floated themselves up to the surface over along the east shore, and up in the northern part of the basin. Even the bloom off the west shore is more intense. It was a bright sunny day, and there was only a light breeze – pretty good conditions for a surface bloom to develop if there are enough blue-greens in the water column to have an effect. And clearly, there are.
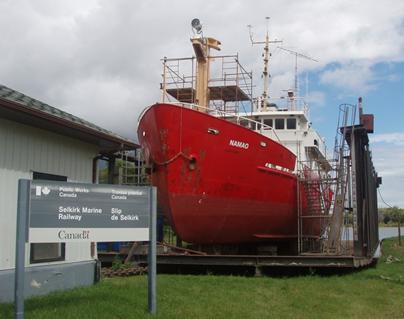
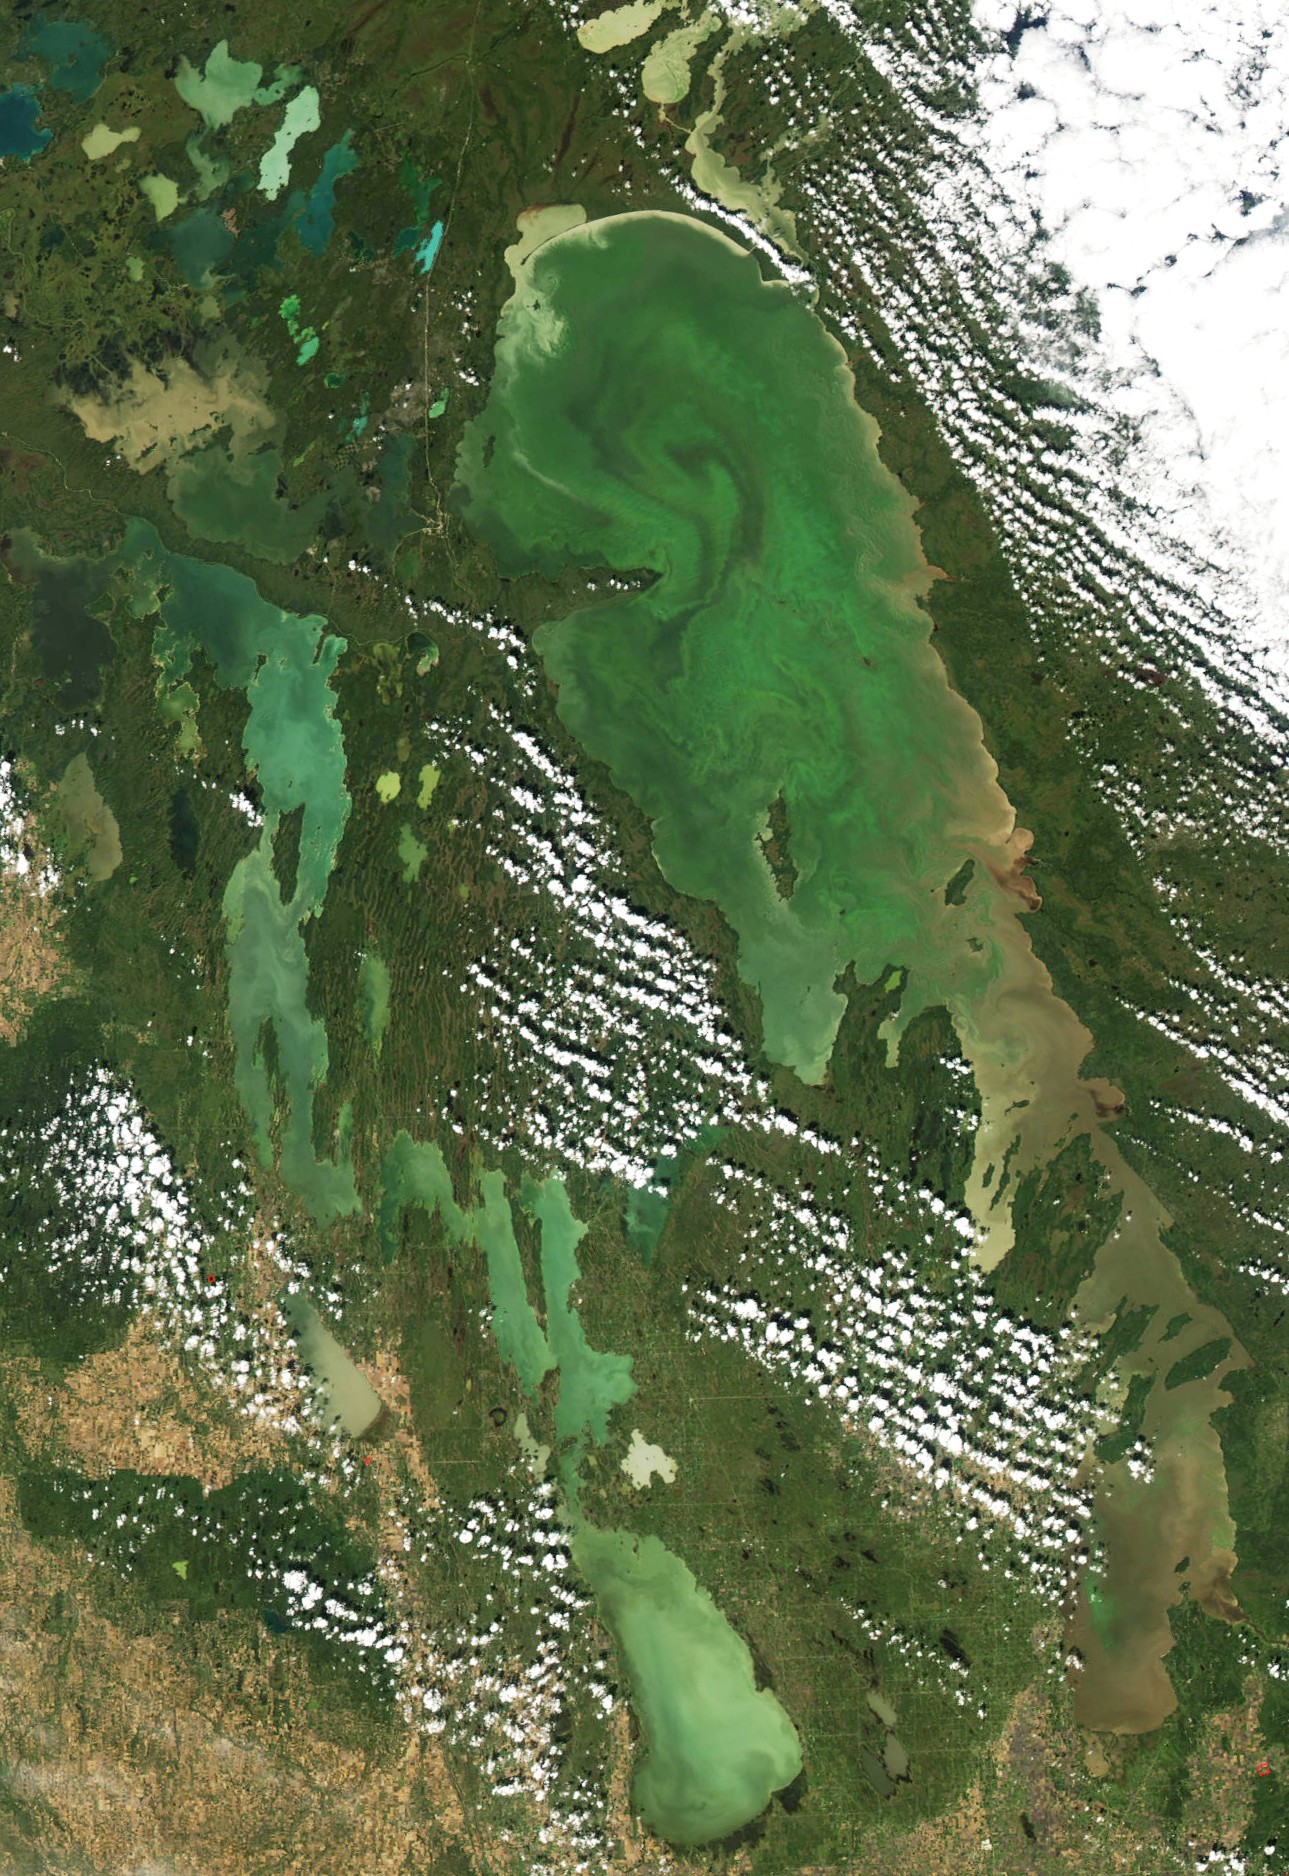
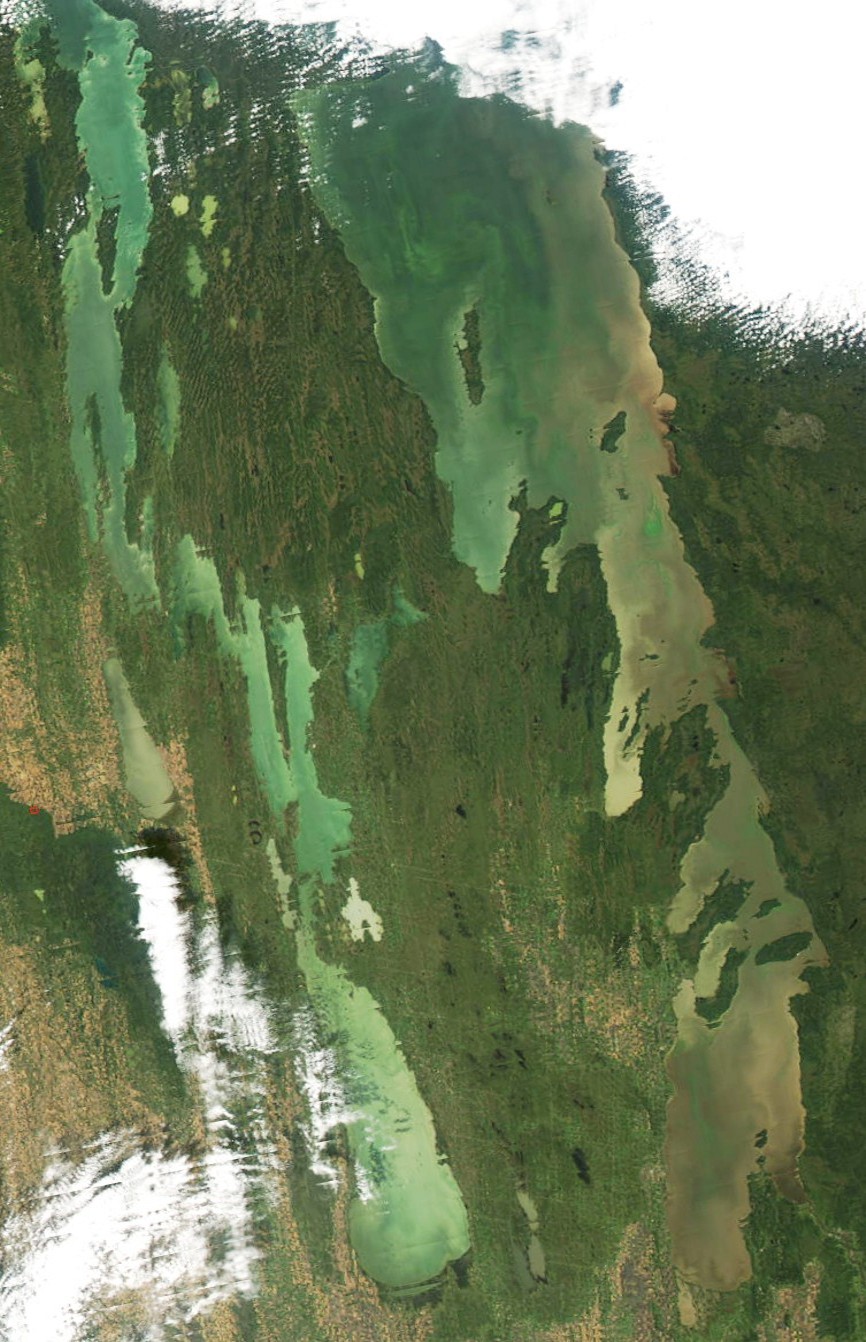
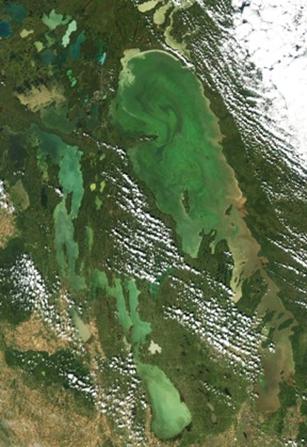
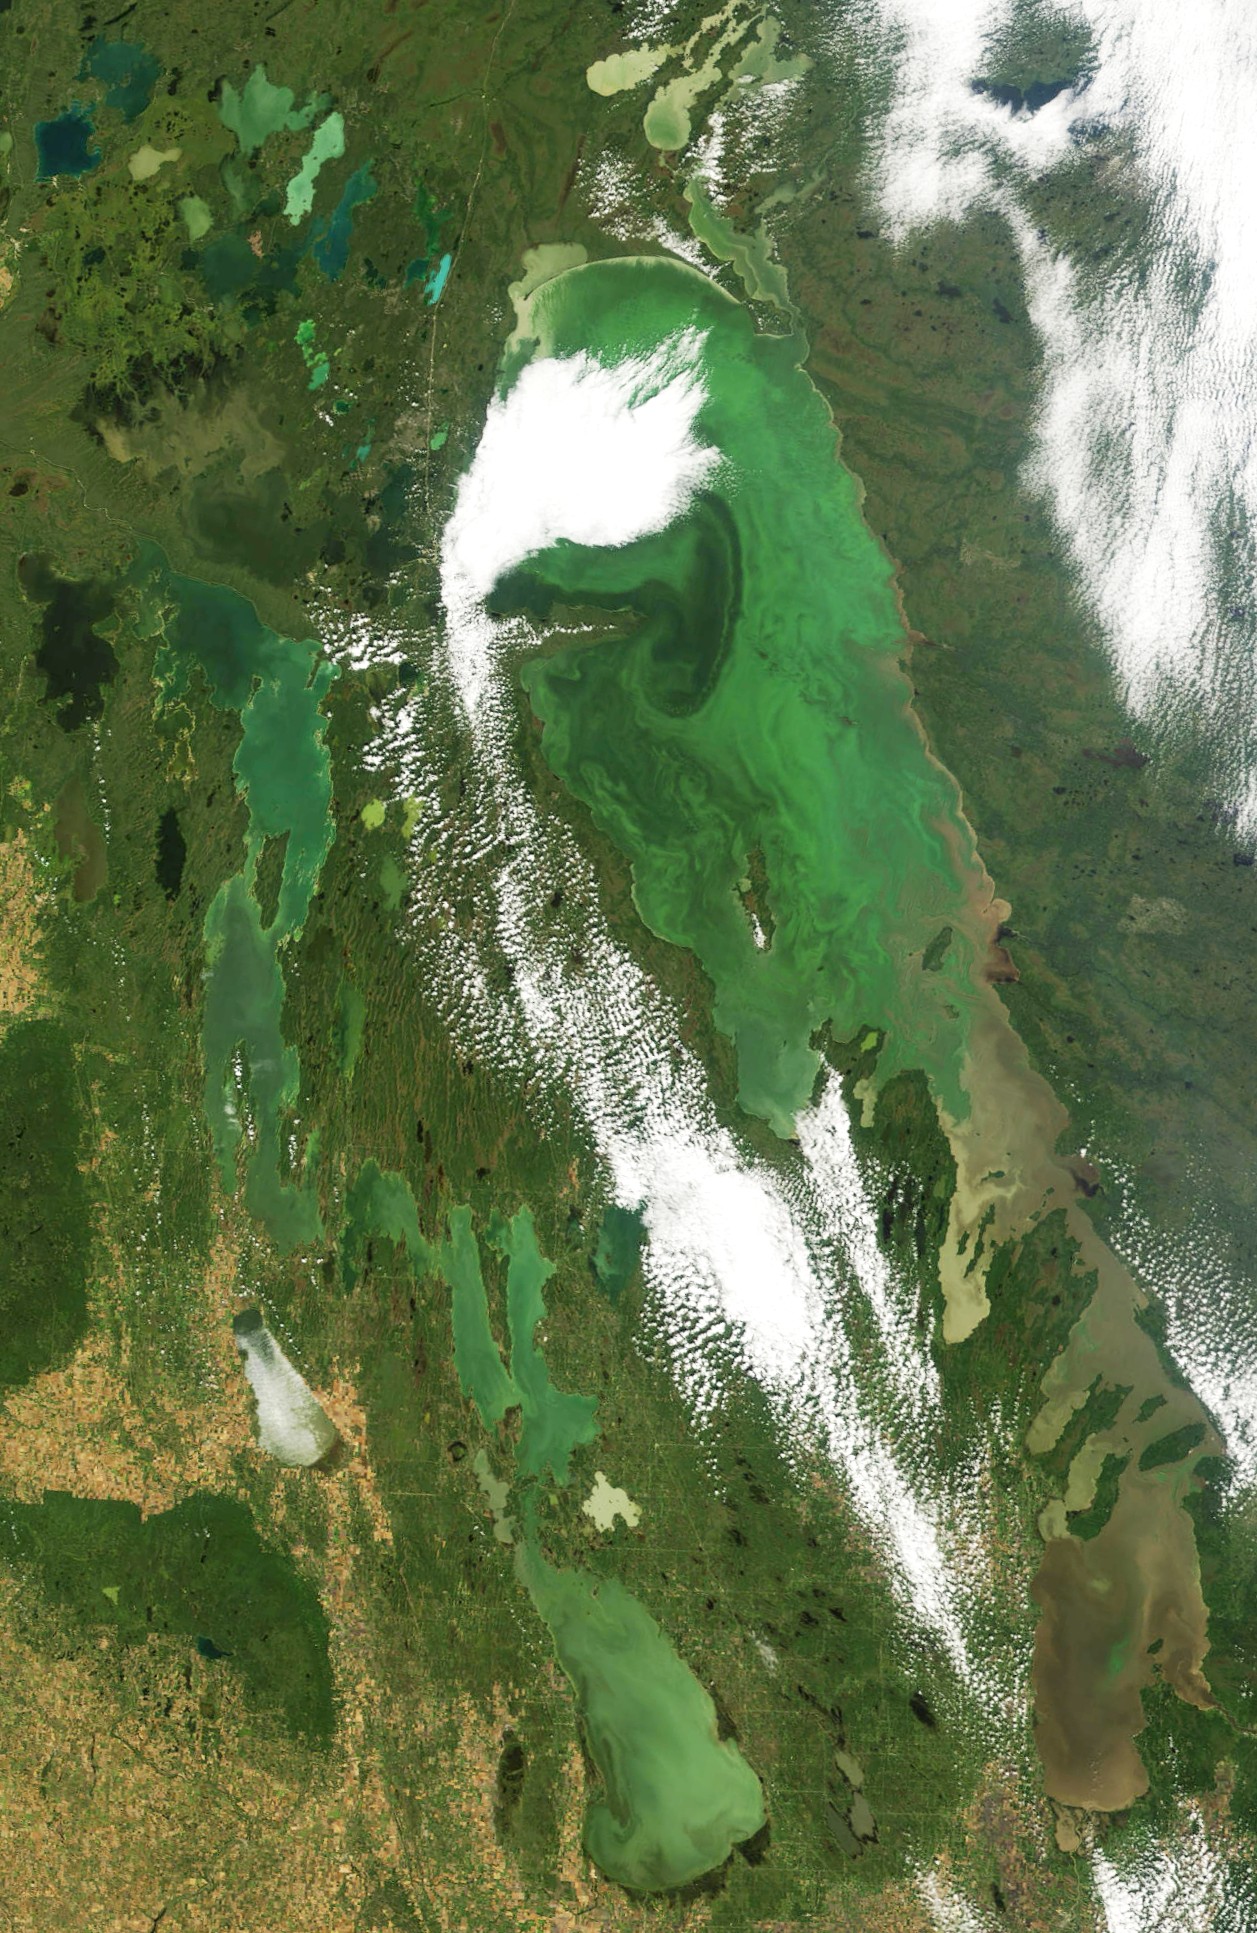
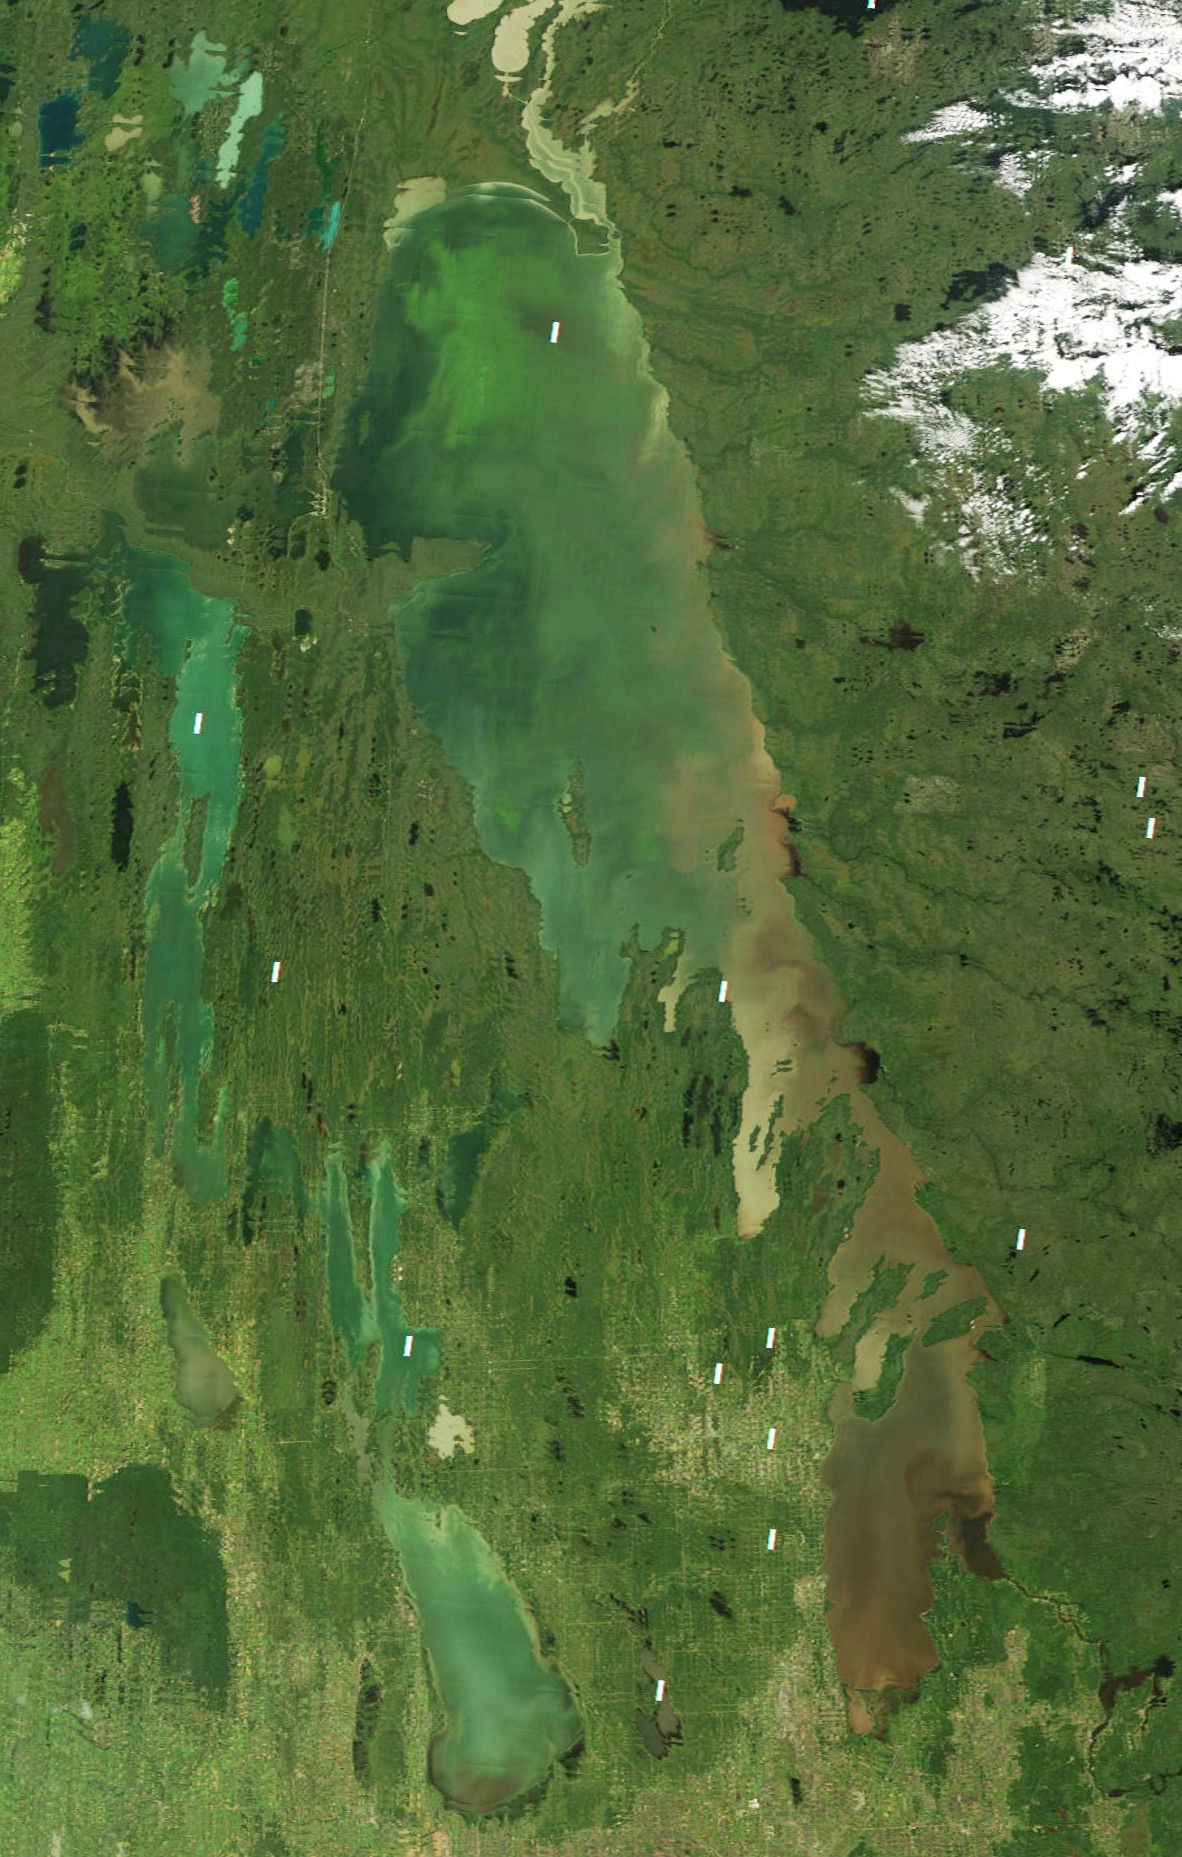
12:35 29 August 2005 A huge surface bloom of blue-green algae formed up over the last few days – you can tell by the bright yellow-green colours in great swirls all over the North Basin. Given that the area of the North Basin is roughly 17 000 km2, we must be looking at more than 10 000 square kilometers of tiny green cells. The darker green water flowing along the north shore of Long Point is Saskatchewan River water – clearer than the older lake water around it. It seems to have split into two huge plumes curling both to the north and the south around the point. It would be really useful to our understanding of these blooms to know the difference in chemistry between those two different waters – the one producing widespread surface blooms, the other greenish with algae, but perhaps not the same species since they’re not floating up to the surface. Ah, well…maybe when the Namao heads north in a few weeks – that’s her on the right, out of the water in Selkirk for her hull inspection and recertification. On a much smaller scale than in the North Basin, there are several blooms showing up through the turbidity in the Narrows and the South Basin. Notice the green patch just west of Elk Island and Grand Beach. That’s algae taking advantage of a patch of clearer water.
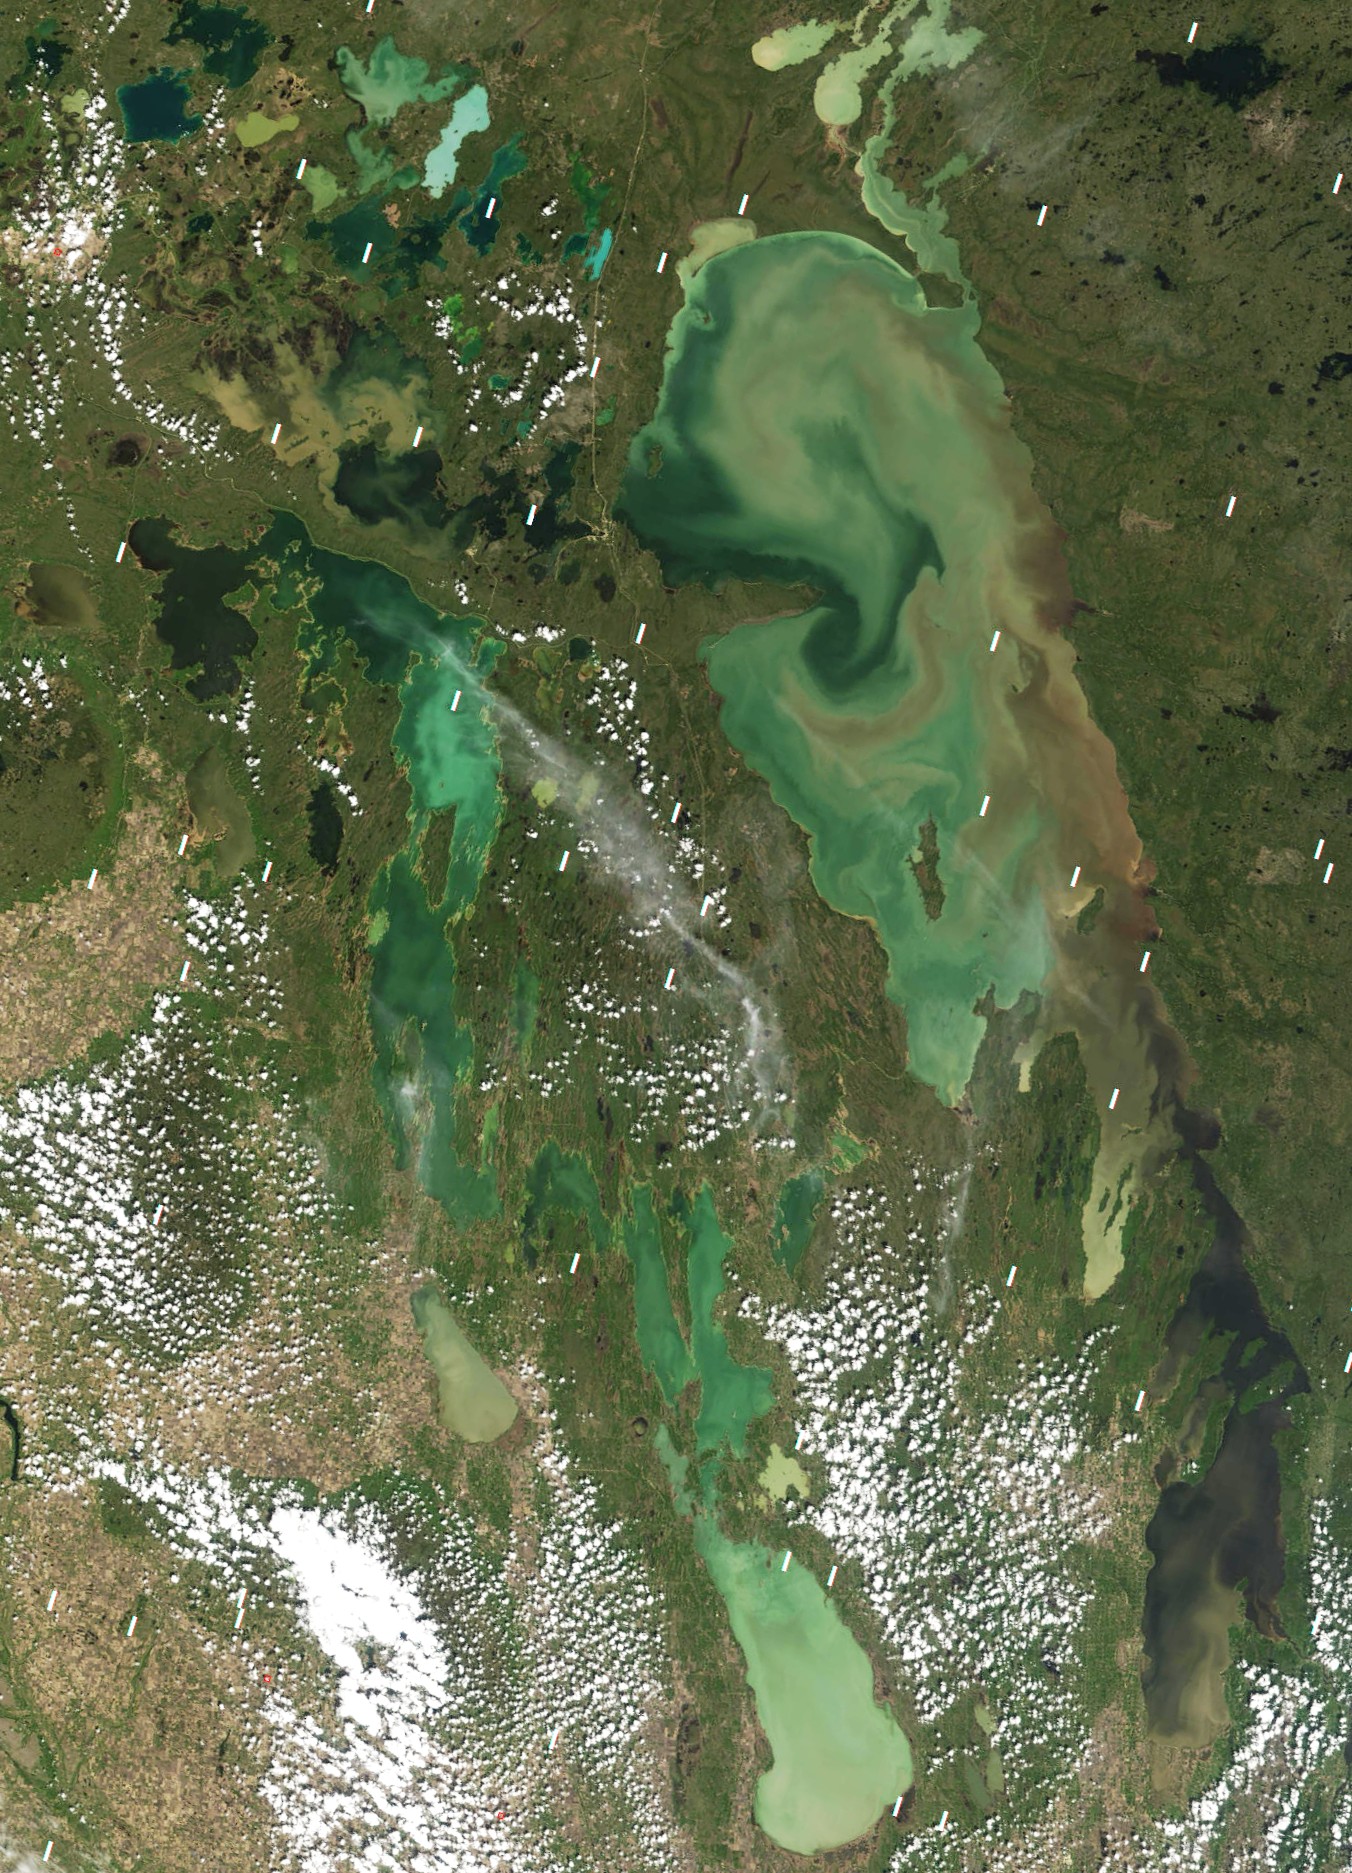
13:00 25 August 2005 The satellite caught this image of the lake between the clouds. A few hours later and the lake would have completely clouded over as a big low pressure air mass moved in from the west. Take a look at the striking plume of turbid water (light tan colour, loaded with suspended silt and clay) flowing out and through Playgreen Lake just to the north of Lake Winnipeg. The turbid water comes from erosion of the north shore – you can see turbid water all along the shore and at Limestone Point, spreading many kilometres to the south. The erosion is particularly evident now because of the strong north winds a few days ago. Sustained winds don’t only create powerful waves striking the north shore, they also push water along with them northward, in this case raising the level along the north shore by about a third of a metre so that the waves are washing over the beaches and cutting into the high clay and peat banks behind them. (You can find lake levels on the Water Survey site at http://www.wsc.ec.gc.ca/products/main_e.cfm?cname=products_e.cfm ).
Most of the Nelson River water flows out the Two-Mile Channel – an artificial channel constructed by Manitoba Hydro to improve the hydraulic efficiency of flow out and downstream. You can easily see the Two-Mile Channel in this image – a straight-line channel out of the lake near the north-east corner. The natural channel at Warrens Landing – a broad, shallow outlet, often thick with pond-weed by August – is hidden by clouds.
I don’t know why, but many of the
pictures below do not show up on this home page.
Please bear with me. I’ll figure this out and fix it when I have a
little more free time.
For now, please just click the
links below (underlined); you will still be able to view the larger
images.
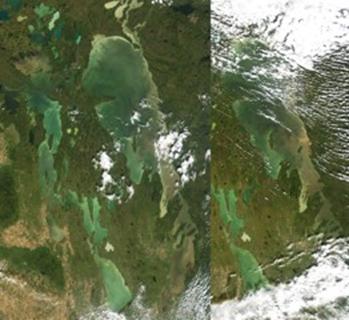
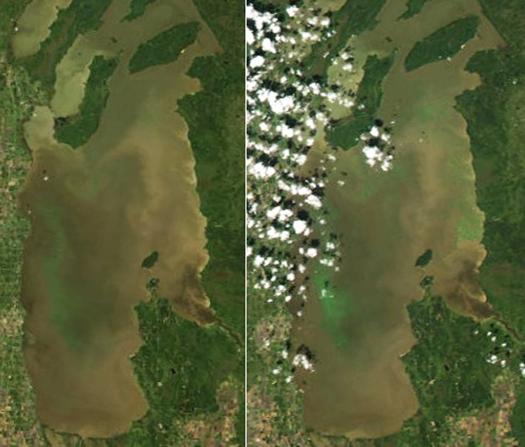
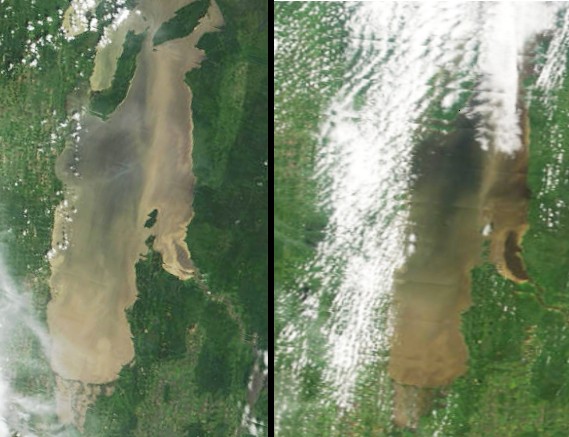
13:25 21 August & 12:30
22 August 2005 What a difference a
day makes. If you’ve been out on the
lake much, especially on the North Basin, you will know how quickly the wind
can come up and completely change your day.
That’s pretty much what happened to the algae. The image on the left was taken on the morning
of the 21st, on a sunny, almost windless morning, according to
records at Norway House and Grand Rapids.
The lake would have been near dead calm and the bluegreen algae
obviously took the opportunity to float up to the surface to soak in the
sun. They can do that – they have little
vacuoles that they inflate to provide buoyancy that floats them to the surface
when conditions are right. But the
record at Norway House shows strong southerly winds yesterday – 30-35 km/h
gusting up into the 70s. On the surface
you would have seen waves a couple of metres high, but the water column would
have been stirred and mixed more deeply than that – probably to the
bottom. The algae are still there, but
now they are mixed deep into the water and we can’t see much of them from the
satellite. To see the whole lake, check
below. You can
find a map of the 21st August algal bloom on the Noetix web site at
http://www.noetix.ca/WaterQuality/
. Their map is based on an AVHRR image –
a different satellite. It passed over
the lake later in the afternoon than the MODIS image on my site. If you compare the two, you’ll see that the
surface bloom had spread further to the east by the time of the late afternoon
image. Its just a matter of a little
more time on a calm afternoon for more algae to float themselves up to the
surface.
13:00 9 August 2005 12:30 22 August 2005
There have been few cloud-free days lately – these are the best images in the last three weeks.
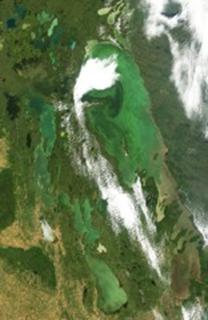
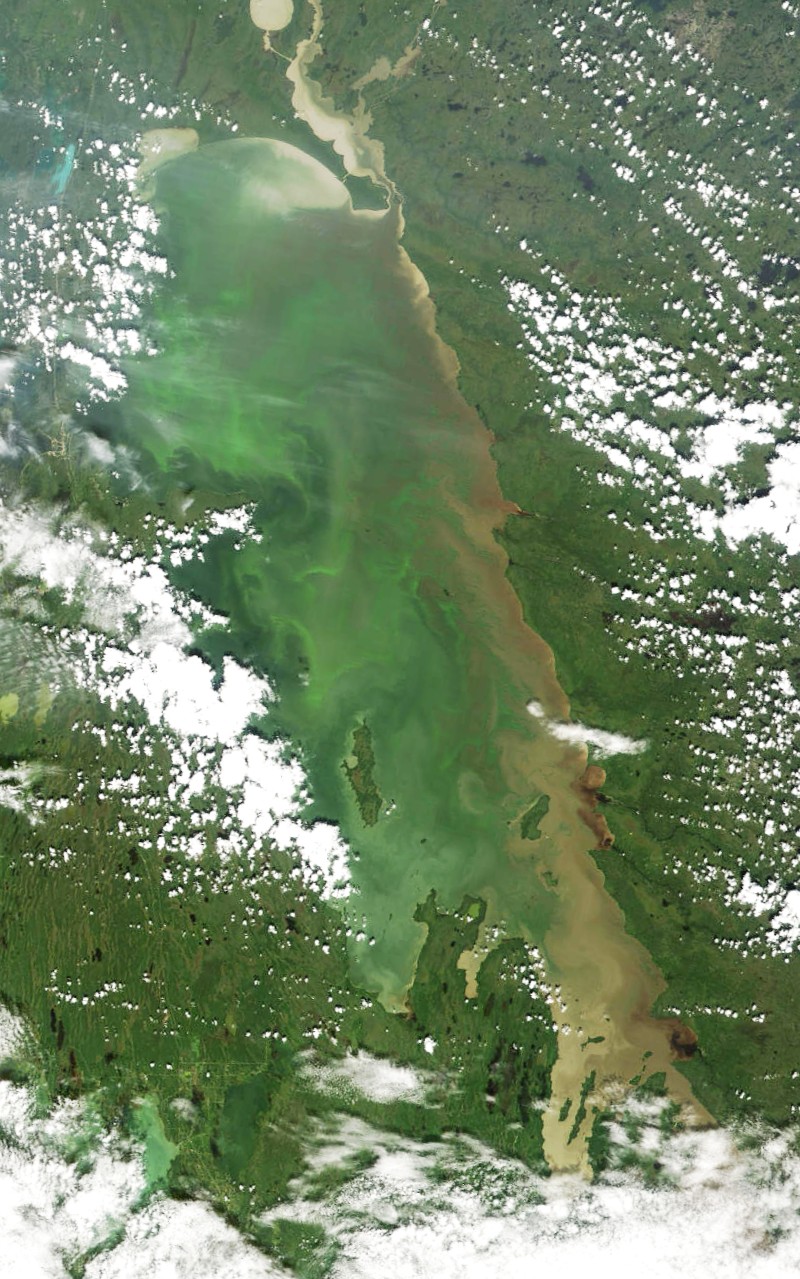
12:10 1 August 2005 There’s still a lot of algae in the North
Basin, though the blooms are not as intense as in early July images. There’s a surface bloom up north of Long
Point, but south of the point, the algae appear to be more deeply mixed into
the water column – perhaps by rough weather.
I think that the most striking thing in this image is the dark water at
the mouths of the Bloodvein, Pigeon and Berens Rivers. Like the rivers draining the prairies, the
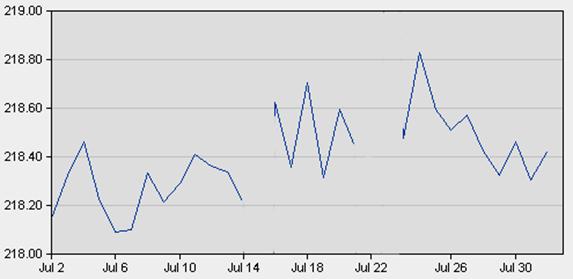
rivers coming off the Shield are still running high. For those of you who don’t live beside the
lake, the graphs below might help you put the current lake levels in a longer
term context. The upper graph shows
daily mean levels on Lake Winnipeg since 1913.
The highest levels on record were in late July, 1974 – a little over 219
m above mean sea level. The lower graph
shows recent data recorded at the Water Survey station at Gimli. These are also mean daily values; with a
strong north wind the levels in the South Basin could easily be pushed
considerably higher. The peak so far, on
the 24th of July, was just under 219 m – about 0.4 m short of the
highest mean daily level recorded. You
can view graphs of recent data for lakes across Canada at the Environment
Canada at http://scitech.pyr.ec.gc.ca/waterweb/formnav.asp?lang=0.
12:30 21 July 2005 13:00 24 July 2005
The
blooms south of Long Point that had already developed by the 12th of July are still there in this
image from the 21st, though they don’t appear as intense. And where it was just greening up to the
north of Long Point, there is a full-blown bloom in this image – the green is
softened a little in this image by the band of cirrus clouds running west-east
over just north of Long Point. There was
a surface bloom in Washow Bay (north of Grindstone Point) on the 12th; you can’t see it in the image
above recorded on the 24th. It’s a shallow bay, and perhaps over the last
few windy days, bottom sediments have been stirred up into the water column –
that would explain the light tan colour you see in Washow and other western
bays in this image.
12:35
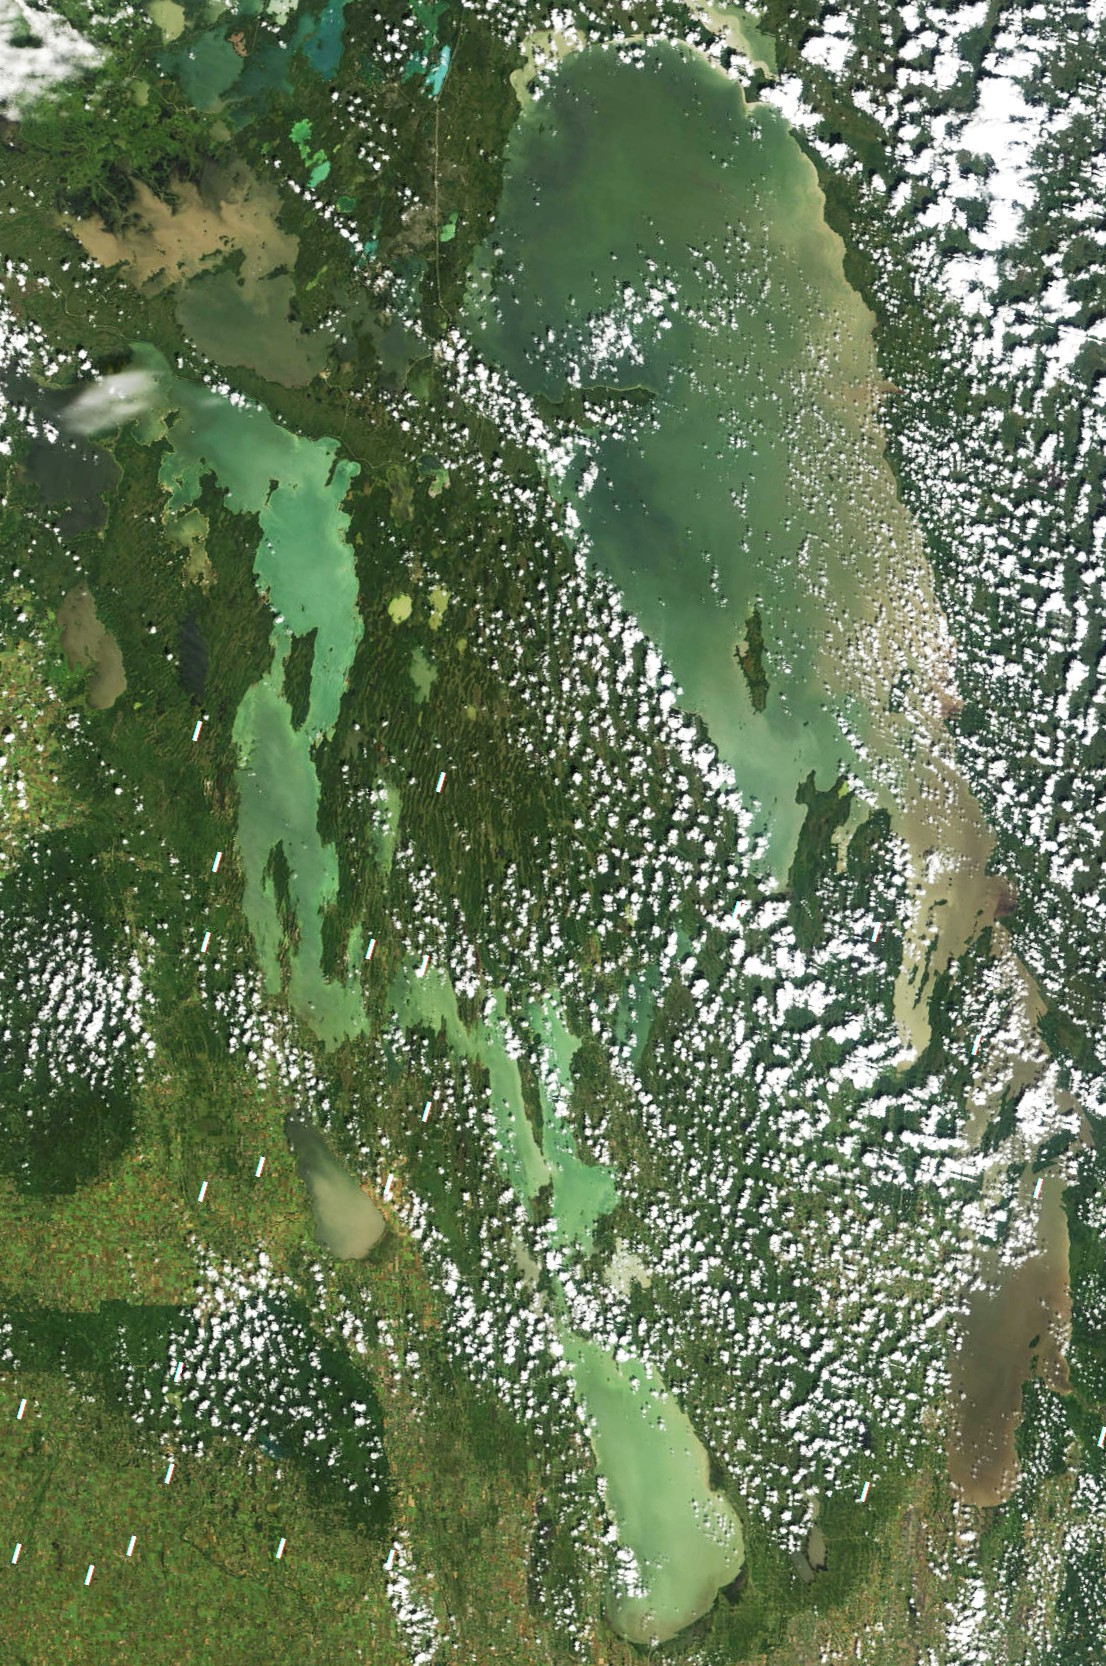
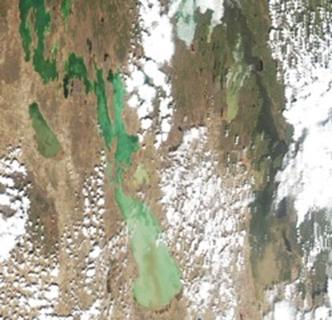
12 July 2005 The incidence of surface
algal blooms has spread compared to the image of a few days ago (8th of July). They’re still there south of Long Point, but
now there are widespread blooms between Georges and Reindeer Island, and just
to the north of Berens Island. I got
this from Bill Franzin today (the 12th) – “We flew from Georrge Island to Matheson
today and there were extensive sickly green blooms intermittently all the
way.” On the 8th, there was a
small bloom visible in Washow Bay (just north-west of Hecla Island); today you
can see it more clearly than before, and it extends up through the Narrows past
Pine Dock. The turbid plumes of both the
Red River in Lake Winnipeg (flowing up the west shore as on the 8th)
and the Portage Diversion (of the Assiniboine River) are clearly visible in
this image.
13:00 8 July 2005 The first big surface blooms of
algae have already appeared in the North Basin, just south of Long Point. That’s a couple of weeks earlier than last
year. They appear to be starting in the
same regions of the lake, though – compare this image from the 26th of July last year – that is,
from around Reindeer Island up to Long Point, and perhaps also off the west
shore north of Long Point. But the brown colour at the south end of the lake
indicates that there’s still lots of silt and clay coming in from the Red
River, and that should inhibit the growth of algae in the South Basin, though
blooms could still develop in the clearer water – darker and greenish off the
west shore from Gimli to Hecla Island, for instance – where there is more light
available for growth. It’s interesting
how the turbidity spreading from near the mouth of the Red River appears to
flow up the east shore past Elk Island, where it meets the darker plume of
Winnipeg River water. (It followed the
eastern shore on the 30th of
May, too. This is the path
that one would expect if the Coriolis force deflected
flow passing through the basin – it turns flow to the right in the Northern
Hemisphere. The plume of clear
Saskatchewan River water, in the image of the 15th of
June, probably turns right and hugs the shore of Long Point for the
same reason.) The yellow-brown,
silt-laden Red River water mixes only incompletely with the darker Winnipeg
River water, so that their passage northward is marked by two distinct bands of
colour in this image.
12:55 1 July 2005 South
Basin, 1 July……..……….2 July 2005
This
is the first reasonably clear day over Lake Winnipeg in the last couple of
weeks. As you can see, the South Basin
is much more generally turbid than in the last previous clear image on the 15th of June. This won’t be news to Manitobans, but for the
rest of you, the three major rivers tributary to the lake – the Red, the
Winnipeg and the Saskatchewan – are all running at or near record high flows
for this time of year. Not as high as
record spring floods, but in the case of the Red, still very high – at 2200 cu
m/s almost double the previous July record flow of 1200 cu m/s, and more than
half the1997 flood peak of 4250 cu m/s.
Since the loading of nutrients into Lake Winnipeg is very much a
function of inflow, this year may see more nutrients carried from the watershed
into the lake than any year since 1997.
We can expect consequences in the form of continuing intense algal
blooms for several years to come.
http://www.gov.mb.ca/waterstewardship/water_info/index.html. And for historic perspective, they have a
link to Environment Canada’s water data site with its complete data
archive.
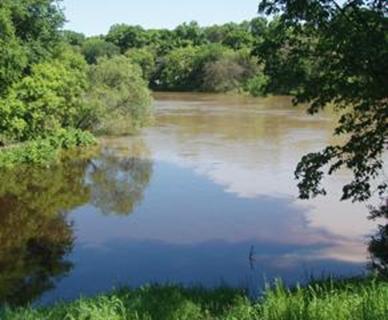
12:15 21 June 2005 14:35
15 June 2005
The
plumes in the North Basin of Lake Winnipeg are less distinctly drawn by the 15th
compared to the 30th of May but
the distribution of clear, turbid and brown waters that was set up more than
two weeks ago is still evident today. No
one who lives along the Red or Assiniboine Rivers, which are both flowing at
near flood stage, should be surprised at the turbid brown patch at the south
end of the lake. That’s silt-laden river
water spreading out into the South Basin.
The picture on the left is of
a muddy Assiniboine River water flowing past the smaller Omand’s Creek – taken
this afternoon – the 15th of May.
The colours are something like what you see in these images of Lake
Winnipeg – brown silt-laden water on upper right – the Assiniboine River – and
darker water rich in dissolved organic material on the lower left – Omand’s
Creek. The Portage Diversion was opened
on the 13th, diverting part of the Assiniboine River into the south
end of Lake Manitoba. You can see a
small plume of turbid water in the south end of that lake as well, although
much less impressive than on Lake Winnipeg.
Discharge from the Red River into Lake Winnipeg today will have been at
least 10X that flowing into the south end of Lake Manitoba, 800-900 cu.m./s in
the Red compared to 80 through the Portage Diversion.
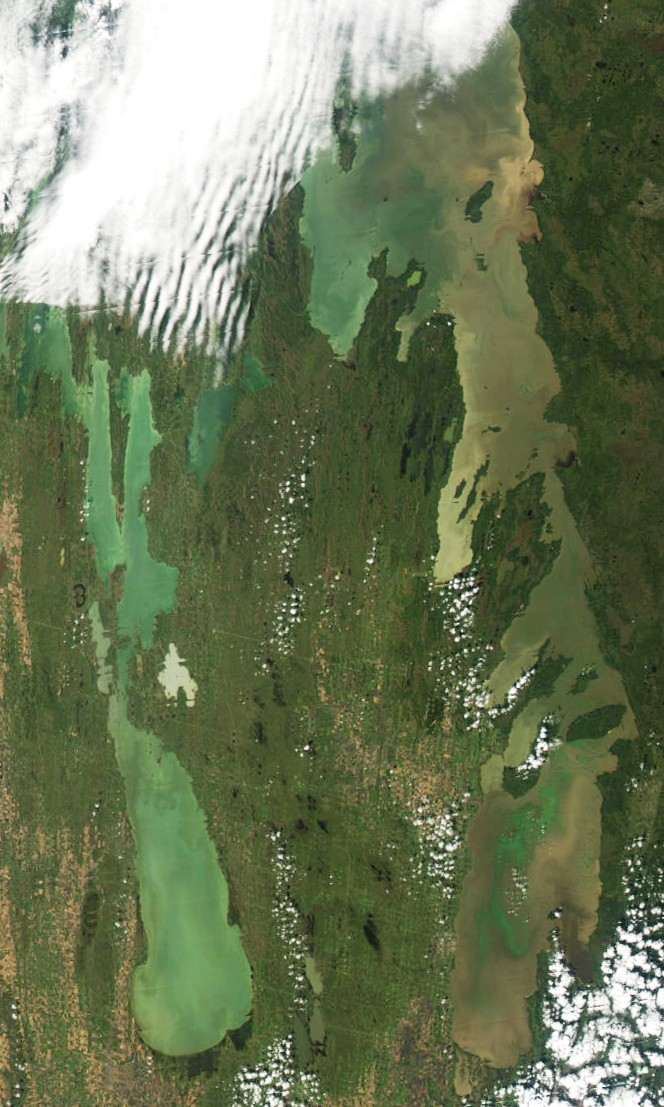
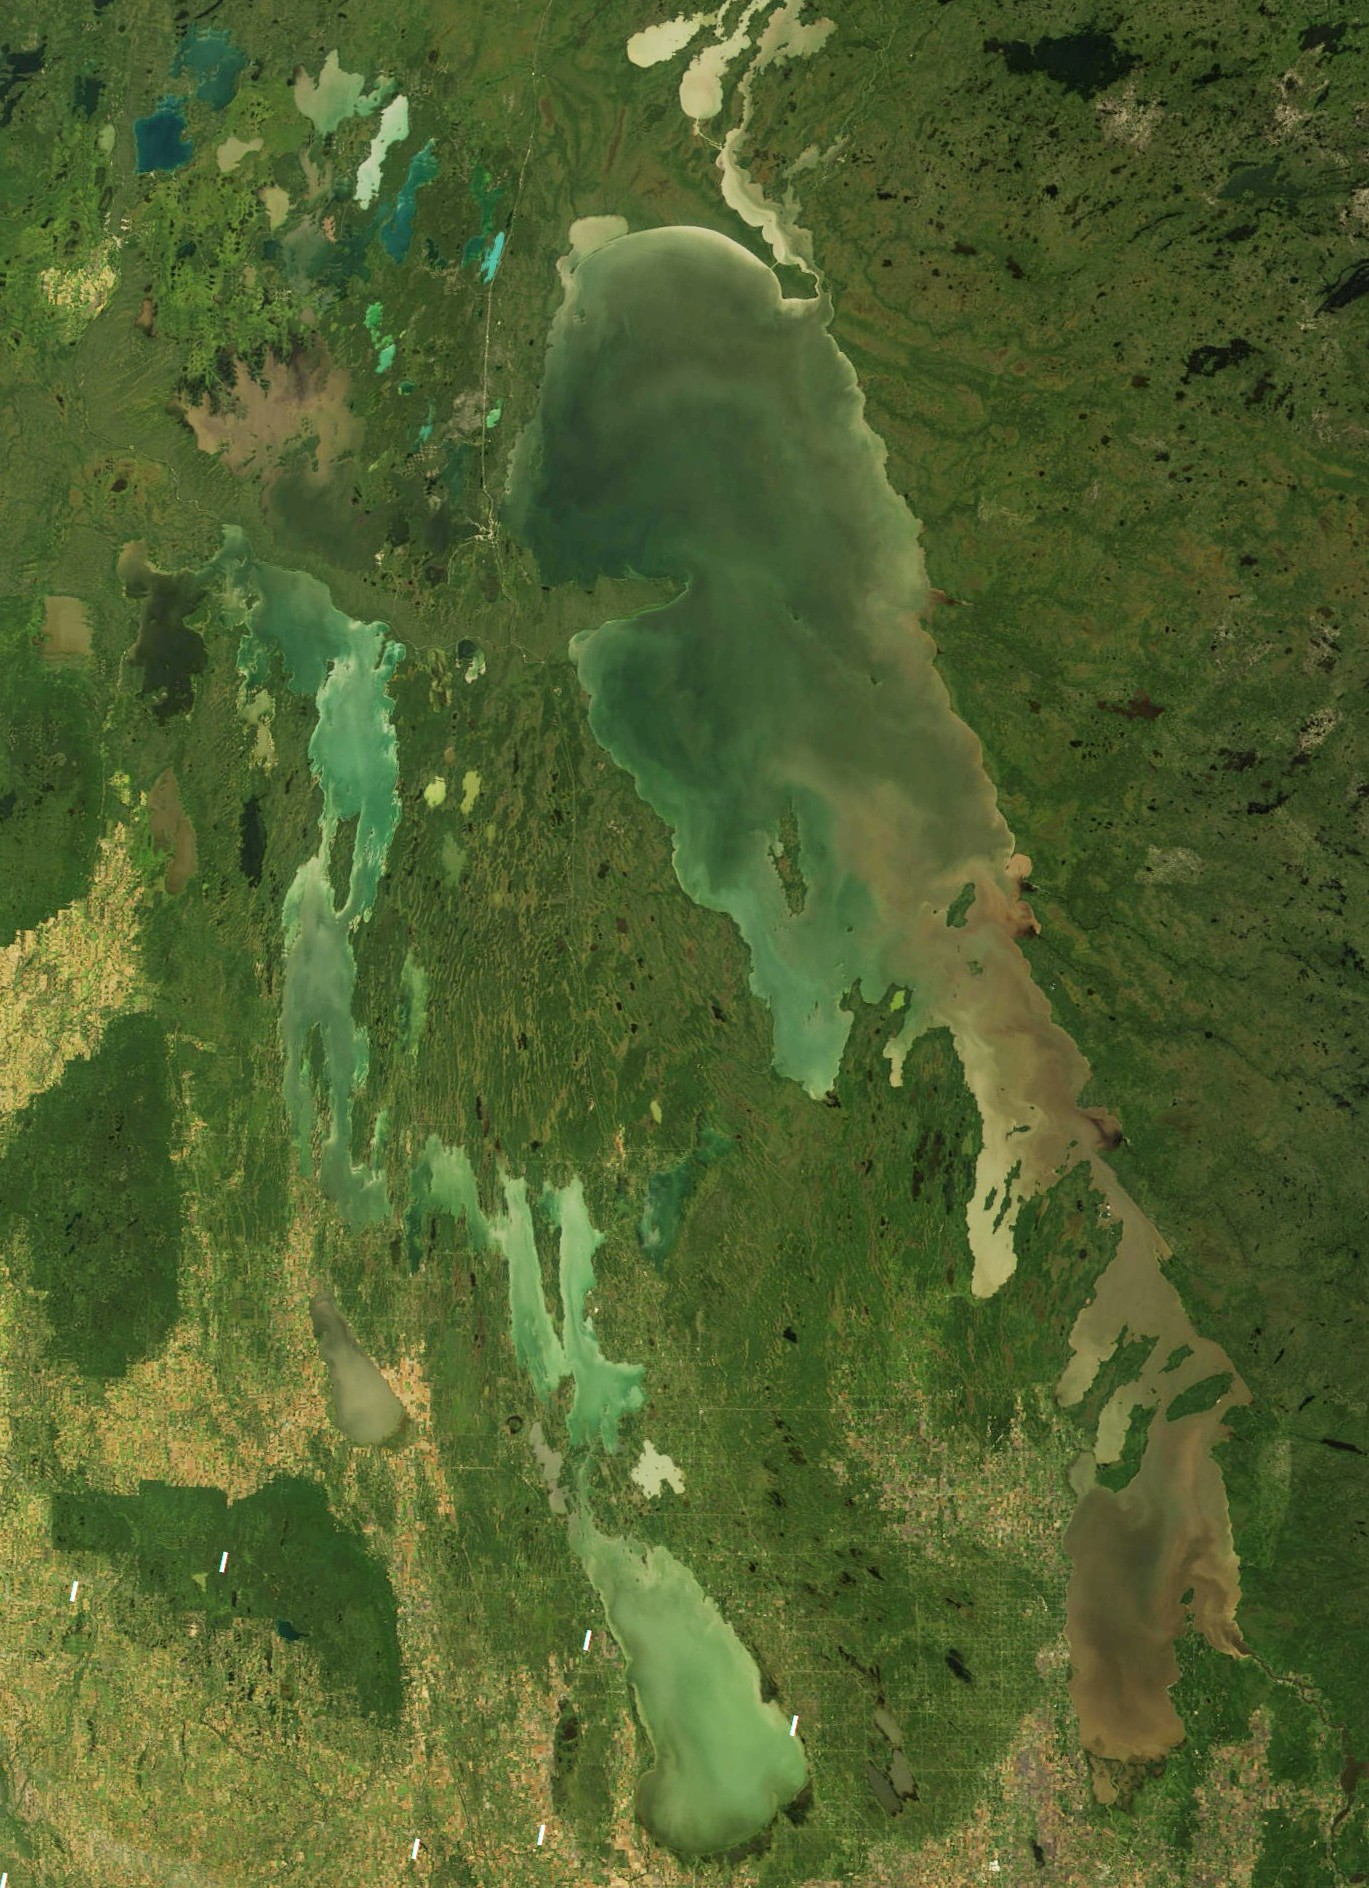
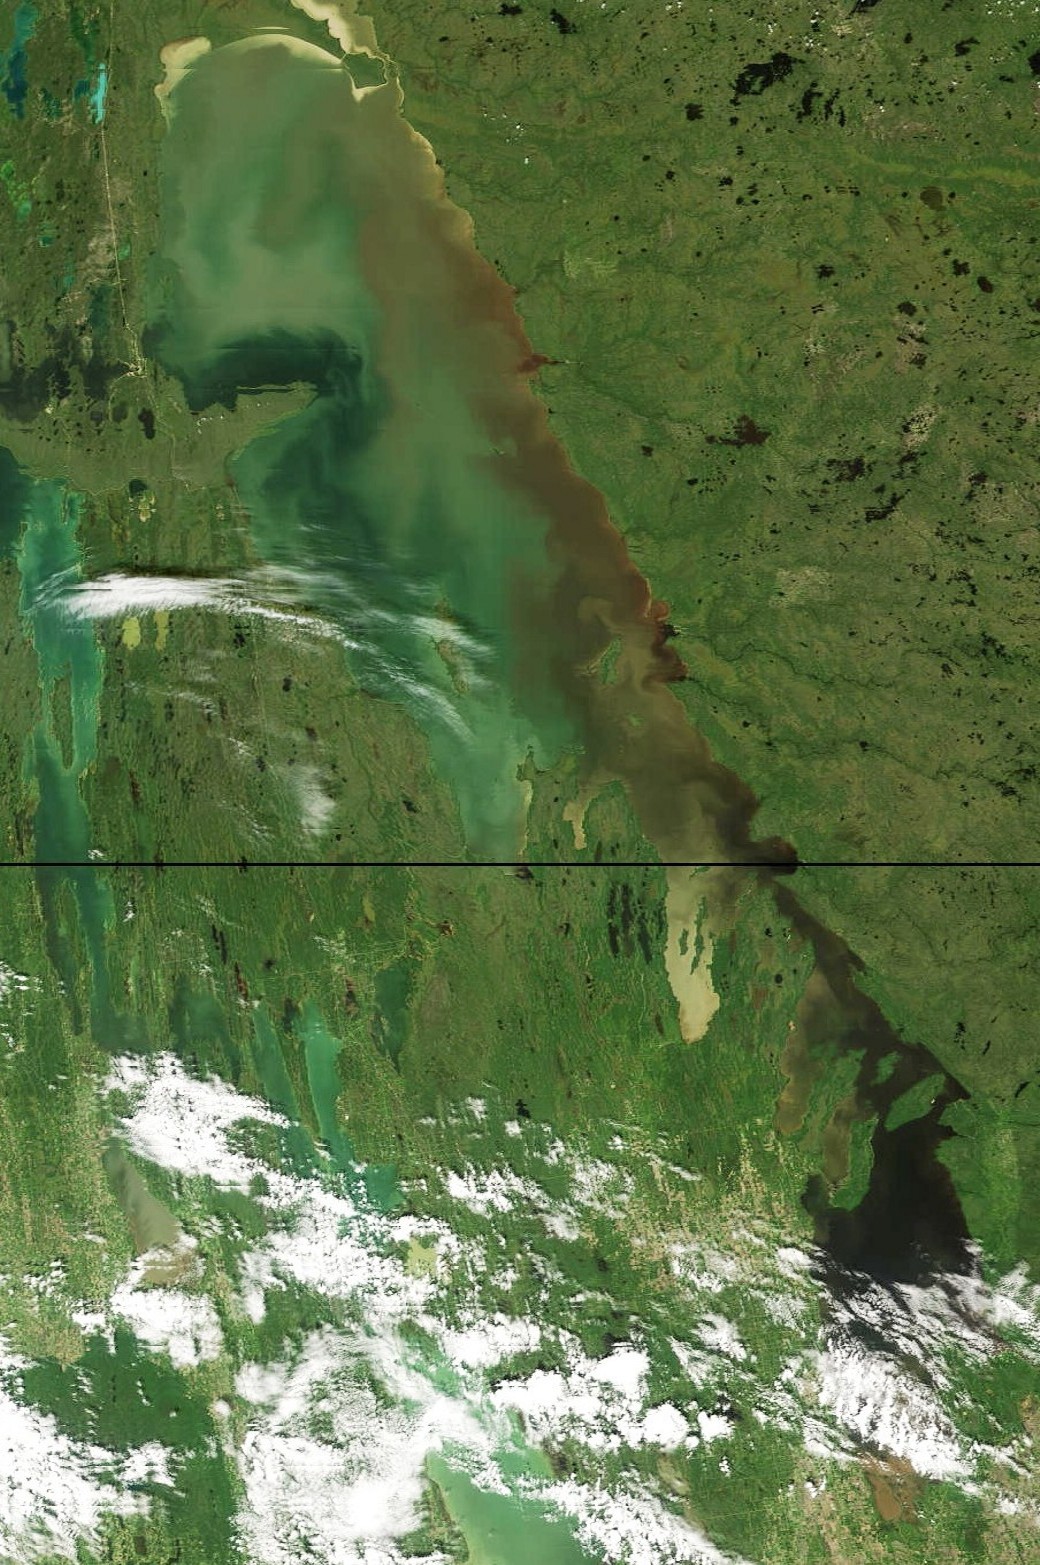
12:55 30 May 2005 This image is remarkable for the strong
colour contrasts in the water circulating in great plumes in the North
Basin. Turbid Red River water is
spreading up along the eastern shore of the South Basin. There will be a lot more of that in coming
weeks as the Assiniboine and Red swell from last week’s rains. Along the east shore of the North Basin, the
rich red brown signifies a large contribution from rivers draining extensive
wetlands on the Shield—they must be flowing high as well – and carrying a high
concentration of dissolved organic material – water the colour of dark
tea. In the north, the flow of
Saskatchewan River water through the lake is especially interesting. Darker (clearer) water flows from the river
mouth (about 10 km north of the north shore of Long Point) first south-easterly
and then easterly along the shore until it is turned to form a great clockwise
(anti-cyclonic) gyre south of the tip of Long Point. You can even see how it gradually entrains
more turbid water from beside or below the path of its flow, becoming gradually
lighter in tone, beginning from the darkest water in the eastern basin of the
Grand Rapids reservoir. The yellow-brown
tones in the western reservoir signify the heavy load of silt picked up in the
shallows that were the sub-aerial delta of the Saskatchewan before the water
was raised the behind the dam 40 years ago.
The water over the old delta is very shallow, the vegetation is long
gone, and river flow or the slightest winds bring old delta sediments up into
suspension from the bottom. But they
must be of relatively coarse silt, and not of finer clays, because they are not
carried far into the reservoir (mostly in a plume along the south shore, and
only a dozen km or so) before they settle out again, leaving the eastern end of
the reservoir clearer than the Lake Winnipeg water into which it drains. The Grand Rapids reservoir, then, is a huge
filter removing suspended sediments from the river before it flows into the
lake.
12:25
11 May 2005 14:25
16 May 2005 13:00 20 May 2005
Note
the bright tan water along the north shore – evidence of erosion of the high
permafrost-clay banks there. According
to the record at Berens River, winds blew southerly at 10-20 km/h for several
hours before the image was recorded. And
down at the south end, the Red River water flowing into the lake today appears
to be clearer – to have less suspended material in suspension – than the South
Basin water it is flowing into. On Lake Manitoba you can still see a remnant of
the silt-laden Assiniboine Diversion water that spread into the lake a few
weeks ago (2 May 2005) – a thin yellow-brown
diagonal streak running down the centre of the southern basin.
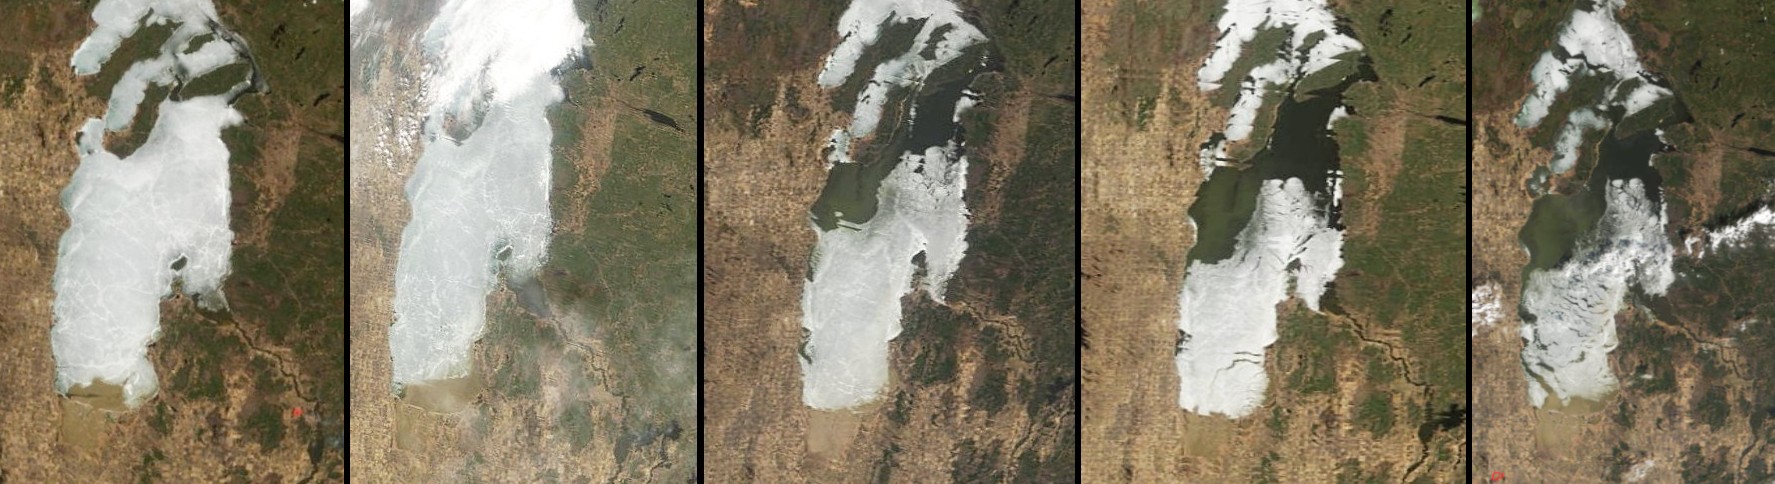
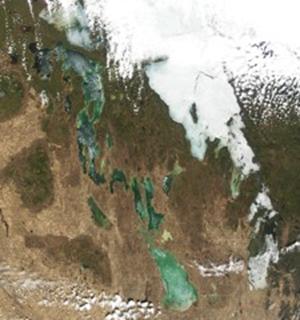
Frances Russell asked me if I had any thoughts on why was break-up
on the South Basin was so early this year, given the miserably cold late
April? That made me look back at my own data more closely. The break-up on the South Basin by 22 April
this year was not quite the earliest ever.
Records kept by the Environment Canada weather observer at Gimli
indicate that from 1946-91 the earliest date that the South Basin was fully
ice-free was 28 April. I’m not sure
about more recent observational records by people on the lake, but from
inspection of satellite images, the South Basin was almost half clear of
ice on 15 April 1998, and there was no ice visible in the next cloud-free
image on 23 April -- so that it was most probably free of ice a few days
earlier than this year. It was close in 2000 as well, 77% ice-free on 22
April and fully clear in the next cloud-free image, on the 26th.
 As to why break-up would
have been so early this year: The graph to the left shows the
relationship between the April mean air temperature recorded at Gimli and the
"half-clear" dates for the South Basin. (“Half-clear” – the
date when roughly half the ice surface has melted – is easier to pick from
satellite images than the last day of ice out.
The last day is as easily as not sometime in a string of cloudy days.)
April mean temperature is a good predictor of the half-clear date except for
five odd years: 1996 – later than the general trend; 1995,
1998, 2000 and 2005 – earlier. Statistically, vernal warming
predicts 62% of the timing of break-up, and something else accounts for
wide swings from that trend. The April warming pattern itself may be part
of it. This year, early April was relatively warm, late April unusually
cold – so that the melt got an early start, even though the warming seems
to have stalled. Snow-covered ice reflects roughly 90% of solar
radiation, water absorbs 90%. Even a little bit of open water would have
multiplied the effect of what little warming sunlight we had in late
April. Plus, this spring there were strong winds that
certainly pushed the ice about, physically breaking up the floes.
That quickly added to the fraction of open water -- you can see that in the series of South Basin satellite images.
Then too, the time it takes to melt the ice cover is a function
of how thick it is at the beginning of the melt period. During
a relatively warm winter it won't grow as thick as during a colder winter.
1998 and 2000 – two outliers on the attached graph – were two of the
warmest since 1987. But certainly a warm winter is not this year's
explanation! However, if the ice had a thick insulating blanket of snow
all through the winter, that might accomplish the same. Last December we
had unusually high snowfall. More insulation, less heat loss from the ice
and water below, hence a thinner ice sheet at the beginning of April.
So a thinner ice cover (possibly – I have no
measurements) due to an insulating snow cover, a little water opened
up by a bit of early April melt and then wind to dramatically enlarge that
open area so that what warmth the sun did give could be absorbed into the water
column – lots of possible reasons for an early break-up in spite
of a miserably cold late April.
As to why break-up would
have been so early this year: The graph to the left shows the
relationship between the April mean air temperature recorded at Gimli and the
"half-clear" dates for the South Basin. (“Half-clear” – the
date when roughly half the ice surface has melted – is easier to pick from
satellite images than the last day of ice out.
The last day is as easily as not sometime in a string of cloudy days.)
April mean temperature is a good predictor of the half-clear date except for
five odd years: 1996 – later than the general trend; 1995,
1998, 2000 and 2005 – earlier. Statistically, vernal warming
predicts 62% of the timing of break-up, and something else accounts for
wide swings from that trend. The April warming pattern itself may be part
of it. This year, early April was relatively warm, late April unusually
cold – so that the melt got an early start, even though the warming seems
to have stalled. Snow-covered ice reflects roughly 90% of solar
radiation, water absorbs 90%. Even a little bit of open water would have
multiplied the effect of what little warming sunlight we had in late
April. Plus, this spring there were strong winds that
certainly pushed the ice about, physically breaking up the floes.
That quickly added to the fraction of open water -- you can see that in the series of South Basin satellite images.
Then too, the time it takes to melt the ice cover is a function
of how thick it is at the beginning of the melt period. During
a relatively warm winter it won't grow as thick as during a colder winter.
1998 and 2000 – two outliers on the attached graph – were two of the
warmest since 1987. But certainly a warm winter is not this year's
explanation! However, if the ice had a thick insulating blanket of snow
all through the winter, that might accomplish the same. Last December we
had unusually high snowfall. More insulation, less heat loss from the ice
and water below, hence a thinner ice sheet at the beginning of April.
So a thinner ice cover (possibly – I have no
measurements) due to an insulating snow cover, a little water opened
up by a bit of early April melt and then wind to dramatically enlarge that
open area so that what warmth the sun did give could be absorbed into the water
column – lots of possible reasons for an early break-up in spite
of a miserably cold late April.
13:00 5 May 2005
14:45 5 May 2005
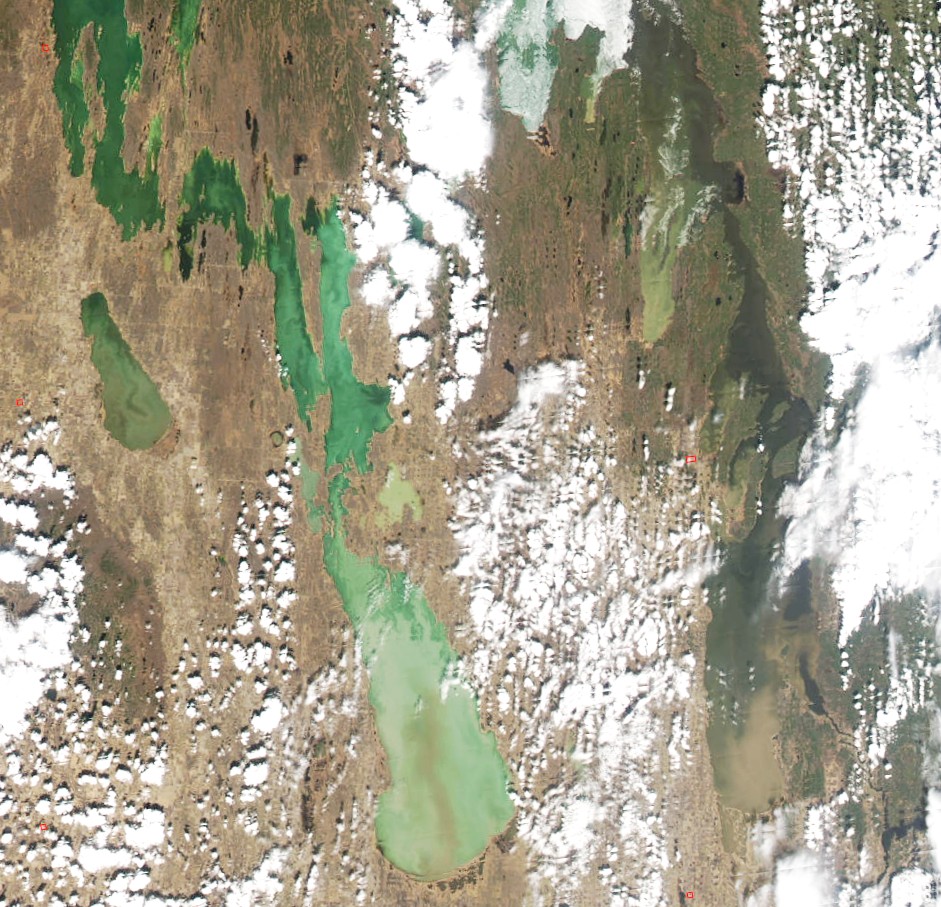
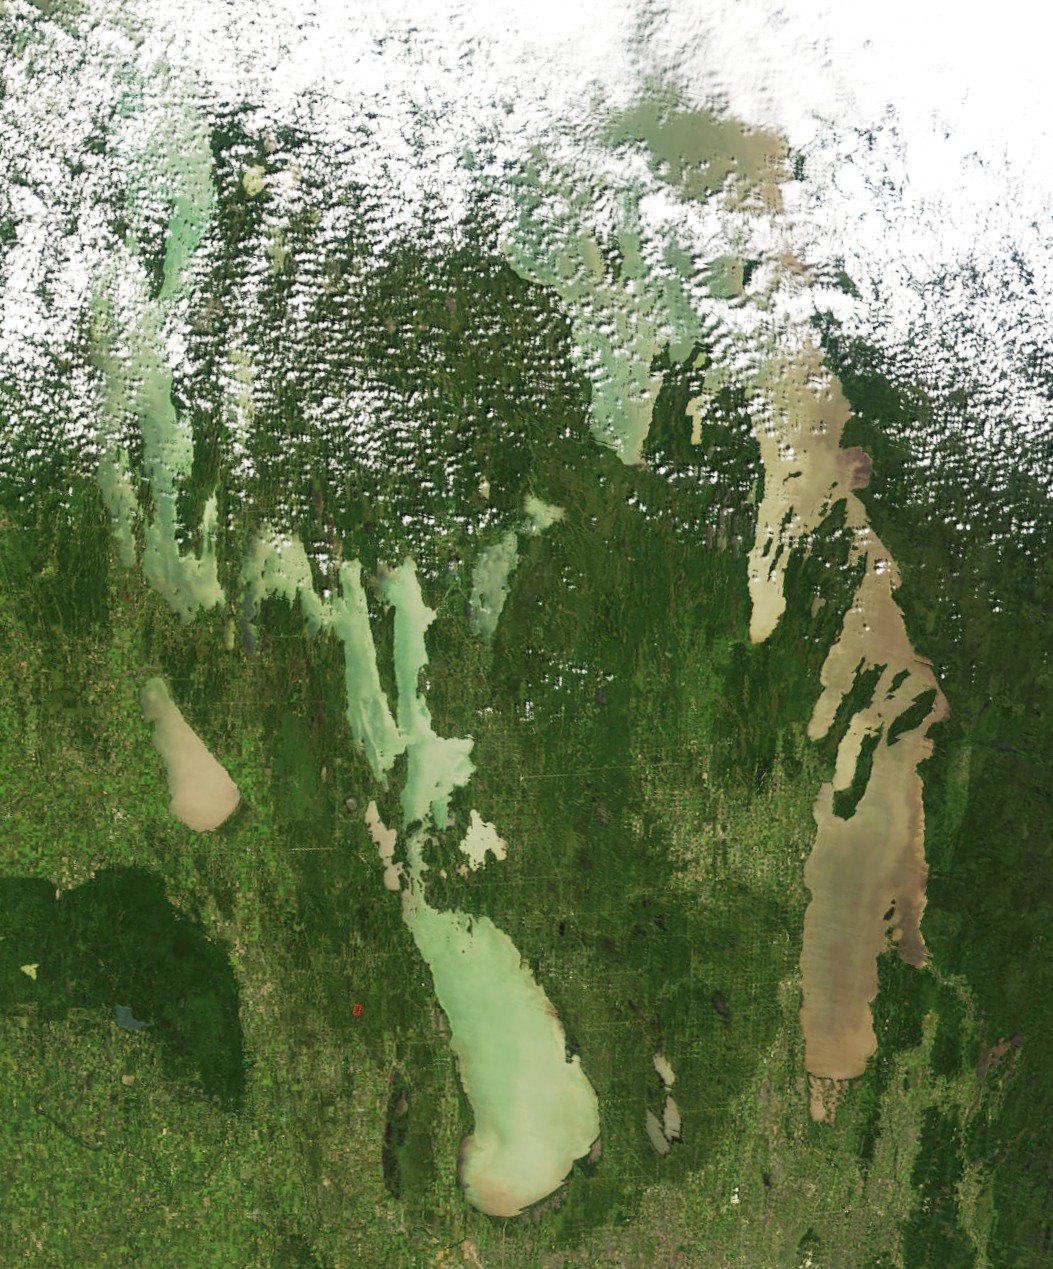
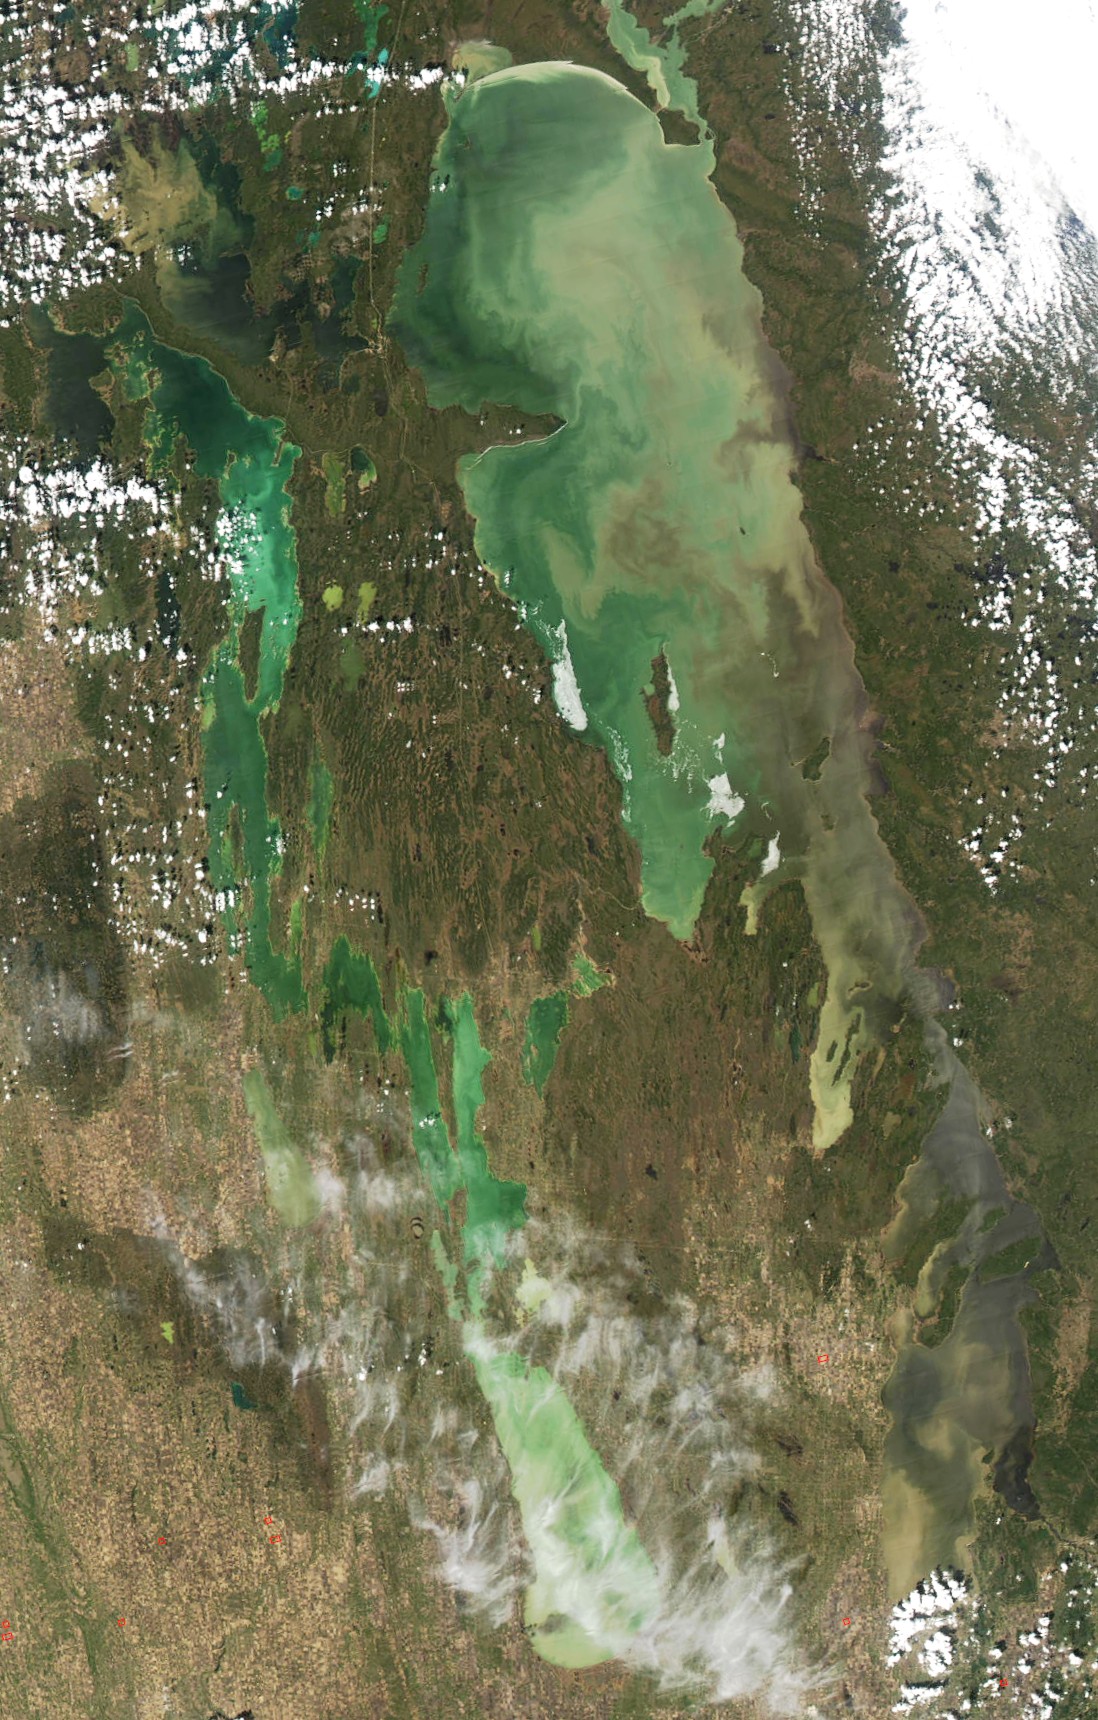
12:30
2 May 2005 In spite of the colder
weather this last week, much of ice cover has been cleared from the North
Basin. Some interesting features on this
image: Grand and Hillside Beaches in
South Basin are bright white. Is that
snow left from yesterday, or remnants of ice pushed up onto the beaches during
the frequent northerly blows over the last couple of weeks? You can see the same thing on several
north-facing shores at the south end of the North Basin. Muddy brown Red River water has spread
through much of the southwestern South Basin, and the clearer (darker) Winnipeg
River water has created a plume through much more turbid water in Traverse
Bay. The turbid plume of Assiniboine
River water has spread northward far into Lake Manitoba from its source at the
mouth of the Portage Diversion. A couple
of other things: there is a beautiful
anti-clockwise (cyclonic) gyre of turbid water where the Saskatchewan River
water is flowing into Cedar Lake. And
what are probably whitings – areas of calcite precipitation – has created a
huge milky plume in Lake Winnipegosis.
And snow patterns in the south and west are interesting. It snowed yesterday and the day before, and
is melting today. You can see it hanging
on longer in forested parks (compared to the open fields around them) west of
the lakes. And south of Dauphin Lake and
Lake Manitoba – long bands of snow on the ground that must have been generated
by lake-effect precipitation – that is, precipitation from air masses that
picked up moisture blowing across the relatively warm lake surface. If you want to know more, check out http://www.x98ruhf.net/lake_effect.htm
for a description of the process as it applies to the east shores of Lake
Michigan.
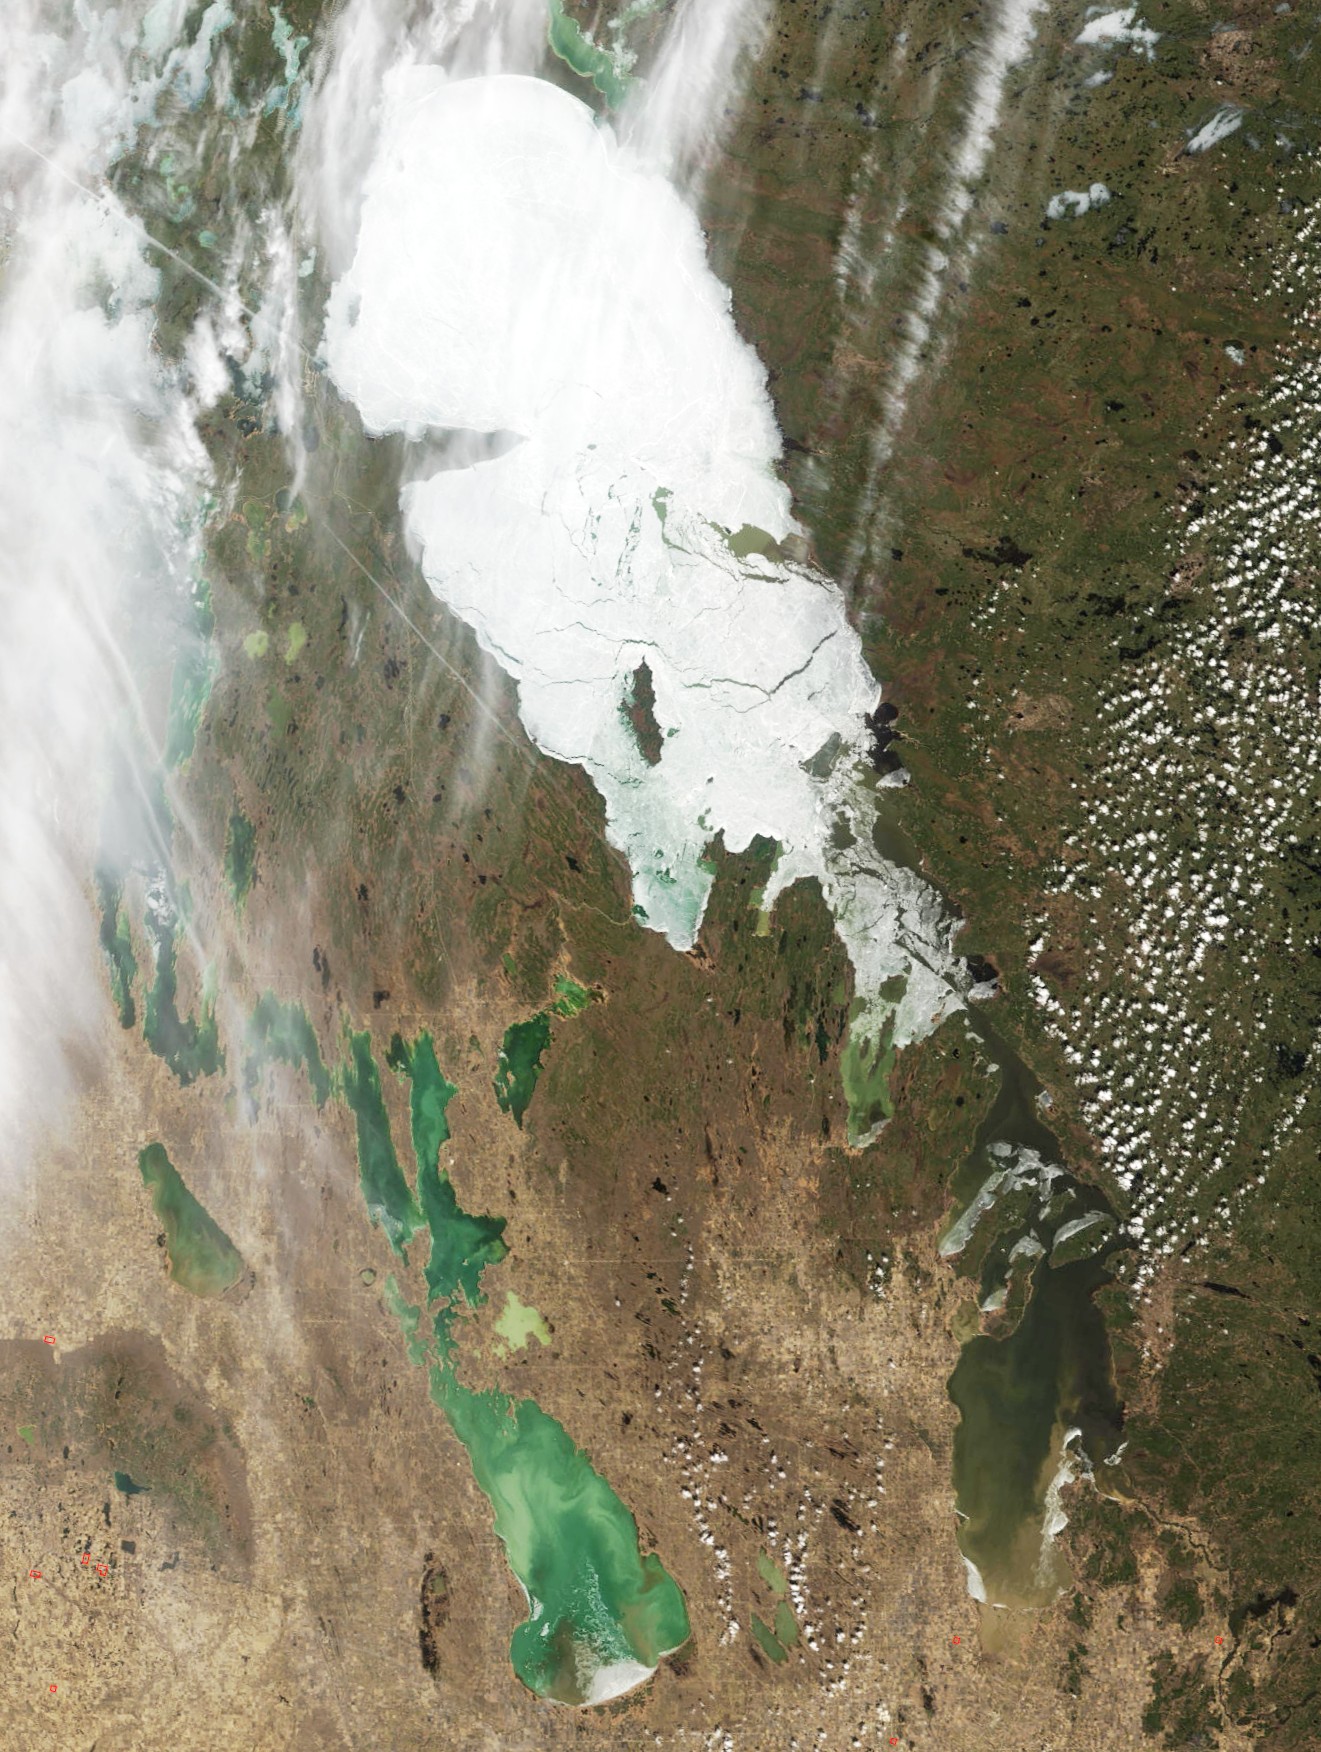
12:35 23 April 2005 Most of the remaining ice was cleared from
the South Basin over the last two days.
Although it hasn’t been particularly warm, it has been windy – all of
the remaining ice in the basin is pushed up against southern shores – note
especially the packs lying along the shores of Hecla and Black Islands, and
Grindstone Point. The winds have opened
more and broader leads in the North Basin as well, and dark water from the
Bloodvein and Berens Rivers has contributed to melt in the bays at the mouth of
each river. Take a look, too, at the
muddy plume of water visible in Lake Manitoba now that the ice has
cleared. That’s water from the
Assiniboine via the Portage Diversion, which is still flowing strong.
13:00
19 April 2005
12:50 21 April 2005
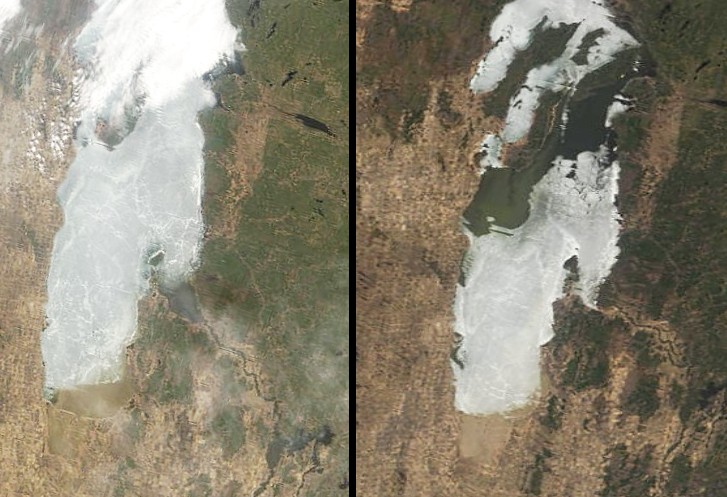
I
wrote a couple of days ago that cooler weather might slow down the break-up and
melt process, but that hasn’t happened – certainly not on Lakes Winnipegosis
and Manitoba. The ice pack is everywhere
rotten on both lakes and won’t last long now.
And on the South Basin of Lake Winnipeg, the ice that was pushed south
on the 18th and 19th has already begun to melt away (see
also the strip of South Basin images below, images from the 16th
through to the 21st). The
heat carried into the lake by the Red River, still flowing strong, must be
having a significant effect on melt around its mouth. The remaining pack is full of broad leads
that will warm quickly in this sunny weather (they reflect less, hence absorb
more sunlight) and hasten the melting of the remaining cover on the South
Basin There is a lot more open water
today in the bays along the west side of the Narrows as well, and even in
Sturgeon Bay south of Reindeer Island leads have formed, likely due to the great
force of the same northerly winds that shifted the ice in the South Basin.
The
north end of the South Basin was opened up (compare the two images from the 18th and 19th)
by the strong northerly winds – 30+ km/h gusting to over 50 – that blew through
the afternoon of the 18th and on through the night. Ice was pushed south – note how much smaller
is the open region around the mouth of the Red River on the 19th
compared to the day before. In fact, it
looks as if the pack was actually pushed over the beaches east of Matlock –
that is, in the southwest corner, over the spit separating the south end of the
lake from the Netley Marshes. Ice melted
off much of Fisher Bay – a shallow bay along the west side of the Narrows. Also over a large area around the outlet near
Warrens Landing. The strong winds must
have shifted ice in the North Basin, too.
There was an open lead on the 19th, stretching in a long arc
from the north end of Reindeer Island up to George’s Island, that wasn’t
visible three days before, on the 16th of
April – presumably also a result of the strong winds through
yesterday and last night. Lake Manitoba
and even parts of Lake Winnipegosis are quickly being cleared of ice as well –
though cooler weather forecasted may slow that down.
South Basin 16, 18, 19, 20 & 21 April 2005
The
light brown, silt-laden water of the Red River can be seen spreading into the
South Basin on the 16th.
There is open water, too, in Traverse Bay at the mouth of the Winnipeg
River, but it appears very dark in this image.
The Red River water is the colour of the light reflected from the silt
and clay in its water; the Winnipeg River is much clearer, and absorbs most of
the light that falls on it; hence, it appears dark in this image. Note, too, that there is open water in the channels
between Hecla and Black Islands and between Black & Deer Islands and the
east shore. The ice cover cleared first
from these channels because water ebbing back and forth through the channels
was just warm enough to erode it from below.
Click here to see an image of the
whole lake on the 16th of April.
Though I am studying the geography of plankton on Lake
Winnipeg, it’s not supposed to be my only focus just now. Should you be interested, you can link here to a site describing my PhD research
on sedimentation by the Linthipe River in Lake Malawi.