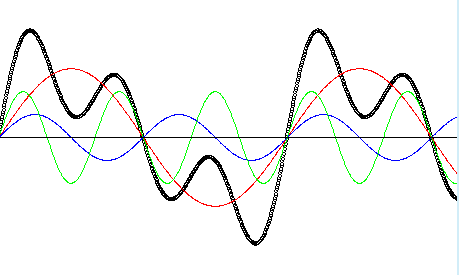
Consider a complex wave that results from adding together three simple waves:
If we're interested in studying the examining the properties of the simple waves, we could always diagram all of them separately, like so:
wave A: 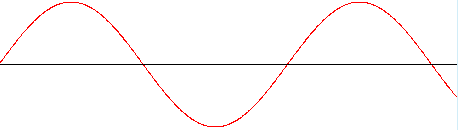
wave B: 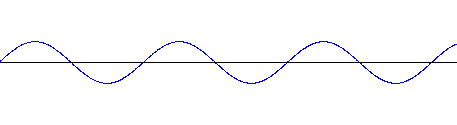
wave C: 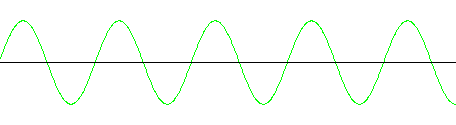
Yuck, that's a mess. What if a complex wave had a hundred simple waves in it?
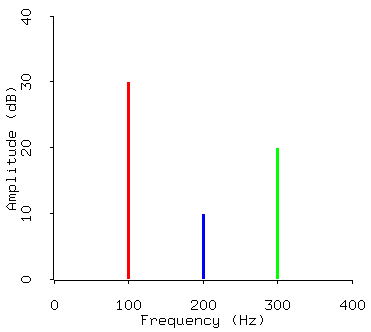
Fortunately, we don't care what each simple wave is doing at each moment in time. The only things we really care about for each simple wave are its frequency and its amplitude. For the complex wave we've been talking about, those are:
| wave | frequency | amplitude |
|---|---|---|
| A | 100 Hz | 30 dB |
| B | 200 Hz | 10 dB |
| C | 300 Hz | 20 dB |
A spectrum diagram summarizes this information visually. Each simple wave is represented in a spectrum diagram by a vertical line. The horizontal position of the line represents the frequency of the simple wave, and its height represents the amplitude: