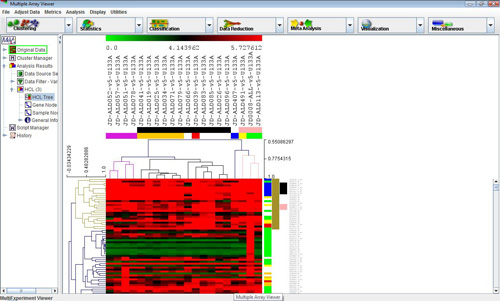
Hierarchical tree with clusters selected
(Eisen et al. 1998)
Selecting this analysis will display a dialog that allows different linkages and options to cluster genes, samples or both. Once the computations are complete, select the nodes Analysis->HCL->HCL Tree to view the hierarchical tree. The display is similar to the main display, but similar genes and experiments are connected by a series of ‘branches.’ Labels are displayed on the right side.Clicking under a branch intersection (node) will select that node and the subtree below that node. Once selected, right clicking in the same area will display a popup menu that allows the user to set the highlighted area as a cluster, name the cluster, save the cluster and set several tree options. Clusters set and named in this display can propagate to other displays. Saving a cluster will display a dialog where a tab delimited text file containing the data for the highlighted cluster can be named. The algorithm also produces a Node Height Graph which displays the number of terminal nodes in the tree given a particular inter-node distance threshold.
These checkboxes are used to indicate whether to cluster genes, samples, or both.
These checkboxes are used to indicate whether the ordering of the leaves will be optimized for genes, samples or both.
This menu is used to indicate the distance metric that will be used in calculating the tree. The default distance metric is Euclidean.
This parameter is used to indicate the cluster-to-cluster distances when constructing the hierarchical tree.
Single Linkage: The distances are measured between each member of one cluster and each member of the other cluster.
The minimum of these distances is considered the cluster-to-cluster distance.Average Linkage: The average distance of each member of one cluster to each member of the other cluster is used to measure the cluster-to-cluster distance. Note that this option in MeV actually is determined by a weighted average of distances of cluster members. Example: Consider the distance from node ‘d’ to cluster (a,b,c)…
Unweighted Average Linkage:

Weighted Average Linkage:

Nodes are weighted unequally where nodes deeper in the sub-tree contribute less to the overall computed distance.
Complete Linkage: The distances are measured between each member of one cluster and each member of the other cluster. The maximum of these distances is considered the cluster-to-cluster distance.
A right click in the Tree Viewer will produce a menu which includes an option to alter the displayed tree, Gene Tree Properties. This option allows the user to change the tree’s appearance and to reduce the complexity of the tree by imposing a distance threshold. Elements on nodes which have distances below this threshold can be considered as one entity (or cluster).
Consequently, the lower level detail of the tree is ignored. As the value is adjusted, the corresponding HCL tree will have nodes below this threshold appear light gray in color and a translucent 'wedge' from that node to all enclosed elements will be drawn on the tree. This representation of the tree will persist unless the dialog is dismissed by hitting cancel. The distance threshold can be entered into a text field or can be adjusted with a slider over the maximum range of inter-node distances. The number of terminal nodes (clusters) using the current distance threshold is displayed in the upper right quadrant of the dialog.The Create Cluster Viewers option allows you to create viewers based on the distance threshold. This option collects groups of elements falling below terminal nodes in the tree using the current distance threshold. The clusters of elements are represented as nodes in the result navigation tree under the HCL result node. The results are added once the HCL Tree Configuration dialog has been dismissed.
The minimum and maximum pixel distance imposes limits on the minimum and maximum displayed inter-node distance. This alters the appearance of the tree. The Apply Dimensions button causes the entered tree dimensions to be applied to the HCL tree. This allows one to fine tune the tree's appearance without dismissing the dialog.
By default, tree branches are built from the heatmap up towards the root node. Consequently, a node will have branches of differing heights to reach its two children.
To change the tree so that both branches of a node represent the “node height”, check the Use jagged tree structure box. Most branches will no longer reach the heatmap from the terminal nodes.To draw the tree such that the position of every node is exactly the node height, check the Use true branch length structure. Note: For some distance metrics this feature does not display a tree.
MeV 4.4 features a new option to allow users to rotate nodes. Rotating nodes does not affect the tree structure. Nodes will continue to have the same parents and children, but the two subtrees of the selected node will be displayed in reverse order. To rotate a node, left- click to select the node and right-click to select Rotate Selected Node.