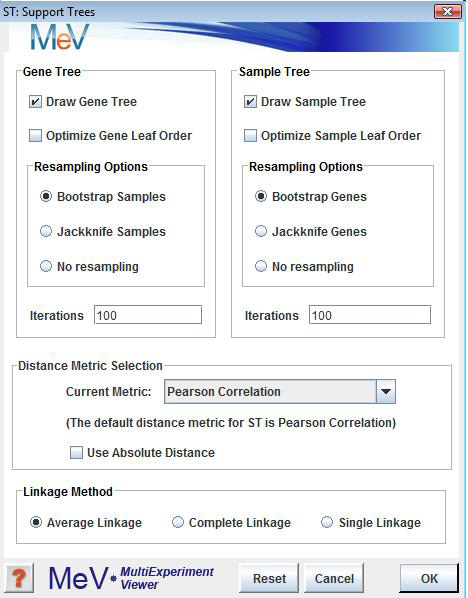
Parameters
The Support Tree algorithm permits the resampling options to be set separately for the gene tree and the sample tree.
Tree Construction Options
The Draw Gene Tree and Draw Sample Tree options allow you to select to construct a gene tree, an experiment tree, or both.
Resampling Options
You can elect to resample either genes or samples or neither using either a bootstrapping or a jackknifing method.
Bootstrapping
The matrix is reconstructed such that each expression vector has the original number of values but the values are a random selection (with replacement) of the original values. Values in the original expression vector may occur more than once since the selection uses replacement.
Jackknifing
Jackknifing takes each expression vector and randomly selects to omit an element. This method produces expression vectors that have one fewer element and this is often done to minimize the effect of single outlier values.
Iterations
This indicates how many times the expression matrix should be reconstructed and clustered.
Linkage Method
This parameter is used to indicate the convention used for determining cluster-to-cluster distances when constructing the hierarchical tree.
: The distances are measured between each member of one cluster each member of the other cluster. The minimum of these distances is considered the cluster-to-cluster distance.
: The average distance of each member of one cluster to each member of the other cluster is used as a measure of cluster-to-cluster distance.
: The distances are measured between each member of one cluster each member of the other cluster. The maximum of these distances is considered the cluster-to-cluster distance.
Support Tree Legend
A legend to relate support tree output colors to % support is displayed by selecting the support tree legend menu item in the main help menu.
