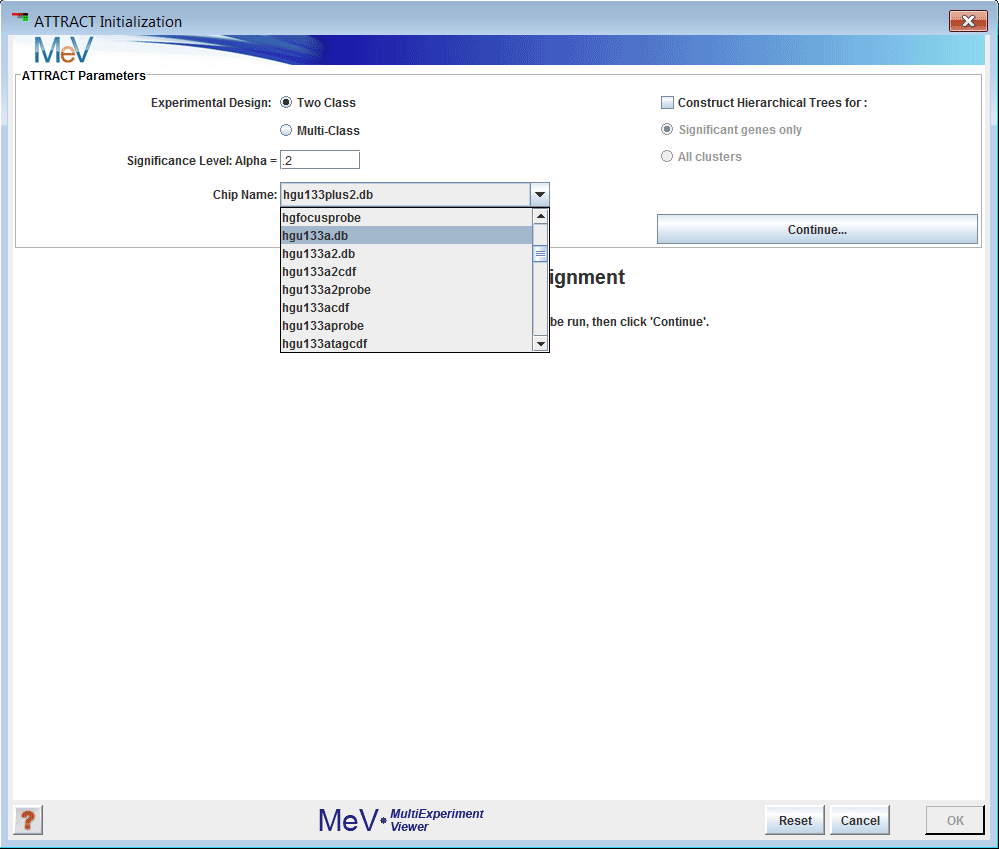
Figure 1: The initialization dialog
(Mar JC, Wells CA, Quackenbush J. Defining an informativeness metric for clustering gene expression data. Bioinformatics. 2011 Apr 15;27(8):1094-100.J. PMID: 21330289.)
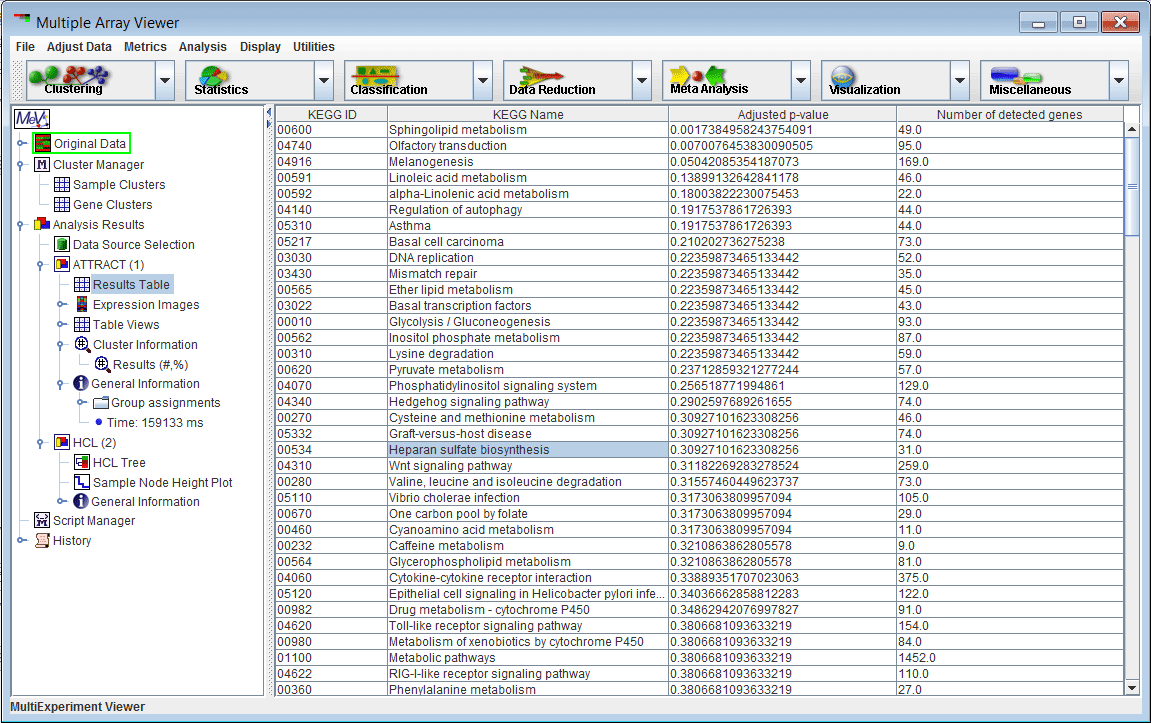
The Attract algorithm identifies the core gene expression modules that are differentially activated between cell types or different sample groups, and elucidates the set of expression profiles which describe the range of transcriptional behavior within each module.
The algorithm assists in understanding expression changes that are specific to cell types or cell fate transitions. A mammalian organism is made up of over 200 types of specialized cells. Each cell type carries out a specific task integral to maintaining homeostasis of the organism. Cell types can vary by morphology, structure, lifespan, functional ability and much more. Different cell or tissue types acquire their diversity by driving differentially coordinated expression patterns through interacting gene networks. The attractor hypothesis proposed by Stuart Kauffman describes how cell fate transitions between cell types occur through coordinated changes in genome-wide gene expression.
The Attract algorithm starts by using downloaded bioconductor chip annotation to identify the set of core pathway modules driving the cell types-specific expression changes. For each of these modules, the algorithm then constructs synexpression groups, which consist of genes with correlated expression profiles. The algorithm is also extrapolates out to identify genes with similar expression profiles which may not be currently annotated in current pathway databases like KEGG.
The Attract algorithm can be used for any expression data set where replicate samples (at least three) have been collected for various cell types or experimental groups such as a panel of drug treatments or a time course experiment. The algorithm is not well-suited for data generated under an experimental design that has only one experimental or covariate group, e.g. samples from 100 identical cell lines with no perturbations.
The Attract algorithm can be roughly divided in to four steps:
Choose the type of analysis you wish to run. Attract supports two-class analysis for comparison of two groups of samples, or multi-class analysis, for comparison of three or more groups.
Choose an alpha cutoff level. This number is a false discovery rate used to remove flat or uninformative genes.
From the drop-down menu, select the name of the microarray platform your data was collected from. This step is very important.
Click Continue to display the Cluster Selector.
If you have previously created clusters of samples using the Cluster Manager or another MeV module, they will be displayed here, as in Figure 2. Use the drop-down menus on the right-hand side of the Cluster Selector to assign your sample groups to analysis groups for Attract. You can assign more than one sample group to an analysis group. You can also use the tab shown in Figure 3 to achieve the same. Group1 and Group2 symbolize B-ALL and T-ALL. You can save these grouping using the button. To load saved groupings, use the button. button will clear all your choices. Click the button to run Attract.