COA: Correspondence Analysis
(Fellenberg et al. 2001, Culhane et al. 2002)
Correspondence analysis is an explorative method to study associations between variables. Like principal components, it displays a low-dimensional projection of the data. However, in this case, both genes and samples can be projected onto the same space, revealing associations between them.
Correspondence analysis requires an expression matrix with no missing values. Therefore, any missing values have to be imputed first. We use the k-nearest neighbors algorithm to impute missing values. The only user input in the initialization dialog is the desired number of neighbors for imputation.
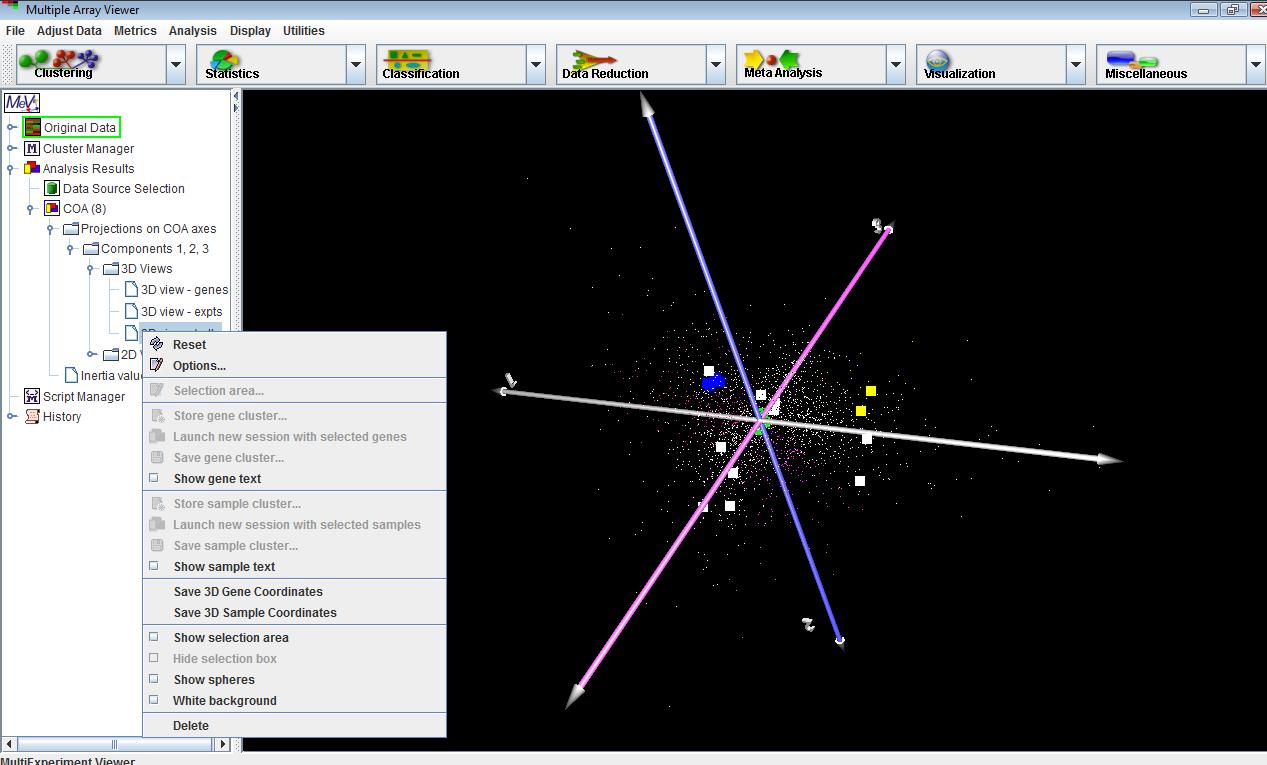
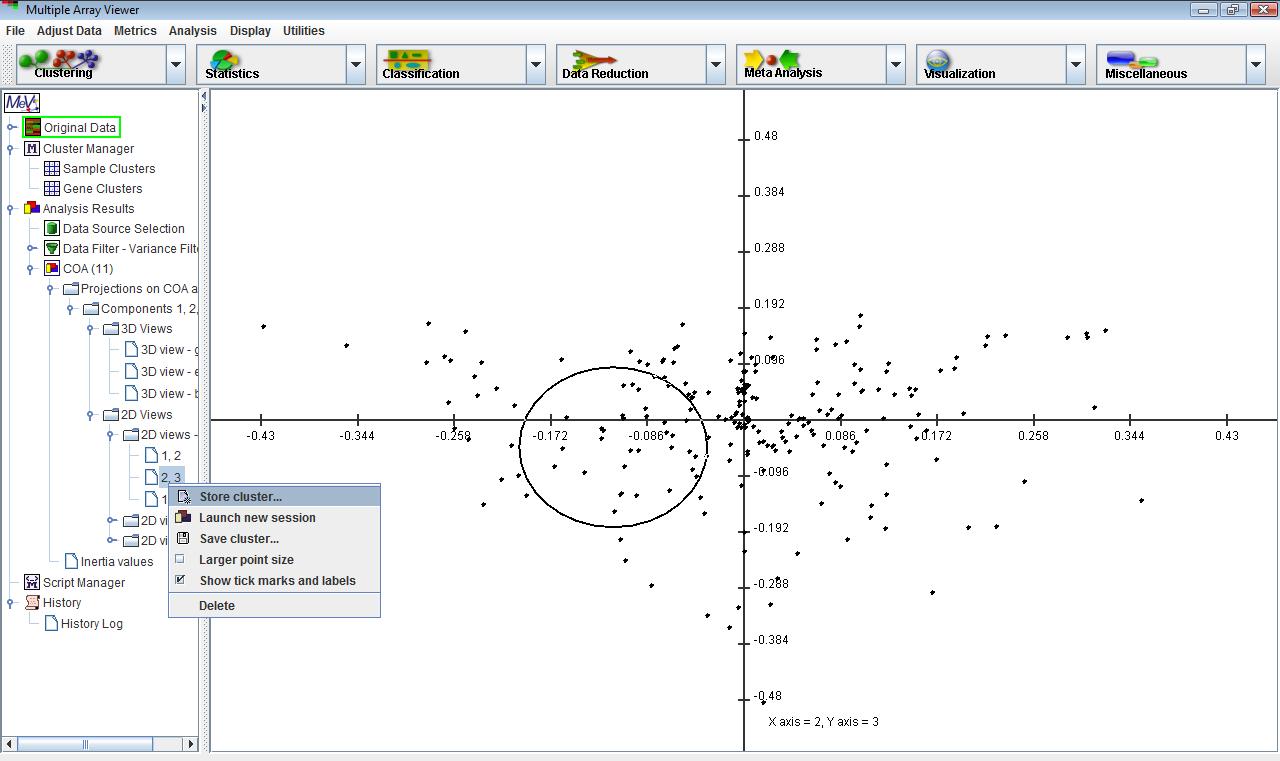
The displays in this module are very similar to the PCA displays, except that 2D and 3D plots are shown for genes and experiments separately as well as together on the same plot. Menus for creating new plots, selecting data points and customizing displays are available from the corresponding nodes on the navigation tree just as in PCA.
Genes that lie close to one another on the plot tend to have similar profiles, regardless of their absolute value. The same is true for samples. If some genes and samples lie close to one another on the plot, then these genes are likely to have a high expression in the nearby samples relative to other samples that are far away on the plot. On the other hand, if a set of genes are on the opposite side of the plot from a set of samples relative to the origin,
then the expression of that set of genes is likely to be depressed in those samples relative to samples that might be positioned close to those genes. The farther the points are from the origin, the stronger the association between genes and samples.Correspondence analysis works by decomposing a matrix of chi-squared values derived from the rows and columns of the expression matrix. The first two or three axes are the most informative in showing associations among genes and experiments. The amount of information explained by a given axis is quantified by its inertia, which may be thought of as the proportion of the total chi-squared value of the matrix explained by that axis. The inertia values are provided under the corresponding node under the main COA analysis node.


