Loading MeV (.mev) Format File
MeV can interpret files of several types, including the MultiExperiment Viewer format (.mev), the TIGR ArrayViewer format (.tav), the TDMS file format (Tab Delimited, Multiple Sample format), the Affymetrix file format, and GenePix file format (.gpr). See section 4 for details regarding the different file formats.
In addition to being formatted correctly, the input data should already be normalized. Using normalized data as input will result in more statistically valid output. MIDAS, a member of the TM4 software suite, is one program that can do this normalization.
Select from the menu to launch the file loading dialog. At the top of this dialog, use the drop-down menu to select the type of expression files to load by choosing Use this browse button in the panel to locate the files to be loaded.
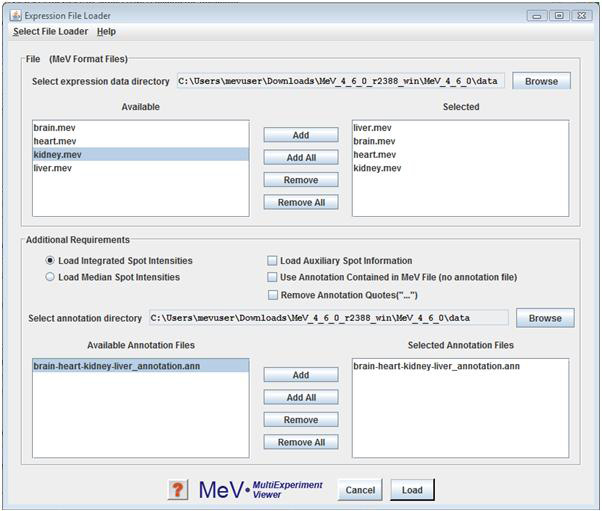
The default file type to load is the .mev file. This file type is an update of the older .tav file format. Details about this file format can be found in the appendix (4.4). In the section of the loader labeled “MeV Expression Files (*.mev),” the contents of the folder selected in the file selection dialog box will be displayed in the box labeled “available”. Select the .mev files to load and click the “add” button to add them to the list of files to be loaded. Similarly, select the file(s) containing the appropriate annotation information in the section labeled “MeV Annotation Files (*.ann, *.dat).”
The options specify that MeV should load either integrated intensities (default) or Median intensities. Note that care should be taken to select the intensity measurements, integrated or median, that has been previously normalized in MIDAS so that the loaded data will have been normalized and possibly trimmed.
The option will load spot background, spot pixel count and other spot specific items. Loading this information will not impact the analysis results but will allow you to view this data when clicking on an expression element. The this spot information since it consumes significant system memory and can severely limit the number of mev files that can be loaded due to memory constraints.
The option overrides the use of an annotation file by loading annotation that is contained within the MeV file. This is a specialized case and for ease of annotation updates it is suggested that you adhere to using a separate annotation file even if the mev file contains annotation.This option is off by default.
The option removes quotations from annotation fields where the annotation entries start and end with quotation marks. This option is provided to counteract the behavior of some popular ‘spread sheet’ programs where cells containing text with a delimiter such as a comma are automatically enclosed by quotation marks. If MeV stalls on loading an annotation file, try loading it with this option selected.
To load .tav-formatted files, use the drop-down menu to select the option. This loader is very similar to the .mev loader. Use the browse button in the panel to select the .tav files to load. Instead of selecting annotation files to load alongside the data files, however, you must select a preferences file. This preferences file contains information that MeV uses to determine what type of .tav file is being loaded. See the Appendix (section 4.11) for more details on preferences files (4.11).
Insert screenshot
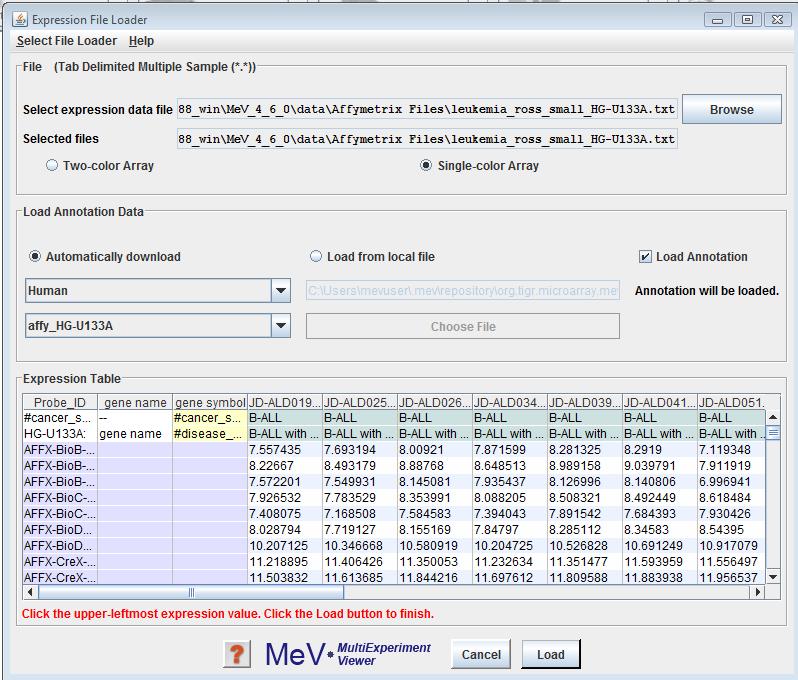
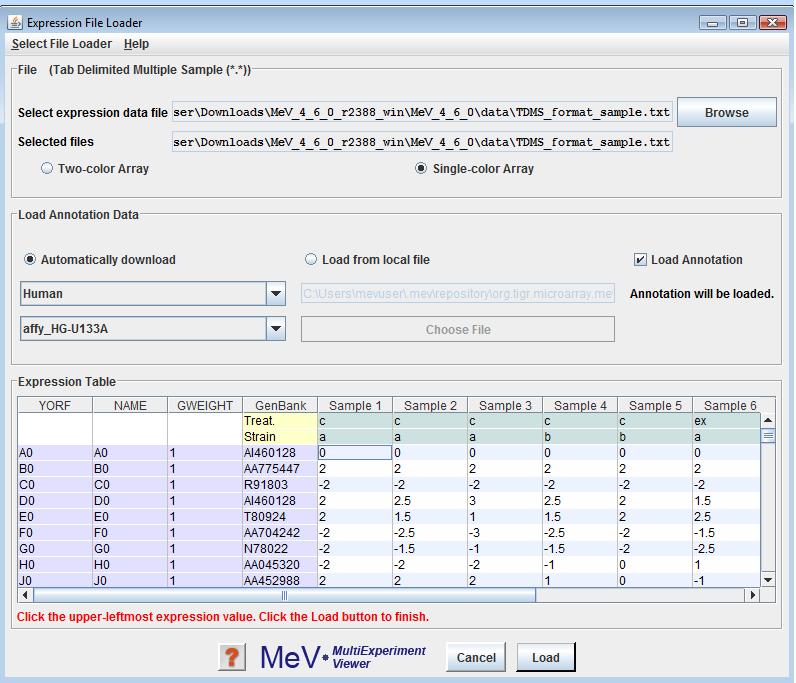
The Expression File Loader should be the screen that automatically comes up once you select from the menu. If not, click option from the drop-down menu to load TDMS format files. Use the browse button in the panel to select the desired file. The file will be displayed in a tabular format in the file loader preview table. Select either the or the radio button to indicate the data type of the expression data. Please read Using the Annotation Feature, for information on the same. Click the cell in the table which contains the upper-leftmost in the file. That is, click the upper-leftmost cell that contains measuered data of the genes. MeV will color-code the cells of the display table to indicate which cells it will load as expression data (white and gray stripes), gene/row annotation (purple), sample annotation (blue) or sample annotation labels (yellow). Gene annotation labels will be displayed in the column headers. Data in cells with white backgrounds will not be loaded. MeV allows you to have as many columns as you want of labels and annotation, but you must tell it where the labels end and the expression data begins. Check that the correct fields are listed before clicking .
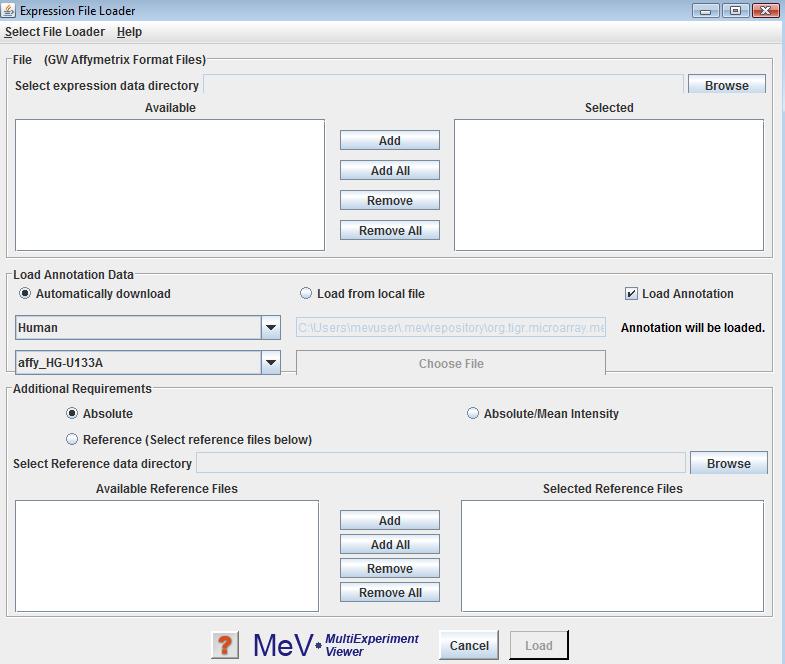
Selecting from the drop-down menu allows the loading of Affymetrix files. We currently support five different Affymetrix file format namely: GW Affymetrix, dChip/DFCI_Core, Affymetrix GCOS, Bioconductor (using MAS5) and RMA Files. Select the directory containing files to be loaded using the browse button in the panel. The contents of the folder selected in the file selection dialog box will be displayed in the box labeled “Available”. Select the files to load and click the “Add/ Add All” button to add them to the list of files to be loaded. Please read Using the Annotation Feature section, for information on the same.
These files contain a single intensity value per spot, instead of the usual two that MeV requires. The values loaded from these files will be used as a Cy5 value, that is, the numerator in the calculation of the ratio of intensities. Therefore there are several options for simulating a second intensity value (the denominator). Select from the radio button options to choose a method. If is selected, the denominator is given a value of 1 for all ratio calculations. If is selected, the average of all intensity values for that gene across all loaded Affymetrix files is used as the denominator for that spot. Similarly, if is selected, the median of all intensity values for that spot is used. If is selected, a reference Affymetrix file, selected in the file selector at the bottom of the dialog, is used. The intensity value of each record in the Affymetrix file is used as the denominator of the ratio calculation for the corresponding spot in each of the loaded data files.
When data are loaded in MeV, it automatically generates an expression image. Expression images convey expression levels by converting the numeric (log2 (A/B) or absolute ) as a color that is extracted from the color gradient. For Affymetrix data and two channels data, each has different data range in the data set. Now MeV has a new function to automatically sets the color scale limits according to different data sets.
For Affymetrix data the low end is set to 0 and midpoint is set as median and high end is set to the value so that 80% of the data fall below this value.
For two color array data the low end is set to -3 and midpoint is set to 0 and high end is set to 3.
Users can change color scale limits after loading as instructed in the following section.
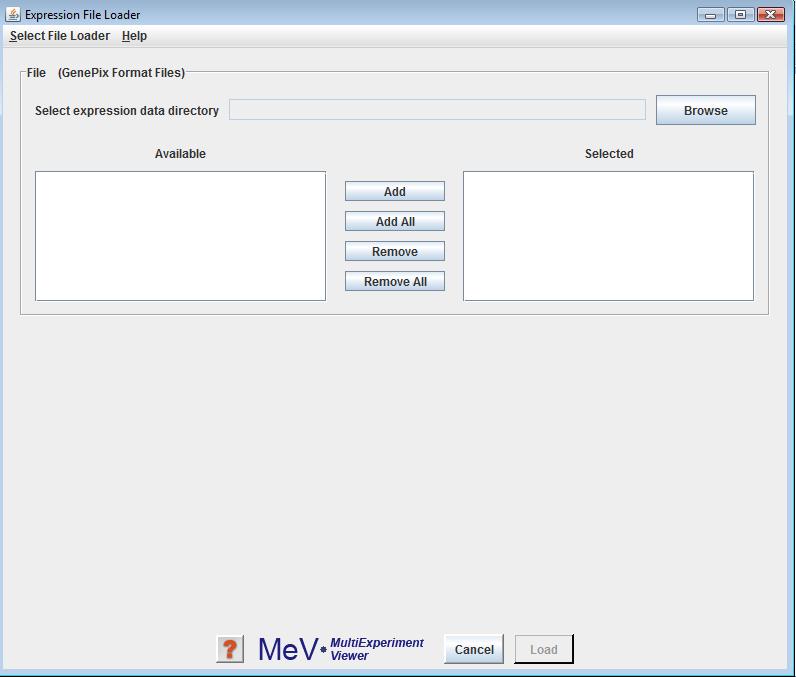
GenePix (.gpr) files can be loaded by selecting the GenePix file loader option from the list of available file formats to load. Use the button to select the directory containing the .gpr files. Files appearing in the file list can be added to the file list using the or buttons.
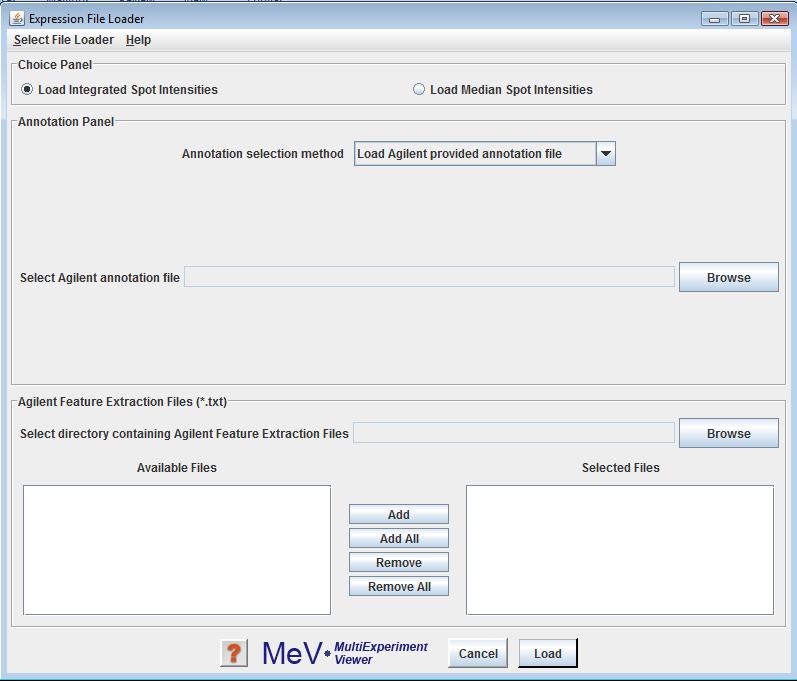
Agilent format text files can be loaded by selecting the Agilent file loader option from the list of available file formats to load. Use the button to select the directory containing the files. Files appearing in the Available file list can be added to the file list using the or buttons. The upper file selection area is for the selection of Agilent Oligo Feature Extraction text files and lower file selection area is for the text version of the pattern file that corresponds to your slide.
After Expression File Loader dialog is launched, SOFT Affymetrix format file can be loaded by selecting the GEO SOFT Affymetrix file loader option from the list of available file formats to load.
Use the button in the panel to locate the file to be loaded. The selected file will be displayed in a tabular format in the file loader preview table. We currently allow loading GPL and GSM format files using this loader. The platform information contained in the GPL files is automatically loaded. There is no provision to load the platform information separately. Click the cell in the table which contains the upper-leftmost in the file, then click the Load button to load the file.
SOFT two channel format file can be loaded by selecting the GEO SOFT two channel file loader option from the list of available file formats to load.
Use the button in the panel to locate the file to be loaded. We currently allow loading GPL and GSM format files using this loader. The platform information contained in the GPL files is automatically loaded. There is no provision to load the platform information separately. The selected file will be displayed in a tabular format in the file loader preview table. Then click the cell in the table which contains the upper-leftmost in the file, then click the Load button to load file.
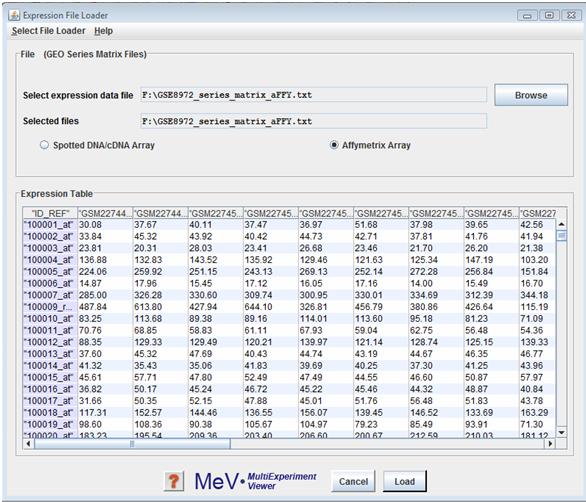
GEO Series Matrix files can be loaded using the button in the File panel. Select to indicate the data-type of the loaded expression data.
Series_matrix files are summary text files that include a tab-delimited value- matrix table generated from the 'VALUE' column of each Sample record, headed by Sample and Series metadata. These files include SOFT attribute labels. Data generated from multiple Platforms are contained in separate files. It is recommended to view Series_matrix files in a spreadsheet application like Excel. CAUTION: value data are extracted directly from the original records with no consideration as to whether the values are directly comparable.
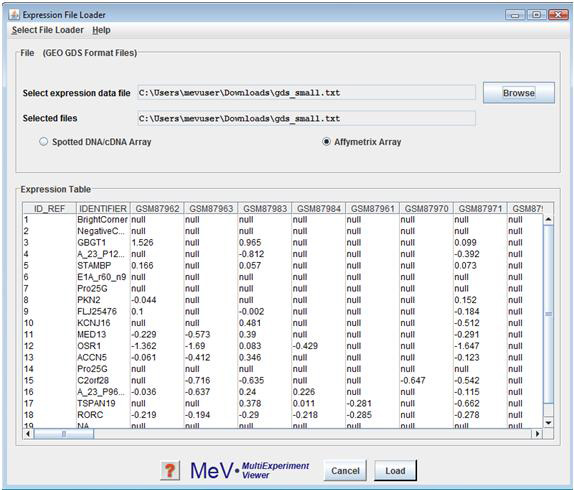
GEO GDS format file can be loaded using the button in the File panel. Select to indicate the data-type of the loaded expression data.
GEO Datasets (GDS) are curated sets of comparable GEO Sample (GSM) data. GDS data tables contain VALUE measurements extracted from original Sample records.
Bioconductor (MAS5) format file can be loaded by selecting the Bioconductor (MAS5) file loader option from the list of available file formats to load. Use the browse button to locate the files to be loaded. The file will be displayed in a tabular format in the file loader preview table. The call format file generated by Bioconductor can be selected using the browse button in the “Additional Requirements” panel.
Please read Using the Annotation Feature section, for information on the same. Click the cell in the table which contains the upper-leftmost in the file. Click button Load to load file.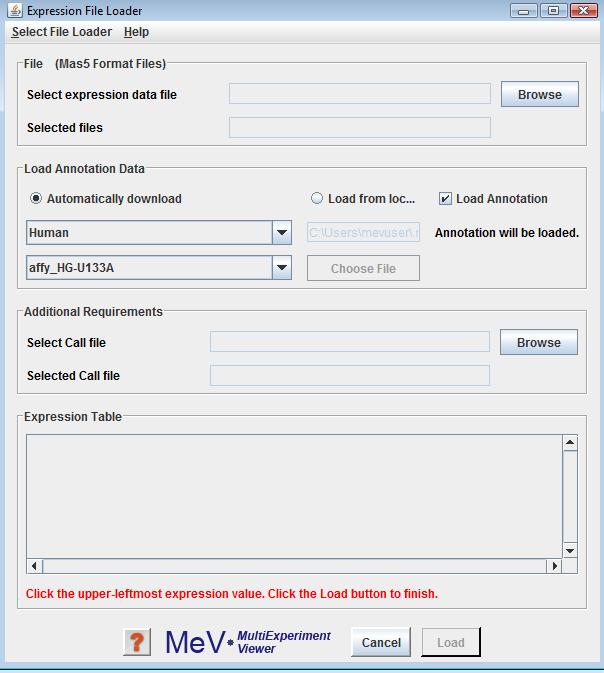
Bioconductor (MAS5) Format file loader
Affymetrix GCOS (Gene chip operating software) output (pivot data) files can be loaded by selecting the Affymetrix GCOS file loader option from the list of available file formats to load.
This file loader can actually load three similar file formats by choosing data option radio buttons.
Only Intensity-----only containing signal intensity for every experiment
Intensity with Detection -----containing detection for every experiment
Intensity with Detection and p-value-----containing detection and P-value for every experiment
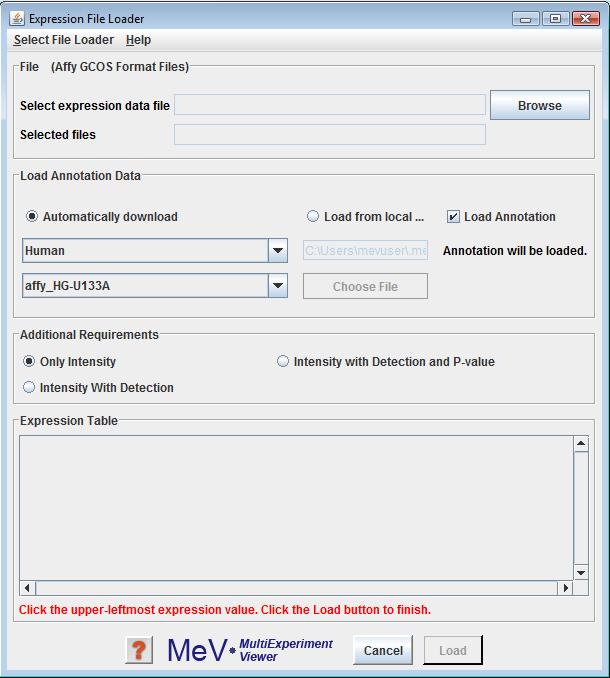
Use the button to locate the files to be loaded. The file will be displayed in a tabular format in the file loader preview table. Please read Using the Annotation Feature section, for information on the same. Choose the data options by clicking proper radio button. Then click the cell in the table which contains the upper-leftmost in the file. Then click the Load button to load the file.
The MeV MAGE-TAB file loader allows a user to select and load expression data from MAGE-TAB (version 1.0) formatted files. The MAGE-TAB specification can be found at:
The MeV MAGE-TAB file loader can be accessed by selecting from the file menu, and then from the loader menu. The panel itself is different from other MeV file loaders in that it must load at least 3 files (defined in the MAGE-TAB spec.). There are 4 regions on the panel: 1) the files section, 2) the annotation section, 3) the channel data section, and 4) the data section.
In the files section, the individual data entry fields are initially blank. Once the user browses to and identifies the location of one of the required files (IDF, SDRF or data matrix files), MeV will check for the existence of the others and report back with a file name or a message indicating that one of the file types was not found. The user can then browse to find each file individually. At this point MeV will only search for the file currently being selected.
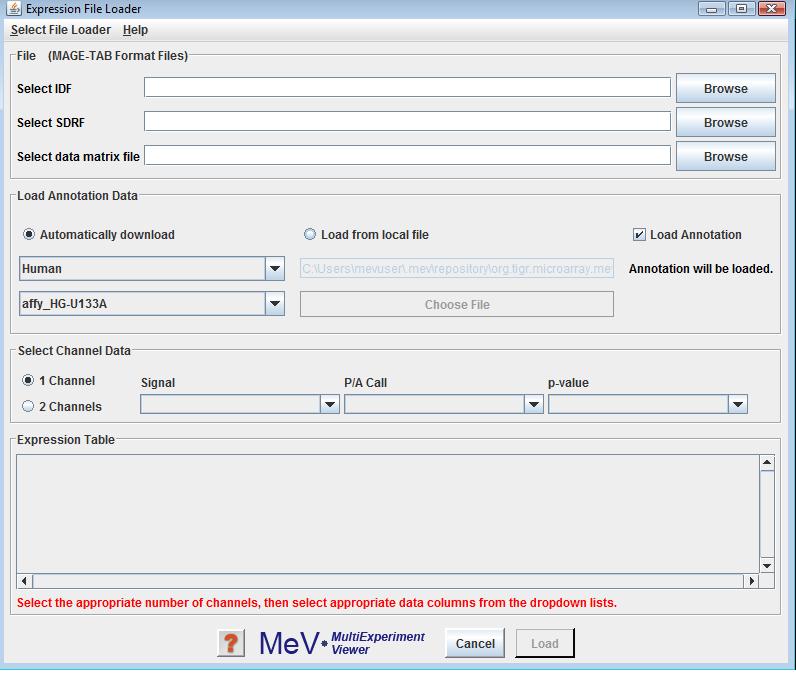 MeV MAGE-TAB file loader
The annotation section allows the user to either select gene annotation from a list of arrays that exist on the current system, or can be downloaded from the internet. (Network access is required for the latter.)
The channels section will be populated once a user selects a data matrix file. In fact the user should not set any values until selecting a data matrix because they will be changed once the file is selected. After the file is selected and the panel is updated, the user can select appropriate values if they have not already been selected.
The 1 channel / 2 channel radio buttons indicate whether the data is derived from 1- or 2- channel hybridizations. Depending upon which radio button is selected, MeV will display either Signal, Detection and p-Value combo boxes, or Intensity1, Intensity2 and Log Ratio/Ratio combo boxes. The Log Ratio/Ratio combobox may be used for either Log(ratio) or ratio data. Each drop-down list includes all of the data type items from the second row of the MAGE-TAB data matrix file plus one additional entry, “none”, to allow the user to select no value for the combobox. The user must know and understand the data well enough to make appropriate selections for these lists. The data section merely displays the data from the selected data matrix file. No interaction with this section is necessary. The ‘Load’ button is inactive until the user provides a data matrix file. The Load button will then be activated.
Once a data matrix file has been selected and displayed, the user can select ‘Load’ to load and parse the data matrix file. MeV will display the data matrix as a heat map with row labels derived from the first column of the data matrix file. Once the data have been presented as a heat map, all other MeV functionalities will be available for use.
The MAGE-TAB format defines categorical items that MeV can use to group data. This data is found in the ExpermentalFactor tags of the MAGE-TAB IDF and the FactorValue columns in the SDRF. MeV loads this data into a ClusterAnnotation viewer which will allow the user to view and edit this information. The user can there specify which fields should be used to group the data. This is useful for analyses such as t-test, ANOVA, etc.
 Expression Image
Where can you view all the data in the SDRF file?
The Cluster Manager ->Sample Clusters is where you will be able to view the data that you loaded from the SDRF file.
The contents of the SDRF file (Characteristics and FactorsValues) are displayed in a tabular view in Cluster Manager.
Where can I view and edit the contents of IDF file?
The IDF Editor lets you view and edit your IDF files. The first column (IDF fields) is not editable. If you want to add any missing fields to your data, click on the “Add Missing IDF Fields” option. This will automatically insert the missing rows. Changes to the IDF or SDRF data are retained in memory until you exit MeV. None of this data is saved in the current version of MeV.
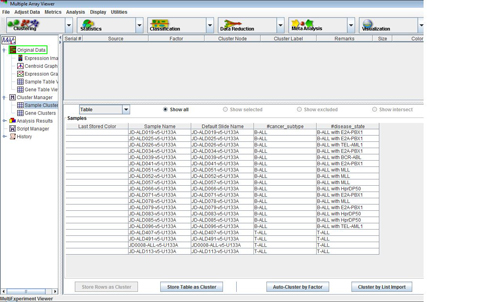 Cluster Manager
The current version of MeV will not save data in MAGE-TAB format; however, this feature is planned for a future release of MeV.
Example files can be found in the following links:
MAGE-TAB files supplied along with MeV,
e.g.
E-ATMX-12.idf.txt
E-ATMX-12.sdrf.txt
E-ATMX-12-processed-data-1343527784.txt
NOTE: Although we have tested a variety of MAGE-TAB files with MeV, there are some MAGE-TAB files that may not load into MeV. This may be due to flexibility in the MAGE-TAB v.1.0 specification. Also note that not all the files available on the ArrayExpress web site that are in MAGE-TAB format can be loaded into MeV because the parser we currently use supports the MAGE-TAB v.1.0 specification. The ArrayExpress web site includes files that conform to the as yet unpublished MAGE-TAB v.1.1 format.
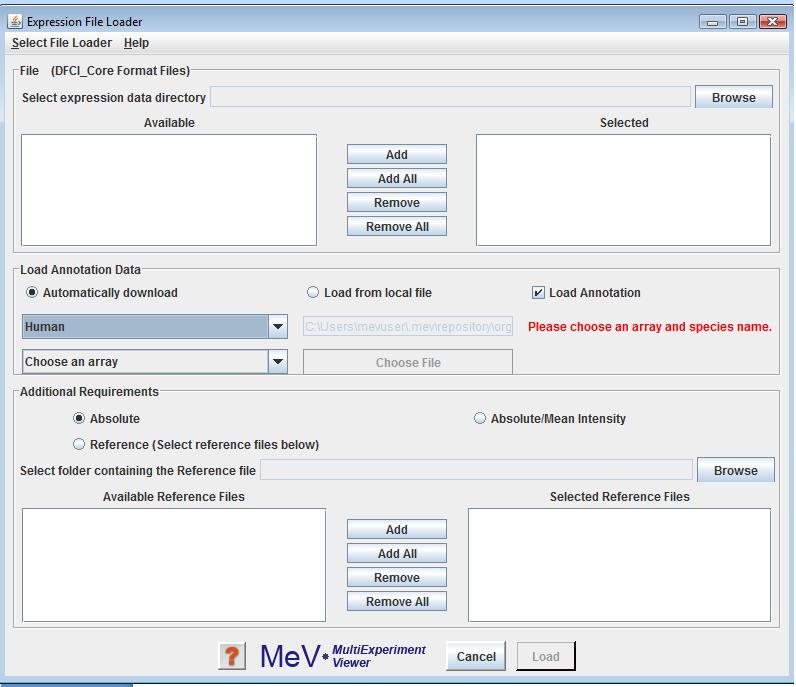
Selecting from the drop-down menu allows the loading of dChip or DFCI_core output files. Select the directory containing data files using the button. Files appearing in the file list can be added to the file list using the or buttons. Please read Using the Annotation Feature section, for information on the same.
These files contain a single intensity value per spot, instead of the usual two that MeV requires. The values loaded from these files will be used as a Cy5 value, that is, the numerator in the calculation of the ratio of intensities. Therefore there are several options for simulating a second intensity value (the denominator). Select from the radio button options to choose a method. If is selected, the denominator is given a value of 1 for all ratio calculations. If Mean Intensity is selected, the average of all intensity values for that gene across all loaded Affymetrix files is used as the denominator for that spot. If is selected, a reference Affymetrix file, selected in the file selector at the bottom of the dialog, is used. The intensity value of each record in the Affymetrix file is used as the denominator of the ratio calculation for the corresponding spot in each of the loaded data files.
One of the features of MeV release 4.1 is enhanced support for gene annotations. MeV provides users an alternative to fetch additional gene annotation, from the web based resource providing annotation based on The Gene Indices (TGI) for commonly available microarray resources, including widely used clone sets and Affymetrix GeneChip Arrays namely; RESOURCERER. Please refer to the developer’s manual for further information on the Annotation model. This feature is currently provided only for Affymetrix data.
Steps for using this feature
Select the organism your expression data comes from using the Choose Organism drop-down menu. The list of arrays in the Choose Array drop-down menu will be updated with the available array types. Choose the one that your data was collected from. The button to the right of the Choose Array drop-down menu will update, and will ready “Download” if the file has not already been downloaded. Click this button and MeV will attempt to download the file from the internet. If the file has been previously downloaded, this button will read “Select” instead of Download, indicating that internet access is not required to use this annotation. Click “Select” to choose this annotation type.
If internet access is not available and you have an annotation file of the appropriate format, you can still select an annotation file from your filesystem. Click the “Browse” button, located beneath the “Download” button, and select the file. Annotation file formats that are accepted include the Resourcerer file format and the Affymetrix .csv file format.
Follow any further instructions present in the file loader panel before clicking the button. In the example shown here, you will click on the upper leftmost in the panel before clicking the button.
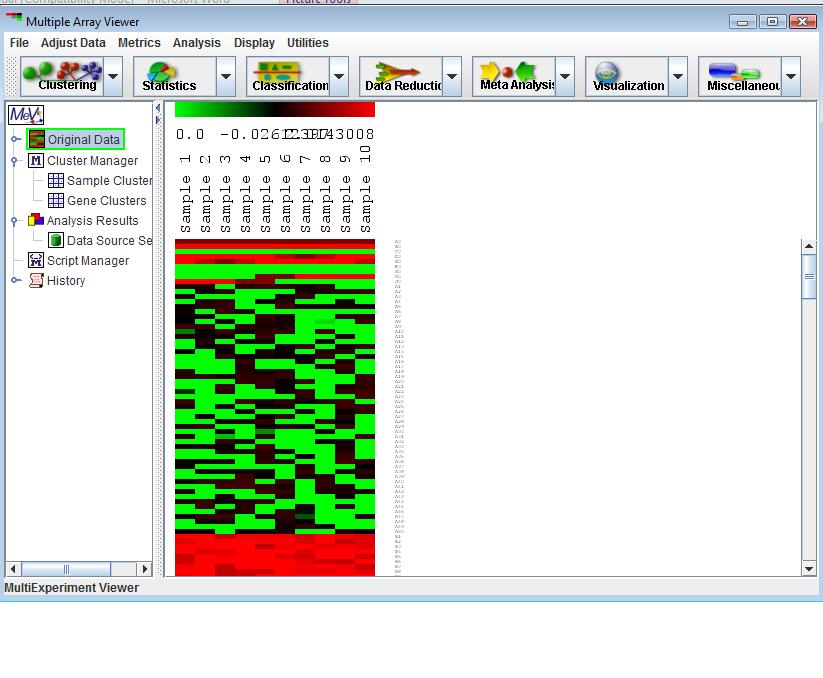
For each set of loaded, a column is added to the main display (4.16.1). This display is an Expression Image viewer, in which each column represents a single sample and each row represents a gene. The names of the samples are displayed vertically above each column, and any annotation field of interest from the input files can be displayed to the right of each row. MeV expects that each sample loaded will have the same number of elements, in the same order, and that each gene (spot) is aligned with that element in every other sample loaded. For example, using that rule, all input files will have data for gene x in row y. Clicking on a spot displays a dialog with detailed information about that spot. For more detail regarding the Expression Images viewer, see section 7.2.
The left side of the main interface is a navigation tree.
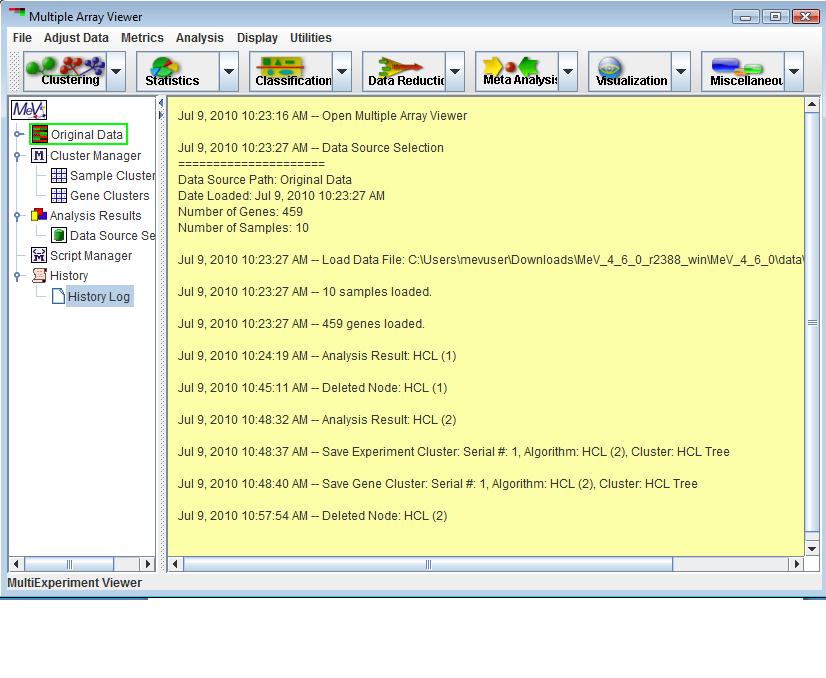
The History Node contains a log of most activities. For each log entry a date and time is recorded. Major events such as file loading, analysis loading, script loading, algorithm execution, and cluster storage events are logged to the History Log. If the analysis is stored to a file, then the History is retained and restored so that new events can be logged. The history log can be stored to a text file by right clicking in the viewer and selecting the Save History to menu option.