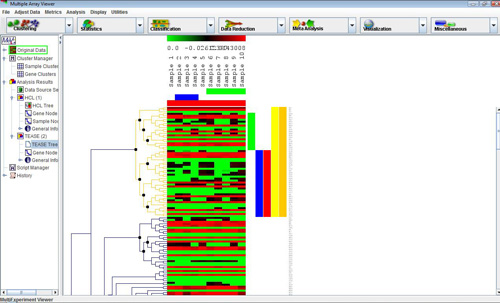
TEASE hierarchical tree
Selecting this analysis will display a configuration window with three main modes and four tabbed panels; each contains essential configurations that are specific for Hierarchical Clustering (HCL) or EASE analysis. Once the analysis is completed, select the tree node under “Analysis Results” to view the hierarchical tree with color dots signified whether the cluster contains over-expressed biological categories (Red: most significant, Blue: least significant). To view EASE analysis information of each cluster, position the mouse over the color dot at the root of the cluster to display a popup window. The first column in the window is the name of annotation file which contains the category. The second to the third to the last column are information about the category that is included in the annotation file. If the default mode “Cluster Analysis” is selected, the last column is the “score” the category receives, that is the probability the certain category is decided over-expressed by chance. If “Annotation Survey” mode is selected, the last two columns would be the hit count and cluster size, respectively.
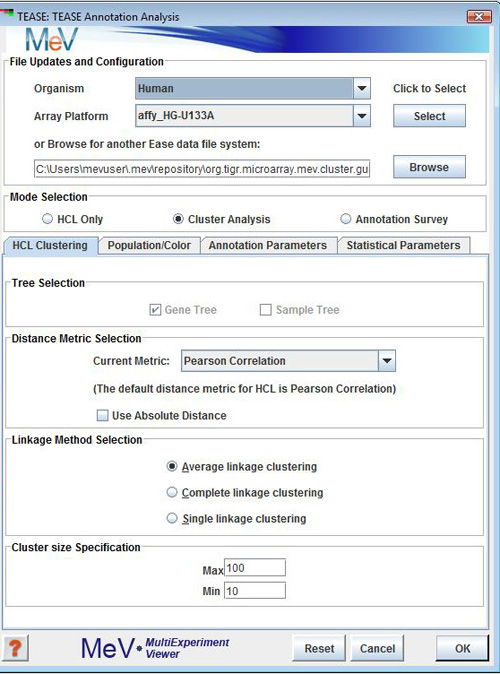
HCL Only
Perform Hierarchical Clustering (HCL). No biological theme exploration.
Cluster Analysis
EASE analysis on clusters that fall within the minimum and maximum size of population as specified in the panel “HCL Clustering” – “Cluster size specification”. Calculate the score of each category and rank the categories by score.
Annotation Survey
EASE analysis on clusters that fall within the minimum and maximum size parameters specified by the user. Calculate and rank present categories in each cluster by hit counts. No score is calculated in this mode.
Linkage Method
This parameter is used to indicate the convention used for determining cluster-to-cluster distances when constructing the hierarchical tree.
: The distances are measured between each member of one cluster each member of the other cluster. The minimum of these distances is considered the cluster-to-cluster distance.
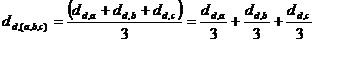
: The average distance of each member of one cluster to each member of the other cluster is used as a measure of cluster-to-cluster distance. Note that this option in MeV actually is determined by a weighted average of distances of cluster members. Example: Consider the distance from node ‘d’ to cluster (a,b,c)…
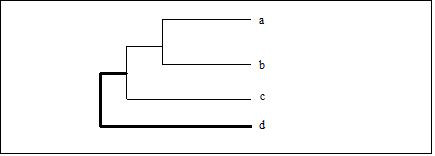
Distance from node "d" to cluster (a,b,c)
Unweighted Average Linkage:
Weighted Average Linkage:
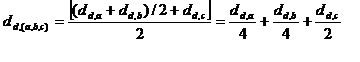
Nodes are weighted unequally where nodes deeper in the sub-tree contribute less to the overall computed distance.
Complete Linkage: The distances are measured between each member of one cluster and each member of the other cluster. The maximum of these distances is considered the cluster-to-cluster distance.
Cluster Genes / Cluster Samples Options
These checkboxes are used to indicate whether to cluster genes, samples, or both. Default Distance Metric: Euclidean
Cluster Size Specification
State of the size of clusters you want to analyze. You won’t get too much information for clusters that are too big or too small. The default size is from 10 to 100.
Population selection
Available only when in “Cluster Analysis” mode. Please refer to EASE documentation for more information.
Assign Color Gradient
Specify the upper and lower score for assigning color gradient. Increasing upper and lower bounds will cause the gradient shifts to red whereas decreasing will shift it to blue. Gradient can also be adjusted in the graphic view window after analysis is completed and the correct tree code is selected. The default setting for upper bound is 0.1, and 0.00001 for lower bound.
Selections of annotation key, annotation conversion file, and gene ontology/gene annotation/gene linking files. Refer to EASE documentation for more information.
Selections of reported statistics, multiplicity correction and time parameters. Refer to EASE documentation for more information.
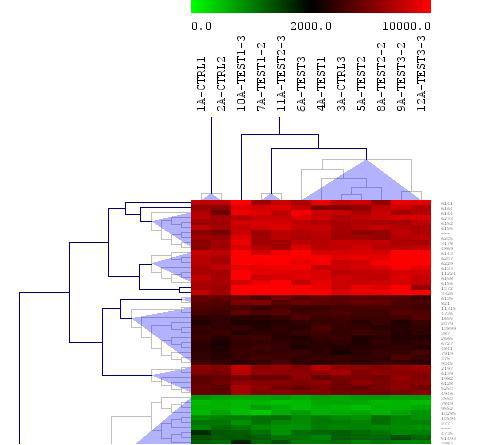
A large dataset is likely to have more than a handful clusters that fall within the size range, but only clusters that are “more red” worth attention. It is thus important to assign appropriate color gradient boundaries to save time. Adjusting color gradient will be in a later section. To view information about each cluster, simple position the cursor over the root of the cluster to reveal a pop-up window. When done, move the cursor away and the window will disappear.
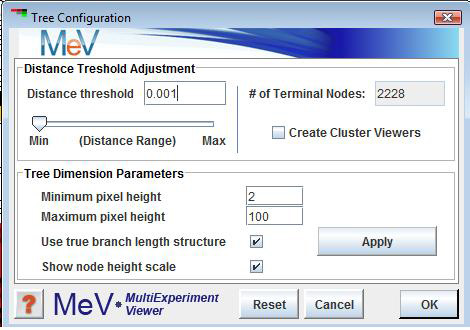
A right click in the Tree Viewer will produce a menu which includes an option to alter the displayed tree, Tree Properties. This option permits the user to change the tree’s appearance and to reduce the complexity of the tree by imposing a distance threshold. Elements on nodes which have distances below this threshold can be considered as one entity (or cluster). Consequently the lower level detail of the tree is ignored. As the value is adjusted the corresponding TEASE tree will have nodes below this threshold appear as light gray in color and a translucent 'wedge' from that node to all enclosed elements will be draw on the tree. This representation of the tree will persist unless the dialog is dismissed by hitting cancel. The distance threshold can be entered into a text field or can be adjusted with a slider over the maximum range of inter-node distances. The number of terminal nodes (clusters) using the current distance threshold is displayed in the upper right quadrant of the dialog.
The option allows you to create viewers based on the distance threshold. This option collects groups of elements falling below terminal nodes in the tree using the current distance threshold. The clusters of elements are represented as nodes in the result navigation tree under the TEASE result node. The results are added once the TEASE Tree Configuration dialog has been dismissed. The minimum and maximum pixel distance imposes limits on the minimum and maximum displayed inter-node distance. This alters the appearance of the tree. The button causes the entered tree dimensions to be applied to the TEASE tree. This allows one to fine tune the tree's appearance without dismissing the dialog.
A right click on the TEASE Tree View will reveal a pop-up menu. Near the bottom of the menu is an option that says “Change Score Boundary”. Left click on the option will produce a configuration window. In the window are two editable text fields similar to the “Assign Color Gradient” panel in the initialize window. Enter appropriate number and click on “OK” to apply the changes or “Cancel” to exit the window without any changes. You can view the changes you make in Tree View once you exit the window.