|
|
TUTORIAL: PAIRWISE SIMILARITY SEARCHES |
update Oct. 2, 2014 |
|
|
TUTORIAL: PAIRWISE SIMILARITY SEARCHES |
update Oct. 2, 2014 |

P1HOM         Version  5/13/91
X-axis: ANP1C_MACAM
Y-axis: ANP2_ANALU
SIMILARITY RANGE:  10      MIN.PERCENT SIMILARITY:  30
SCALE FACTOR:    0.90      COMPRESSION:              4

               40        80

       U        .         .         .         .         .         .         .
        H       .         .         .         .         .         .         .
         F      .         .         .         .         .         .         .
          I     .         .         .         .         .         .         .
           P    .         .         .         .         .         .         .
            P   .         .         .         .         .         .         .
            OH  .         .         .         .         .         .         .
             FC .         .         .         .         .         .         .
              CE.         .         .         .         .         .         .
    40 ........GI............................................................
                .N        j         .         .         .         .         .
                .PP       .         .         .         .         .         .
                . OK      .         .         .         .         .         .
                .  JG     .         .         .         .         .         .
                .   EF    .         .         .         .         .         .
                .    FE   .         .         .         .         .         .
                .     JK  .         .         .         .         .         .
                .       M .         .         .         .         .         .
                .        L.         .         .         .         .         .
    80 ..................ML..................................................
                .         NP        .         .         .         .         .
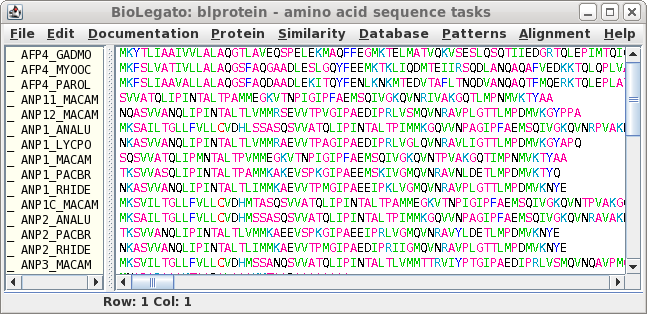
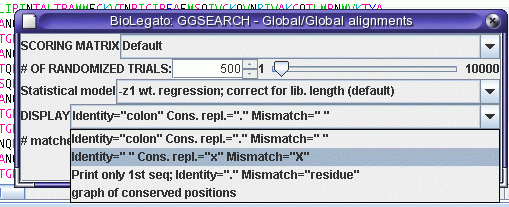
 GGSEARCH performs rigorous global
alignments. That is, the alignment is constructed so that all of
both proteins must be included in the alignment. Choose Similarity --> GGSEARCH to
get the GGSEARCH menu:
GGSEARCH performs rigorous global
alignments. That is, the alignment is constructed so that all of
both proteins must be included in the alignment. Choose Similarity --> GGSEARCH to
get the GGSEARCH menu:
Click Run. Output is shown below:
The best scores are:                                      n-w bits E(1)
ANP2_ANALU 88 bp                                   (  88)  455 72.0 4.2e-218

>>ANP2_ANALU 88 bp                                        (88 aa)
 n-w opt: 455  Z-score: 365.0  bits: 72.0 E(): 4.2e-218
global/global (N-W) score: 455; 84.1% identity (92.0% similar) in 88 aa overlap (1-87:1-88)

               10        20         30        40        50
ANP1C_ MKSVILTGLLFVLLCVDHMT-ASQSVVATQLIPINTALTPAMMEGKVTNPIGIPFAEMSQ
       :::.:::::::::::::::. ::::::::::::::::::: ::.:.:.:: :::::::::
ANP2_A MKSAILTGLLFVLLCVDHMSSASQSVVATQLIPINTALTPIMMKGQVVNPAGIPFAEMSQ
               10        20        30        40        50        60

      60        70        80
ANP1C_ IVGKQVNTPVAKGQTLMPNMVKTYVAGK
       :::::::  ::: .:::::::::: :.:
ANP2_A IVGKQVNRAVAKDETLMPNMVKTYRAAK
               70        80
When similarity is this high, it is easier to view the mismatches, rather than the matches:
The best scores are:                                      n-w bits E(1)
ANP2_ANALU 88 bp                                   (  88)  455 74.0 1.1e-232

>>ANP2_ANALU 88 bp                                        (88 aa)
 n-w opt: 455  Z-score: 375.5  bits: 74.0 E(): 1.1e-232
global/global (N-W) score: 455; 84.1% identity (92.0% similar) in 88 aa overlap (1-87:1-88)

               10        20         30        40        50
ANP1C_ MKSVILTGLLFVLLCVDHMT-ASQSVVATQLIPINTALTPAMMEGKVTNPIGIPFAEMSQ
          x               x                    X  x x x  X
ANP2_A MKSAILTGLLFVLLCVDHMSSASQSVVATQLIPINTALTPIMMKGQVVNPAGIPFAEMSQ
               10        20        30        40        50        60

      60        70        80
ANP1C_ IVGKQVNTPVAKGQTLMPNMVKTYVAGK
              XX   Xx          X x
ANP2_A IVGKQVNRAVAKDETLMPNMVKTYRAAK
               70        80
| Try it: Select ANP11_MACAM, ANP3_MACAM Similarity --> PXHOM COMPRESSION: 2 |
P1HOM         Version  5/13/91
X-axis: ANP11_MACAM
Y-axis: ANP3_MACAM
SIMILARITY RANGE:  10      MIN.PERCENT SIMILARITY:  30
SCALE FACTOR:    0.90      COMPRESSION:              2

               20        40        60

                .         .         .         .         .         .         .
                .         .         .         .         .         .         .
                .         .         .         .         .         .         .
                .         .         .         .         .         .         .
                .         .         .         .         .         .         .
                .         .         .         .         .         .         .
                .         .         .         .         .         .         .
                .         .         .         .         .         .         .
                .         .         .         .         .         .         .
    20 ......................................................................
                .         .         .         .         .         .         .
                .         .         .         .         .         .         .
       U        .         .         .         .         .         .         .
        O       .         .         .         .         .         .         .
         K      .         .         .         .         .         .         .
          I     .         .         .         .         .         .         .
           H    .         .         .         .         .         .         .
            I   .         .         .         .         .         .         .
             L  .         .         .         .         .         .         .
    40 .......Q..............................................................
               V.         .         .         .         .         .         .
                W         .         .         .         .         .         .
                .         .         .         .         .         .         .
                . c       .         .         .         .         .         .
                .  f      .         .         .         .         .         .
                .   e     .         .         .         .         .         .
                .    f    .         .         .         .         .         .
                .         .         .         .         .         .         .
                .         .         .         .         .         .         .
    60 ......................................................................
                .        g.         .         .         .         .         .
                .         .         .         .         .         .         .
                .         .d        .         .         .         .         .
                .         . c       .         .         .         .         .
                .         .  Z      .         .         .         .         .
           h    .         .         .         .         .         .         .
            i   .         .    W    .         .         .         .         .
             h  .         .     T   .         .         .         .         .
              i .         .      V  .         .         .         .         .
    80 ...........................X..........................................
                .         .        Z.         .         .         .         .
                .         .         f         .         .         .         .
                .         .         .         .         .         .         .
                .         .         .         .         .         .         .
                .         .         .         .         .         .         .
Surprisingly, comparison of the two sequences using GGSEARCH
shows no significant similarity.
| Try it: Select ANP11_MACAM, ANP3_MACAM Similarity --> GGSEARCH |
GGSEARCH produces global alignmentsYet, we know from the PXHOM output that there is a long region of similarity. In particular, PXHOM shows that the first 22 amino acids of ANP11_MACAM show a strong match with residues 22 through 44 of ANP3_MACAM. This illustrates an important distinction between global and local alignments. GGSEARCH performs alignments in which the entire length of both sequences must be forced into an alignment. GLSEARCH finds the highest-scoring local alignment between both sequences.
version 35.04 Oct. 7, 2008
Query: bio8564379525050104483.tmp.seq1
1>>>ANP11_MACAM 62 bp - 62 aa
Library: bio8564379525050104483.tmp.seq2 91 residues in 1 sequences
0 residues in 0 sequences (range: 50-77)
Statistics: Altschul/Gish params: n0: 62 Lambda: 0.158 K: 0.019 H: 0.100
Algorithm: Global/Global Needleman-Wunsch (2007) (6.0 April 2007)
Parameters: BL50 matrix (15:-5), open/ext: -10/-2
Scan time: 0.000
!! No sequences with E() < 0.010000
62 residues in 1 query sequences
91 residues in 1 library sequences
Scomplib [35.04]
start: Mon Sep 28 12:36:59 2009 done: Mon Sep 28 12:36:59 2009
Total Scan time: 0.000 Total Display time: 0.010
| Try it: Select ANP11_MACAM, ANP3_MACAM Similarity --> GLSEARCH |
GLSEARCH produces global query alignments
 version 35.04 Oct. 7, 2008
Query: bio3874515111645596706.tmp.seq1
  1>>>ANP11_MACAM 62 bp - 62 aa
Library: bio3874515111645596706.tmp.seq2      91 residues in     1 sequences

     91 residues in     1 sequences (range: >50)
Statistics: (shuffled [500]) Unscaled normal statistics: mu= 14.4260  var=94.9384 Ztrim: 0
Algorithm: Global/Local Needleman-Wunsch (2007) (6.0 April 2007)
Parameters: BL50 matrix (15:-5), open/ext: -12/-2
 Scan time:  0.050

The best scores are:                                      n-w bits E(1)
ANP3_MACAM 91 bp                                   (  91)  211 50.6 8.2e-91

>>ANP3_MACAM 91 bp                                        (91 aa)
 n-w opt: 211  Z-score: 251.7  bits: 50.6 E(): 8.2e-91
global/local score: 211; 58.1% identity (72.6% similar) in 62 aa overlap (1-62:25-86)

                                       10        20        30
ANP11_                         SVVATQLIPINTALTPAMMEGKVTNPIGIPFAEMSQ
                               ::::::::::::::: .::  .:  : :::  .. .
ANP3_M MKSVILTGLLFVLLCVDHMSSANQSVVATQLIPINTALTLVMMTTRVIYPTGIPAEDIPR
               10        20        30        40        50        60

         40        50        60
ANP11_ IVGKQVNRIVAKGQTLMPNMVKTYAA
       .:. :::. :  : ::::.::: :
ANP3_M LVSMQVNQAVPMGTTLMPDMVKFYCLCAPKN
               70        80        90
| Try it: Select ANP11_MACAM, ANP3_MACAM Similarity --> SSEARCH |
SSEARCH searches a sequence data bank
 version 35.04 Oct. 7, 2008
Please cite:
 T. F. Smith and M. S. Waterman, (1981) J. Mol. Biol. 147:195-197;
 W.R. Pearson (1991) Genomics 11:635-650

Query: bio6278841360627469717.tmp.seq1
  1>>>ANP11_MACAM 62 bp - 62 aa
Library: bio6278841360627469717.tmp.seq2      91 residues in     1 sequences

     91 residues in     1 sequences
Statistics: (shuffled [500]) MLE statistics: Lambda= 0.2059;  K= 0.148
Algorithm: Smith-Waterman (PGopt) (6.0 Mar 2007)
Parameters: BL50 matrix (15:-5), open/ext: -10/-2
 Scan time:  0.070

The best scores are:                                      s-w bits E(1)
ANP3_MACAM 91 bp                                   (  91)  214 66.3 6.1e-17

>>ANP3_MACAM 91 bp                                        (91 aa)
 s-w opt: 214  Z-score: 336.6  bits: 66.3 E(): 6.1e-17
Smith-Waterman score: 214; 60.0% identity (75.0% similar) in 60 aa overlap (1-60:25-84)

                                       10        20        30
ANP11_                         SVVATQLIPINTALTPAMMEGKVTNPIGIPFAEMSQ
                               ::::::::::::::: .::  .:  : :::  .. .
ANP3_M MKSVILTGLLFVLLCVDHMSSANQSVVATQLIPINTALTLVMMTTRVIYPTGIPAEDIPR
               10        20        30        40        50        60

         40        50        60
ANP11_ IVGKQVNRIVAKGQTLMPNMVKTYAA
       .:. :::. :  : ::::.::: :
ANP3_M LVSMQVNQAVPMGTTLMPDMVKFYCLCAPKN
               70        80        90
| Try it: Select ANP4_PSEAM, ANP_NOTCO COMPRESSION: 2 |
P1HOM Version 5/13/91The entire matrix is full of diagonals, because Ala-rich subsequences will always show similarity with other Ala-rich sequences.
X-axis: ANP4_PSEAM
Y-axis: ANP_NOTCO
SIMILARITY RANGE: 10 MIN.PERCENT SIMILARITY: 30
SCALE FACTOR: 0.90 COMPRESSION: 2
20 40 60 80
. h e f. ef f h e j. . . .
i hj g dZcbbdaZbcbdZcbdgghicbfbhgi . . .
igeg eZUgYbZcUYhbZUiYdjfdf ZbYhfi . . .
e. e cXeRXWbXTRWbXeTXWdfiaeZZeXf j . . .
i fc e cWTSRWWWSRRWWTSSWWcbZZaYYYXgh . . .
hg g dbVRRRZYVRRSYVRRTgYdafaZXYZbj . . .
j hf d cZfSQQSYTSQSZYTQQVYfaZZZcXahc . . .
gf.dg afdXQdQWXdQQeWZSgSZefYYdbcaig . . .
d b aaeVVPeSZVPPSgZZR UiafYYfced . . .
20 .....i...d.h.ZgaeVePSeeVPfSgaeTVedaYdYffhf............................
| To get around this problem,
the FASTA programs GGSEARCH, GLSEARCH, SSEARCH and LALIGN
all shufffle one of the sequences numerous times and repeat
the search. Rather than shuffling the entire sequence as a single unit, these programs shuffle amino acids or nucleotides in a small sliding window. Shuffling begins at one end and moves down the length of the sequence. What this accomplishes is to create a random sequence which preserves local fluctuations in sequence composition that were found in the original sequence. Local shuffling controls for the hypothesis that the two sequences show similarity because the each have similar local variations in amino acid compositions eg. in DNA, both sequences have an AT-rich followed by a GC-rich region. If the program finds significant similarity between the two unshufffled sequences, but not between one original and the population of shuffled sequences, we can reject the hypothesis that similarity is due to local variations in amino acid or nucleotide composition. |
 |
| Try it: Select ANP4_PSEAM, ANP_NOTCO Similarity --> SSEARCH |
SSEARCH searches a sequence data bank
 version 35.04 Oct. 7, 2008
Please cite:
 T. F. Smith and M. S. Waterman, (1981) J. Mol. Biol. 147:195-197;
 W.R. Pearson (1991) Genomics 11:635-650

Query: bio7603365334708550294.tmp.seq1
  1>>>ANP4_PSEAM 85 bp - 85 aa
Library: bio7603365334708550294.tmp.seq2     790 residues in     1 sequences

    790 residues in     1 sequences
Statistics: (shuffled [500]) MLE statistics: Lambda= 0.1216;  K=1.247e+05
Algorithm: Smith-Waterman (PGopt) (6.0 Mar 2007)
Parameters: BL50 matrix (15:-5), open/ext: -10/-2
 Scan time:  0.800
!! No sequences with E() < 0.010000


85 residues in 1 query   sequences
790 residues in 1 library sequences
We can conclude that these two sequences are analogous, resulting
from convergent evolution, rather than homologous, and descended
from a common ancestor.