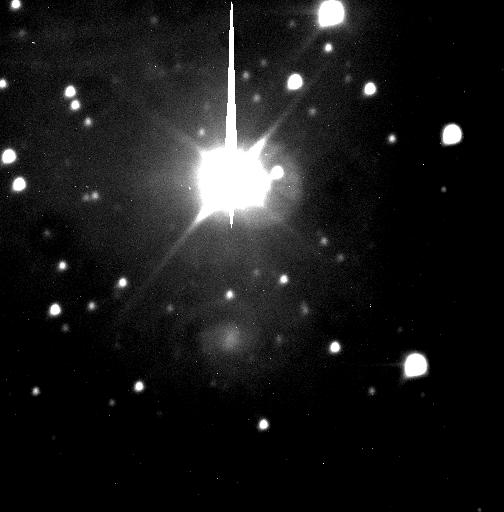
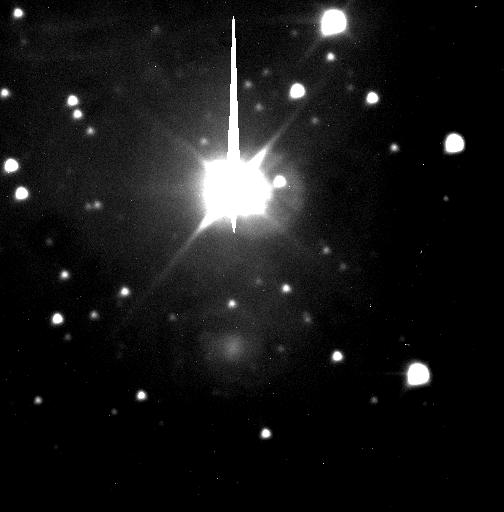
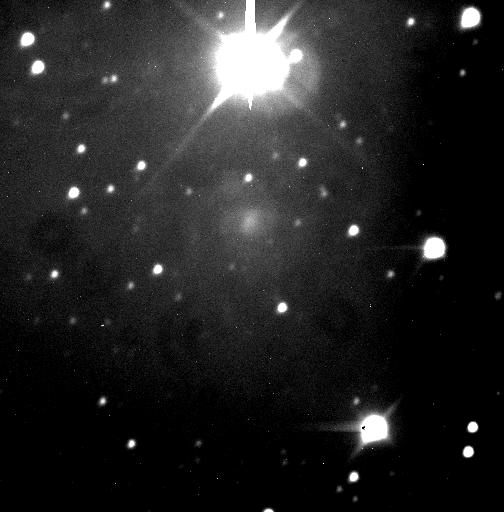
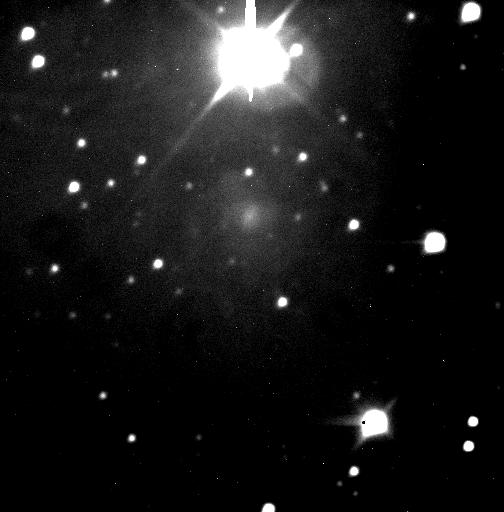

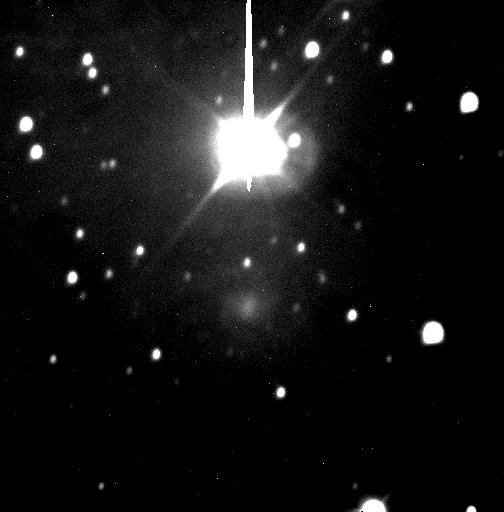
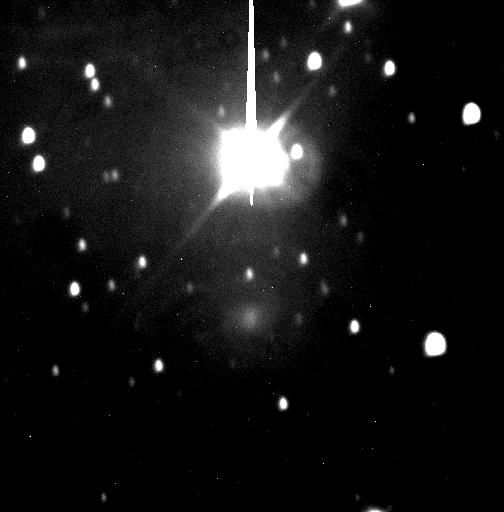
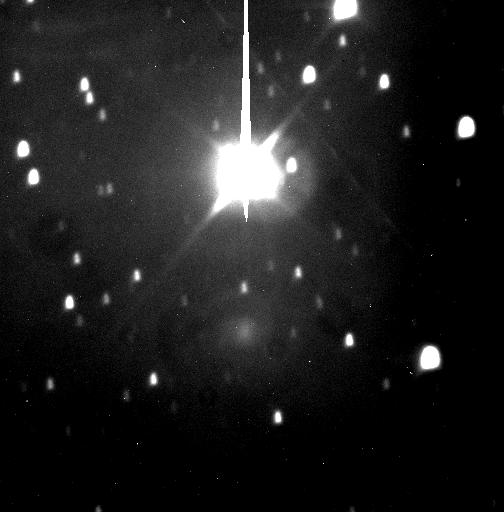
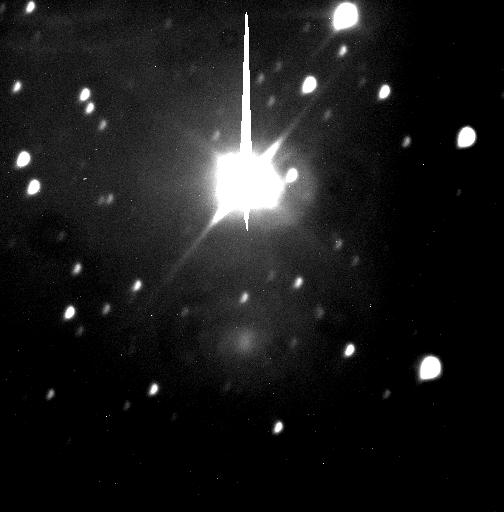
These are the raw images with the mean value of the overscan measured and subtracted. Image -006 was removed from the stack at this point as it was obvious it wasn't going to work with the rest of the data. Image name and linear transformation min/max values listed at the bottom of each image. Images oriented North down and East left.
|
|
|
| ic239c2-50-300-007 -- 4439.1/6364.3 | ic239c3-50-300-008 -- 4231.7/6467.6 | ic239c3-50-300-009-- 4204.2/6136.9 |
|
|
|
| ic239c3-50-300-010 -- 4445.8/6364.3 | ic239c3-50-300-011 -- 4445.8/6364.3 | ic239c3-50-300-012 -- 4445.8/6364.3 |
|
|
|
| ic239c3-50-300-013 -- 4445.8/6364.3 | ic239c3-50-300-014 -- 4198.5/6605.0 | ic239c3-50-300-015-- 4231.7/6467.6 |