
This basically summarizes the research on the hot spots and attempts to answer my research question. It also contains my answer to the question of whether the hot spots are resolvable on my images.
The hot spots are bright knot shaped structures in NGC 2903's nucleus that show brightly in the infrared and blue wavelengths. The study by Oka et al. (1974) concluded that they were large stellar clusters composed of both early- and late- type stars, obscured by dust and excited ionized gas (Oka, Wakamatsu, Sakka, Nishida, & Jugaku, 1974) . A good portion of these studies found results consistent with "energetic star-formation" (a.k.a. HII regions) (D.A, D.L, E.E, R.W, K.-W, & D.N.B, 1988). Simons et al. (1988) found evidence of lots of dust throughout the entire nuclear region, and determined that it had a big role in the variations in colour from knot to knot (D.A, D.L, E.E, R.W, K.-W, & D.N.B, 1988). They concluded that the hot spots were simply holes in the nuclear dust across a region that was undergoing star formation(D.A, D.L, E.E, R.W, K.-W, & D.N.B, 1988). Alonso-Herrero et al (2001) performed a high resolution IR study using information from the HST NIC2 and they were able to resolve the IR hot spots into stellar clusters (A, S.D, & J.H, 2001) and determined that they did not actually coincide with the HII regions (A, S.D, & J.H, 2001). Study showed that the HII regions were younger than the clusters (which were relatively young to begin with)(A, S.D, & J.H, 2001) and determined to be "the progenitors" of the clusters (A, S.D, & J.H, 2001).
In the studies, both spectrographic and photometric measurements were used to attempt to try and determine the properties of the hot spots. The spectrum of an object is the range of wavelengths it emits or absorbs. Studying an object's spectrum can help determine what an object is. For instance, in the paper by Oka et al. (1974) they found that a certain hot spot had a "blue" colour by the fact that it had strong Balmer absorption lines (Oka, Wakamatsu, Sakka, Nishida, & Jugaku, 1974). They attributed this to early-type stars.
Images are also taken at several different wavelengths, and compared. The appearance of an object/region is often different at different wavelengths, and this reflects its properties. In Simons et al (1988) they found flux in the Lyman continuum (IR) where there were no optical hot spots(D.A, D.L, E.E, R.W, K.-W, & D.N.B, 1988). They determined that this was due to the presence of obscuring dust(D.A, D.L, E.E, R.W, K.-W, & D.N.B, 1988) which has a tendency to absorb and scatter shorter wavelengths and leave longer wavelengths intact. Another technique that was used in Simons et al (1988) and Alonso-Herrero et al (2001) was called colour mapping. Essentially this involves dividing an image by another image taken in a different wavelength. In Simons et al (1988) they divided a K-band (IR) image by a V-band (green) image.(D.A, D.L, E.E, R.W, K.-W, & D.N.B, 1988) Regions of the image that were "redder" would have been brighter in the resulting image, while regions that were more blue would be dark (D.A, D.L, E.E, R.W, K.-W, & D.N.B, 1988). Comparisons of the data to known phenomena help further refine the results.
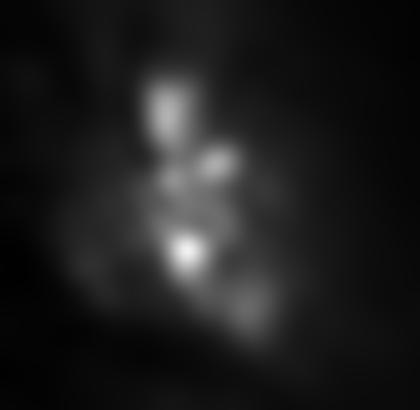 |
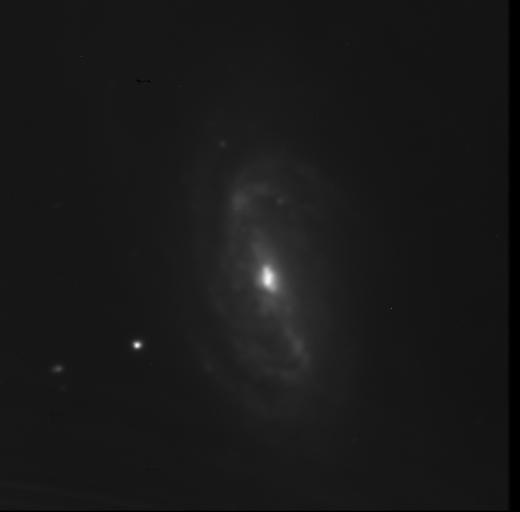
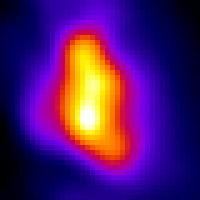
Obviously, the images cannot be expected to have anywhere near the resolution of the HST image used by Alonso-Herrero et al. (2001). But can the regions visible in the low resolution studies that came before be discerned in the GAO images? This is the nuclear region of the SDSS g filter image (FOV = 33.6"x33") blurred to approximately the level of detail visible in the study by Simons et al (1988) (using a gaussian filter of radius 4 pixels and enlarging with interpolation). I will be using this image to try and see whether any observed peaks or bumps in the nuclear region of my images correspond to hot spots in the blurred image. |
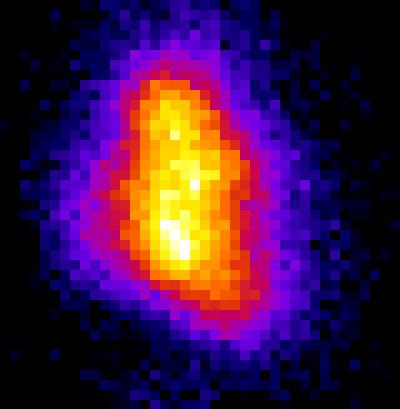
The contour plot of the blurred g filter image shows four distinct bright areas in this region, which I have labeled 1-4. All the images were enlarged with interpolation before the contours were plotted. |
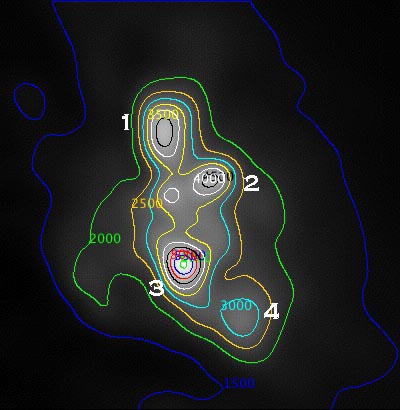 |
Contours: 6000 - green |
|
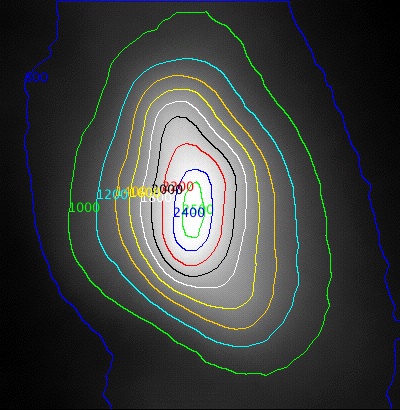 |
Contours: 2500 - green |
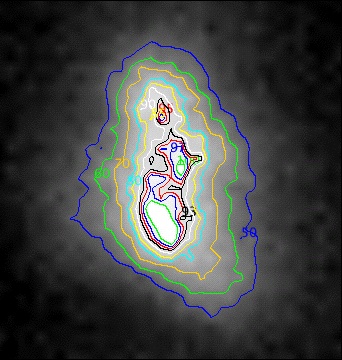 |
Contours: 100 - green |
 |
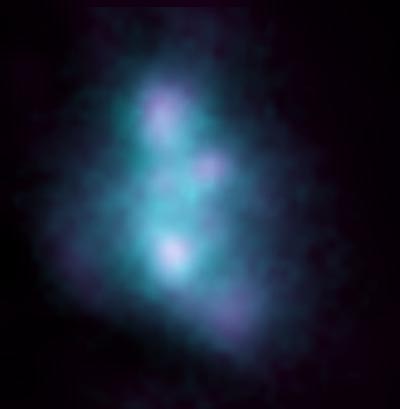 |
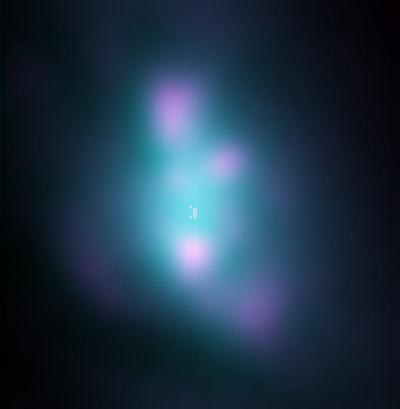
| These are two false colour overlays. The right image is the blurred image overlayed with the clear nucleus image, and the image on the left is overlayed with the blue nucleus image. It can indeed be seen that the bulges in the clear image correspond to the identified hot spots in the blurred image, with the brightest point at peak 2 as expected. It can also be seen that the three main peaks in the blue image correspond to areas 1, 2, and 3. |
|
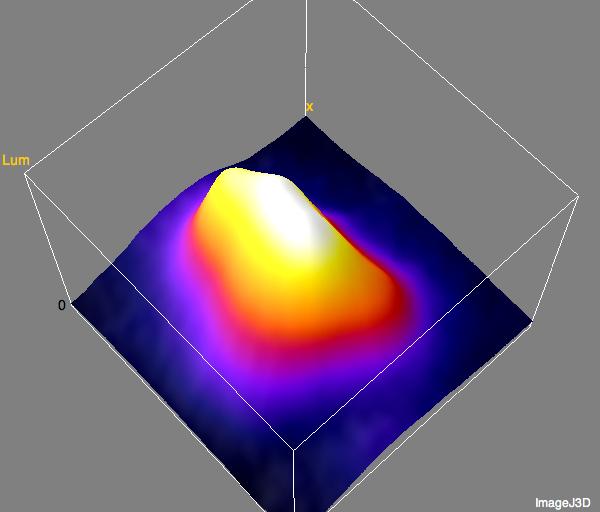
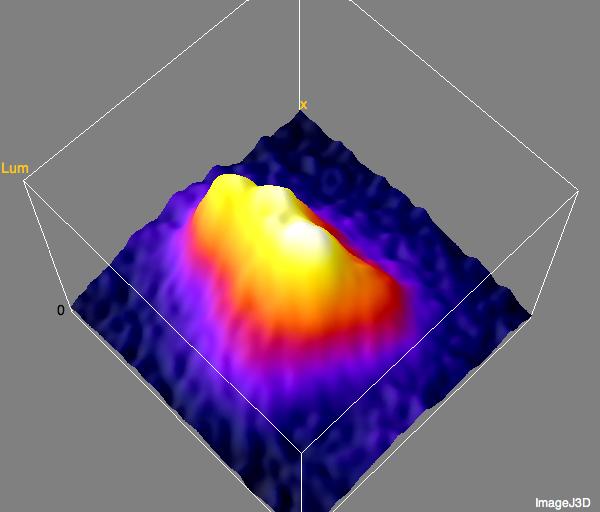
| The connections can be seen in the 3D plots as well. If you trace a smooth path from peak 1 to 2 to 3 it corresponds to the curvature of the surface of the clear plot from the bump at the back to the hottest point. On the blue plot peaks can be seen at the same points as 1, 2, and 3, and there are bulges in the clear and blue plots in an area corresponding to peak 4. | 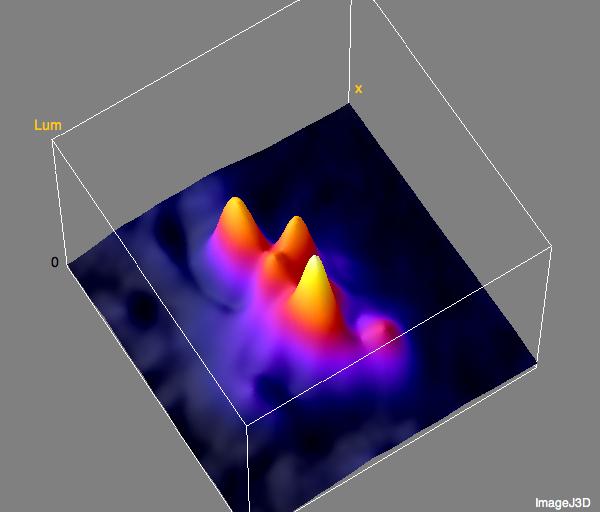 |
 |
 |
So, can we see the hot spots in our image? Yes, but they are pretty unresolved. The Simons paper listed its resolution (FWHM) at about 1", the resolution of our images is about 4.6"-4.7", plus the noisiness of the blue image wreaks havoc since the counts are so small to begin with. I suspect the difference in definition between the clear image and the blue image is due to the fact that the clear image is saturated with light of many wavelengths while the wavelengths that the blue image registered were a narrow band. All in all, these would not be good images if you were to attempt to study the properties of the hot spots. But are our images really so bad?
 |
 |
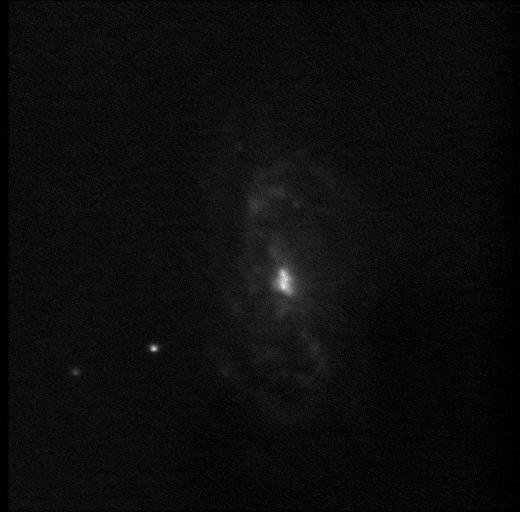 |
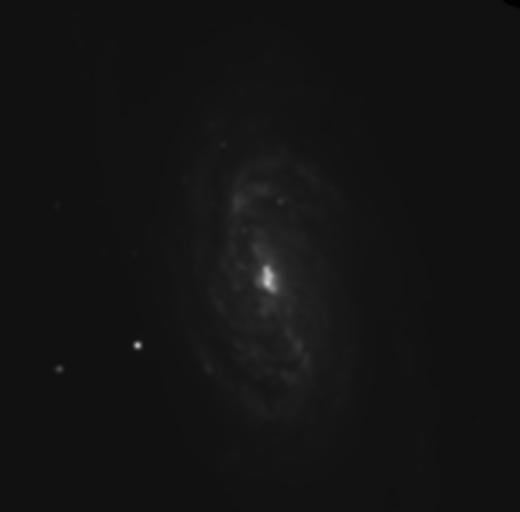
The image on the far left is a scaled and rotated SDSS g filter image with its FWHM blurred to about 4.8" to approximately match the resolution of our images. It matches my blue image (far right) quite well in terms of detail seen at this linear scaling. But in regards to the nuclei:
 |
 |
As can be seen here, the nucleus of the blurred SDSS image is a good match for the overall shape of my blue image, despite its noisiness. The clear nucleus is less of a match, but the SDSS image is filter data, so this may be due to the chip being exposed to broad band of wavelengths at once instead of a narrow band. The very best FWHM that can be expected at the Glenlea Astronomical Observatory is about 4 pixels (3.3" on the scale of my image) if the seeing is very good, so the resolution of our images could be a little better. Maybe the hot spots could be better resolved if the images had this resolution.
• Conclusions •
• Back • Index •
_________________________________________
Banner image is a slice of HST image by NASA/ESA