Lecture 12, part 1 of 3
| PLNT4610/PLNT7690
Bioinformatics Lecture 12, part 1 of 3 |
1. Types of data
2. What we are trying to learn
1. Sources of experimental variation
2. Experimental design
3. RNA
4. Sequencing technologies
1. de-novo assemblies vs. assembly by read mapping
2. Normalization
3. Which genes show a "significant" difference between treatments?
4. Differential expression

2 treatments x 6 times x 4 replicates = 48 RNA populations to be sequencedto generate the data. Although the data for each replicate are averaged, there is often a great deal of variation in the results, which can potentially negate any meaning. Therefore, extraordinary measures must be taken to minimize experimental variation at each step in the procedure, to minimize the overall variation.

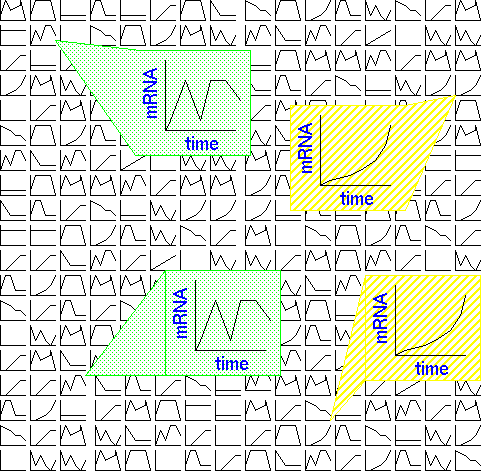
In the example,
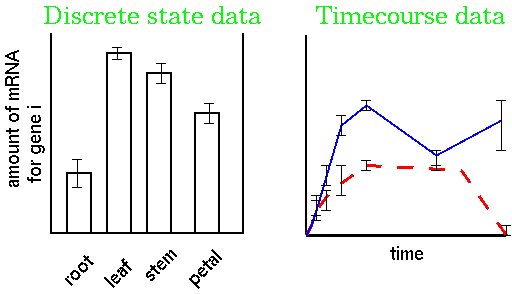
timecourse data are generated for each transcript in an RNA
population. The raw data consists of a series of expression
curves for timecourses, or histograms where other types of
treatments are being compared. The goal is usually to find which
groups of genes have the most similar expression patterns. In
the example, two genes (hatched background) show a gradual
induction over the period of the timecourse. Two other genes
(shaded background) show a biphasic response with two distinct
periods of strong expression.
Key questions:
|
RNA-seq has become the
method of choice for transcriptomics.because RNA-seq directly
counts cDNA copies of mRNAs, it has fewer sources of
experimental variance than microarrays. Because RNA-seq has now become
cost-competitive with microarrays, and the costs of sequencing
keep going down, RNA-seq is rapidly replacing microarrays.
| Comparison of
sources of experimental error |
|
| Microarrays |
RNA-seq |
| requires previously sequenced and annotated
genome |
NA |
| error in quantitation of RNA can affect ratios
of expression compared between two treatments |
NA |
| cDNA synthesis/labeling |
NA |
| quality of array |
NA |
| hybridization |
NA |
| washing |
NA |
| measurement of signal |
NA |
| NA - not
applicable |
|
 Unless otherwise cited or
referenced, all content on this page is licensed under
the Creative Commons License Attribution
Share-Alike 2.5 Canada Unless otherwise cited or
referenced, all content on this page is licensed under
the Creative Commons License Attribution
Share-Alike 2.5 Canada |
| PLNT4610/PLNT7690
Bioinformatics Lecture 12, part 1 of 3 |