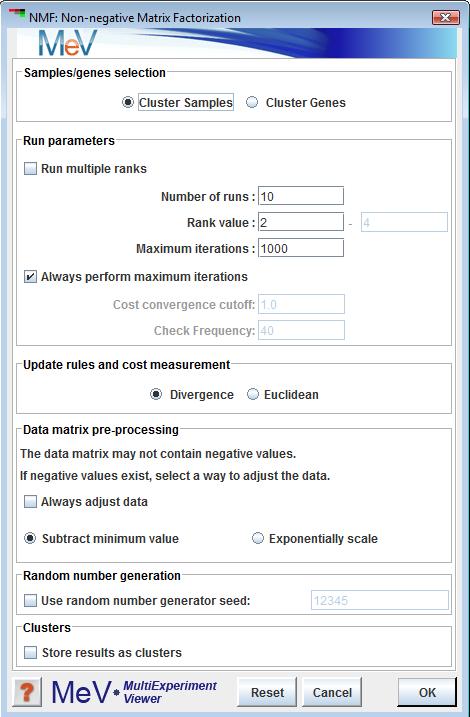
Non-negative Matrix Factorization Dialog box
(Brunet et al, 2004)
(Devarajan K, 2008)
(Lee, Seung 2001)
Non-negative Matrix Factorization, a technique which makes use of an algorithm based on decomposition by parts of an extensive data matrix into a small number of relevant metagenes. NMF’s ability to identify expression patterns and make class discoveries has been shown to able to have greater robustness over popular clustering techniques such as HCL and SOM.
MeV’s NMF uses a multiplicative update algorithm, introduced by Lee and Seung in 2001, to factor a non-negative data matrix into two factor matrices referred to as W and H. Associated with each factorization is a user-specified rank. This represents the columns in W, the rows in H, and the number of clusters to which the samples are to be assigned. Starting with randomly seeded matrices and using an iterative approach with a specified cost measurement we can reach a locally optimal solution for these factor matrices. H and W can then be evaluated as metagenes and metagenes expression patterns, respectively. Using a “winner-take-all” approach, samples can be assigned to clusters based on their highest metagenes expression. Multiple iterations of this process allow us to see the robustness of the cluster memberships. Additionally, running multiple ranks consecutively can allow for the comparison between differing numbers of classes using cophenetic correlation.
NMF is most frequently used to make class discoveries through identification of molecular patterns. The module can also be used to cluster genes, generating metasamples rather than metagenes.
Sample Selection
The sample selection option indicates whether to cluster genes or samples. The default is sample clustering.
Run multiple ranks
This checkbox determines if NMF will be performed on one rank or compared across multiple ranks. Selecting this option will allow the user to choose a rank range.
Number of runs
Specifies the number of factorization runs to perform on each rank. Typically, this value is between 20 and 100.
Rank Value/ Rank Range
The value or range of ranks for which NMF is performed. This is an integer, or set of integers greater than 1 which will also correspond to the number of clusters.
Maximum iterations
The maximum number of iterations to be completed as W and H approach a local optimization.
Always perform maximum iterations
Specifies whether or not MeV should complete the maximum number of iterations or stop after a certain convergence has been reached.
Cost convergence cutoff
The point at which a run can be halted based on sufficient convergence.
Check Frequency
The frequency, in iterations, of checking for convergence.
Update rules and cost measurement
The algorithmic technique, as described by Lee and Seung, for iteratively updating the factor matrices and the manner in which their cost is measured. The default is “Divergence”.
Data matrix pre-processing
A requirement for running NMF is a data matrix free of negative values. If your data includes negative values, a method must be selected to adjust the data. If “Always adjust data” is checked, the selected operation will be performed, regardless of your data. If unchecked, the selected operation will only be performed if a search through the data reveals negative values. After running your analysis, the preprocessing step (if any) will be recorded in the General Info tab.
Subtract minimum value means that the lowest value in the data, regardless of that value’s negativity, will be subtracted from all values, ensuring a non-negative matrix.
Exponentially scale means that every value will be exponentiated, base 2.
Random Number Generation
For the purpose of reproducibility, NMF allows the addition of a seed value for the creation of initial generation of W and H matrices. Use of the same seed value on runs of NMF with identical parameters will result in identical results.
Store results as clusters
Selecting this option will cause the creation and storage of the results as clusters in MeV’s clustering system. These clusters will be visible in the Cluster Manager as well as in MeV’s experiment viewers.
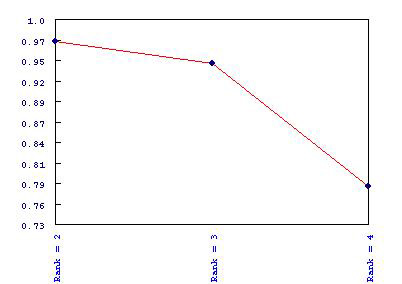
For each rank analyzed, MeV’s NMF calculates a cophenetic correlation that is used to quantify the robustness of the rank’s evaluation. This is reported as a node at the top of the result tree for each rank. In the case where multiple ranks are run, a Cophenetic Correlation Graph is created and displayed in the result tree. This gives a visual representation of the relative strength of clustering associated with each rank.
For each rank, MeV displays standard result viewers for each of the clusters, including heatmaps, expression graphs, centroid graphs, tables, and general cluster information.
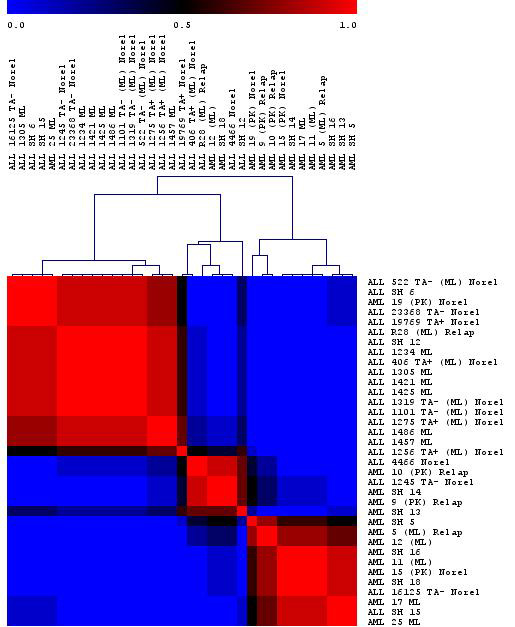
The Consensus Matrix with Hierarchical Clustering is a visual representation of the clustering and its robustness. The viewer is a square matrix with dimensions equal to the number of samples (or genes, if “Cluster Genes” was selected).
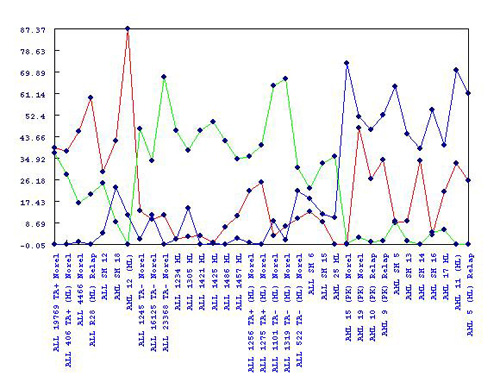
Metagene and metagene expression patterns are reported in subfolders for each rank. Each rank will have a set of metagenes and metagene expressions corresponding to the factor matrices W and H of each run. Each set are displayed in ranking order of cost, with the most optimal metagenes displayed first. The raw values can be seen and extracted for further analysis in the “Metagenes (W)” and “Metagene Expressions (H)” folders.
Color coded graphs for these values exist in the subfolders beneath the raw values. These offer a visual representation of the strength of each metagene or metagene expression pattern on a particular sample or gene. By right-clicking on the graph, a sorting function can be toggled which, when on, orders the samples (or genes) according to the metagene with the highest expression.