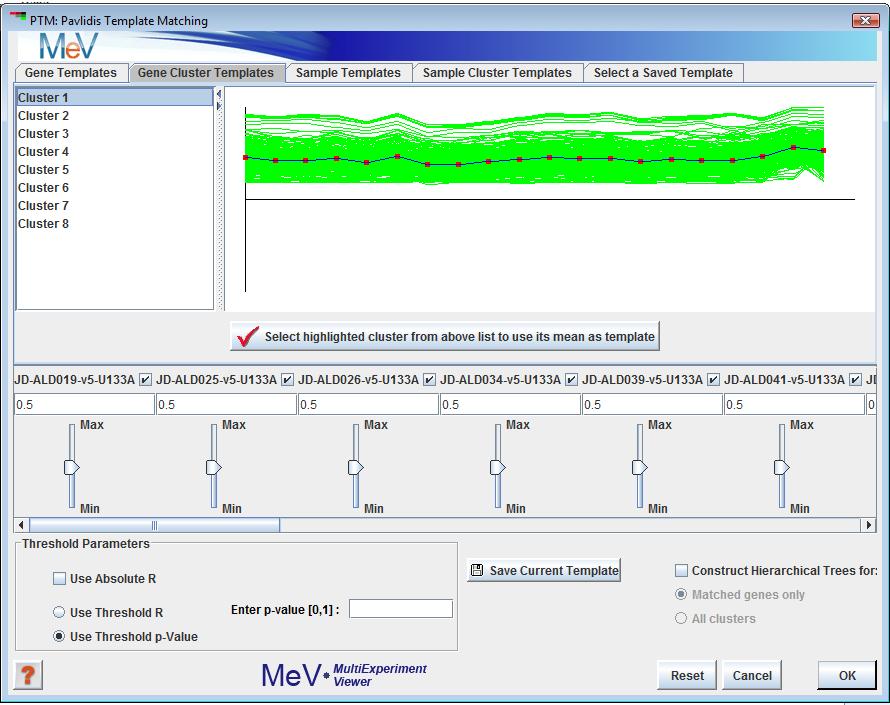
Template Matching (PTM) initialization dialog
(Pavlidis and Noble 2001)
The user can specify a template expression profile for a gene (a series of relative expression ratios between 0 and 1), and the data set will be searched for matches to the template, based on the Pearson Correlation between the template and the genes in the data set. The template profile can be specified in one of several ways: 1) by selecting one of the genes in the data set as a template from the list on the upper left, and then clicking the "Select highlighted gene" button; 2) doing the same thing with one of the cluster means, assuming that clusters have already been set by some other method; 3) entering values between 0 and 1 in the text input fields above the slider bars corresponding to each experiment; or, 4) Adjusting the slider bars to the desired values. Matches can be made by considering either the signed or the unsigned values of correlation coefficient (using the checkbox labeled "Match to Absolute R?"), and the threshold criterion for matching can be either the magnitude of the correlation coefficient, or the significance (p-value) of the correlation coefficient.
The five tabbed panels at the top of the dialog select to view candidate templates from various sources.
The tab provides a list of genes in the data set and their expression profile graphs. Selection of elements in the list display the expression pattern for that gene.
The , and Sample Cluster Template tabs provide the same functionality but use experiment templates.
The tab provides an interface for loading gene and experiment templates. Templates loaded from files will populate a list from which a template may be selected.
A button in each of these areas is used to select the displayed template for matching.
Use Absolute R
Using this option will select expression patterns that are either positively or negatively correlated with the template.
Use Threshold R
This option will indicate that the threshold value for determining a match is the R value between the expression vector and the template.
Use Threshold p-Value
This option will indicate that the threshold value for determining a match is the p value on R between the expression vector and the template.
Threshold Input Value
This is either a supplied value for R or a p-value ranging from 0.0 to 1.0. R values closer to 1.0 are more stringent. p-values closer to 0 are more stringent.
Save Template
This button launches a file browser to allow the user to save the current template to a tab delimited text file. These files can be loaded from the Saved Template tab interface.
Hierarchical Clustering
This check box selects whether to perform hierarchical clustering on the elements in the resulting matched and unmatched element sets.
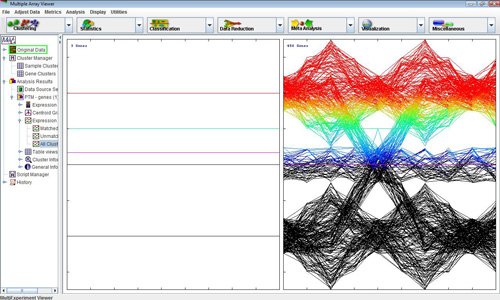
Template matching is particularly useful when the researcher is searching for a specific expression pattern. Applying this method with the input parameters in the previous figure gives the following output, where the first panel on the right corresponds to genes that matched the template, and the second panel to genes that did not match: