One sample design
(Dudoit et al. 2000, Pan 2002, Welch 1947, Zar 1999, Korn, et al. 2001, 2004)
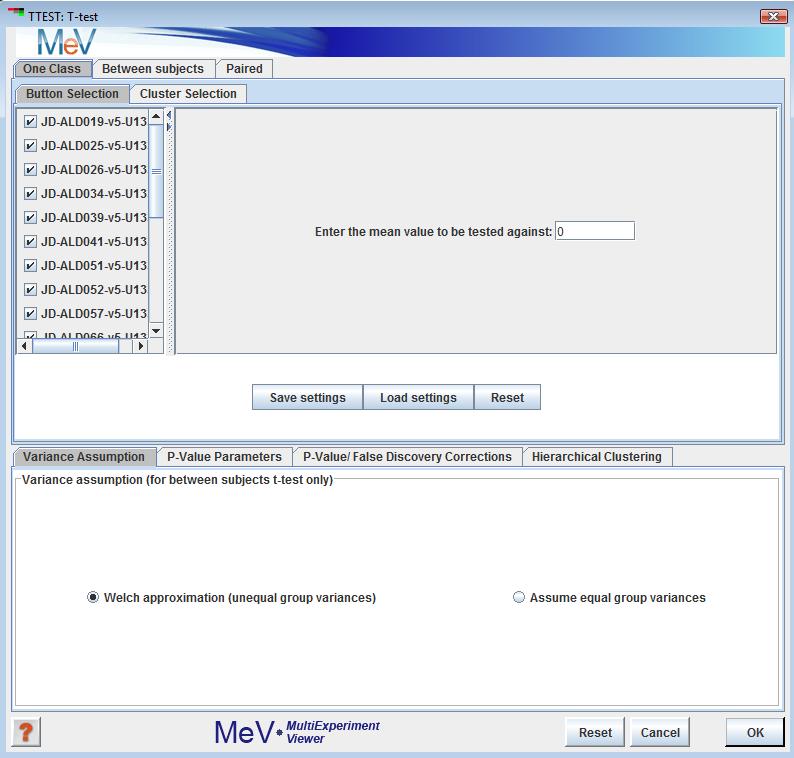
Three t-test designs are implemented: one-sample, paired and between-subjects. In the one-sample design, the user specifies a mean. Each gene whose mean log2 expression ratio over all included samples is significantly different from the user-specified mean is assigned to one cluster, while those genes whose means are not significantly different from the user-specified mean are assigned to another cluster. To exclude a sample from the analysis, uncheck the box next to that sampleĺs name in the left pane of the one-sample screen.
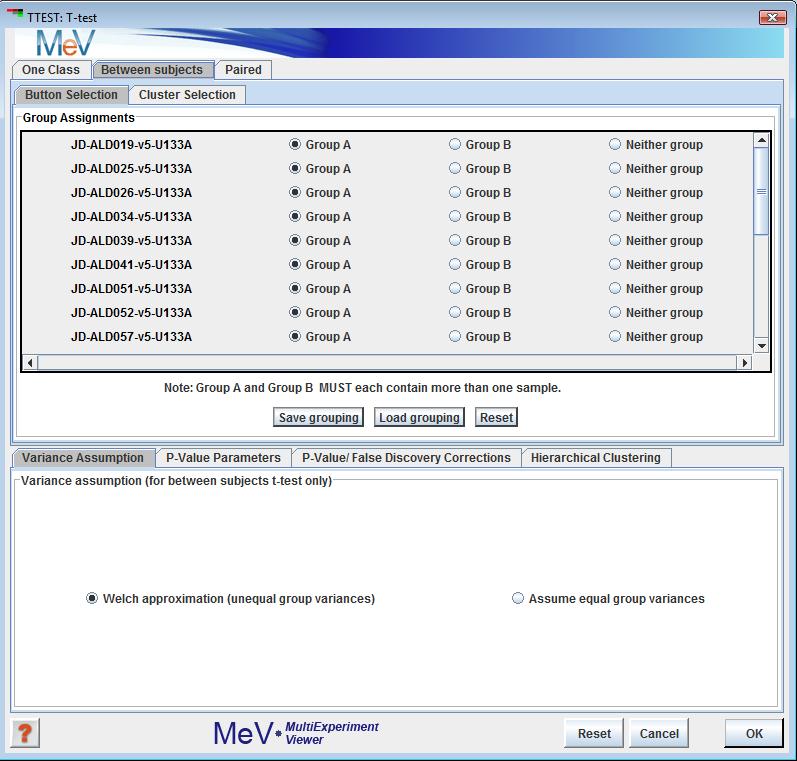
In the between-subjects design, samples can be assigned to one of two groups, and genes that have significantly different mean log2 expression ratios between the two groups are assigned to one cluster, while the genes that are not significantly different between the two groups are assigned to another cluster. The user may choose to exclude some samples from the analysis, which can be done by selecting the ôneither groupö option for those samples in the initialization dialog (see screenshot below). For the between-subjects t-test, we can use the Welch t-test for small samples with unequal variances in the two groups (Welch 1947), or assume equal variances.
In the paired design, samples are not only assigned to two groups, but there is also a one-to-one pairing between a member of group A and a corresponding member of group B (e.g., gene expression measurements on a group of subjects, where measurements are taken before (Group A) and after (Group B) drug treatment on each subject).
T-values are calculated for each gene, and p-values are computed either from the theoretical t-distribution, or from permutations of the data for each gene. Whether a geneĺs mean expression level is significantly different between the two groups is determined either by directly comparing the geneĺs p-value with the user-specified critical p-value or alpha, or by adjusting the p-values using a correction for multiple testing (see screenshot on the right).
One-class/Between Subjects/Paired Panel
In the one-class design, samples can be included or excluded by checking or unchecking the checkboxes next to each sample name. The user can also specify the test mean. In the between ľsubjects panel, the buttons permit each sample to be placed into group A, group B, or neither group. If an experiment is placed in neither group it will be ignored for the purposes the analysis. Note that groups A and B must each have at least two members following the assignment. The paired panel allows the specification of pairs of experiments.
Save Grouping/Setting
The save grouping/setting button allows you to save the grouping or setting to file. This is particularly useful when there are many experiments.
Load Grouping/Setting
This button allows you to select and load a saved grouping or setting.
Reset
The reset button returns all of the settings to the original settings.
This set of controls are used to indicate the method by which p-values are determined for each gene and allows the input of the critical p-value. p-values can be computed either from the theoretical t-distribution, or from permutations of the data for each gene between the two groups.
p-values based on t-distribution
Using this option a gene's p-value is taken directly from the theoretical t-distribution based on the gene's calculated t-value.
p-values based on permutation
Using this option, a gene's p-value is determined by forming a distribution based on permutations of the data for that gene. For the one class t-test, in each round of permutation, some of the values in the expression vector are picked at random to be replaced by the following quantity: (original value) - 2x(original value - hypothesized mean). Thus, the randomized vectors have some of their elements randomly ôflippedö about the hypothesized mean. For the between subjects t-test, the permutations allow each value in the expression vector in group A or group B to be randomly placed into either group (the size of each group is conserved). t-values are constructed following each permutation to construct a distribution which is used to generate p values for each gene based on its t-value. If permutations are used, two buttons allow you to select to permute the values a number of times indicated, or to permute the values a number of times equal to the maximum number of permutations possible.
Critical p-value
This text field allows you to enter the alpha or critical p-value
The p-values for each p can be adjusted to correct for the large number of observations (genes) and the increased possibility of considering a gene without a real significant change to be considered significant. Alternatively, a false discovery threshold can be set such that the number or proportion of false positives in the significant gene list does not exceed a specified level with a certain confidence.
Just Alpha (no correction)
Using this option the alpha is not altered.
Standard Bonferroni Correction
In the standard Bonferroni correction, the user-specified alpha is divided by the number of genes to give the critical p-value. This is much more stringent than using an uncorrected alpha.
Adjusted Bonferroni Correction
In the adjusted Bonferroni correction, the t-values for all the genes are ranked in descending order. For the gene with the highest t-value, the critical p-value becomes (alpha / n), where n is the total number of genes; for the gene with the second-highest t-value, the critical p-value will be (alpha/ n-1), and so on. The stringency of this correction falls somewhere between no correction and the Standard Bonferroni.
Step-down Westfall-Young MaxT correction (Dudoit et al. 2003)
In this method, the genes are ranked in descending order of their absolute t-values, and the adjusted p-values are computed by an algorithm described in Dudoit et al. 2003.
False discovery control
The algorithms are described in Korn et al. 2001, 2004.
Hierarchical Clustering
This check box selects whether to perform hierarchical clustering on the elements in each cluster created.
P-value corrections reduce the probability that a non-significant gene will be erroneously picked as significant. This can be a serious issue when many tests are done (which is usually the case in microarray analyses, as there are as many tests as there are genes in the analysis). The standard Bonferroni correction is very stringent and may exclude many genes that are really significant, whereas the adjusted Bonferroni correction is less conservative, and more likely to include significant genes while still controlling the error rate. The step-down Westfall-Young MaxT correction is also less conservative than the standard Bonferroni correction, and still provides statistical power. False discovery control is a useful option as p-value corrections can be too stringent for microarray analysis.
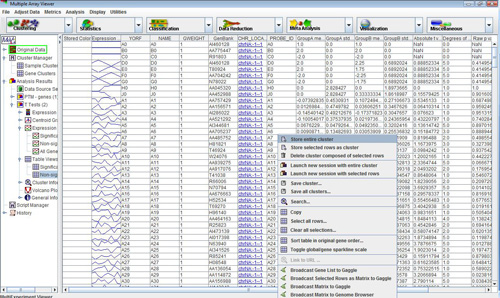
The TTEST module also outputs table viewers with gene-specific statistics as shown below. These tables can be saved as tab-delimited text files by right-clicking on them. All the columns in the tables can be sorted in ascending or descending order. Successive clicks on a column header re-order the rows in ascending or descending order of the values in the selected column. Holding down the CTRL key while clicking anywhere on the header will restore the original ordering.
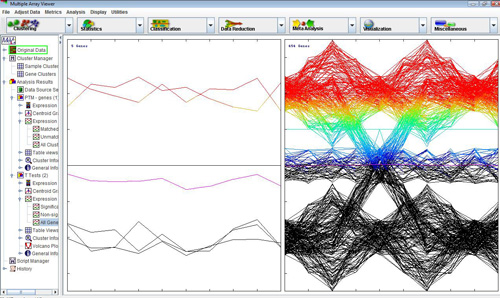
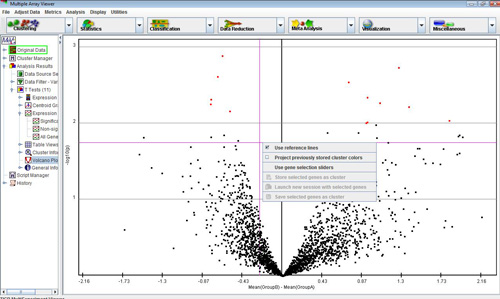
Another non-standard TTEST viewer is the volcano plot viewer. This plot shows the difference between the means of groups A and B for each gene plotted against the negative log10 p-value associated with its t-value. A volcano plot gives an intuitive visual sense of the nature of the relationship between the mean differences between groups and the statistical significance of those differences, for the data set as a whole. Right-clicking on this plot brings up options for toggling the reference lines on and off, selecting genes from the plot using slider bars, storing these selected genes as clusters, and projecting cluster colors from previous analyses on to the volcano plot.