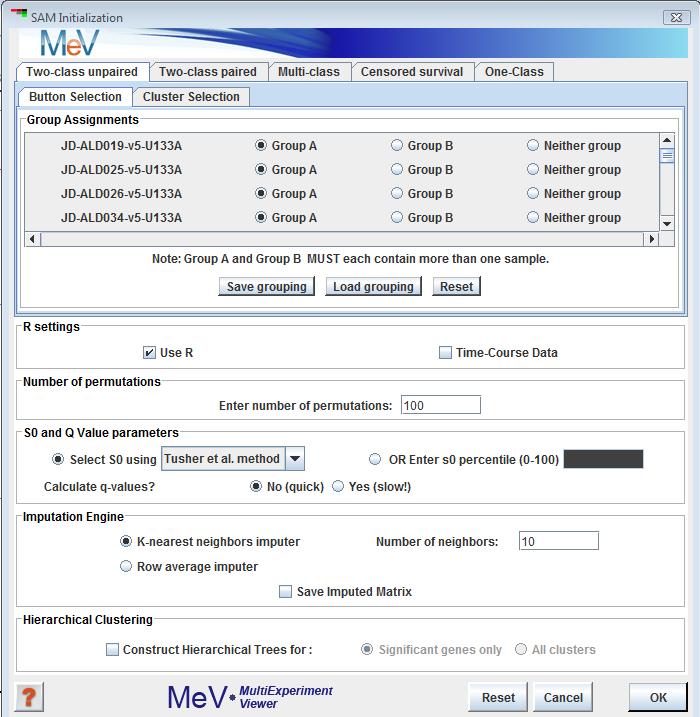
SAM Initialization Dialog
(Tusher et al. 2001 implemented as in Chu et al. 2002)
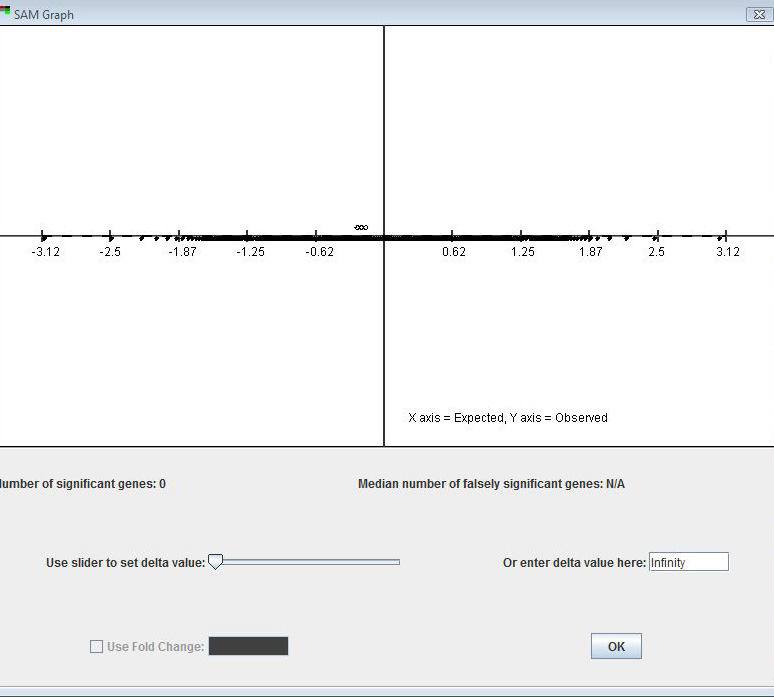
SAM can be used to pick out significant genes based on differential expression between sets of samples. It is useful when there is an a-priori hypothesis that some genes will have significantly different mean expression levels between different sets of samples. For example, one could look at differential gene expression between tissue types, or differential response to exposure to a perturbation between groups of test subjects. A valuable feature of SAM is that it gives estimates of the False Discovery Rate (FDR), which is the proportion of genes likely to have been identified by chance as being significant. Furthermore, SAM is a very interactive algorithm. It allows users to eyeball the distribution of the test statistic, and then set thresholds for significance (through the tuning parameter delta) after looking at the distribution. The ability to dynamically alter the input parameters based on immediate visual feedback, even before completing the analysis, should make the data-mining process more sensitive.
Currently, SAM is implemented for the following designs:
1) , where samples fall in one of two groups, and the subjects are different between the two groups (analogous to a between subjects t-test). The initialization dialog box is similar to the t-test dialog.
The user inputs the group memberships of the samples in the top panel. In the two-class design, genes will be considered to be “positive significant” if their mean expression in group B is significantly higher than in group A. They will be considered “negative significant” if the mean of group A significantly exceeds that of group B.
2) ,in which samples are not only assigned to two groups, but there is also a one-to-one pairing between a member of group A and a corresponding member of group B (e.g., gene expression measurements on a group of subjects, where measurements are taken before (Group A) and after (Group B) drug treatment on each subject).
3) where the user specifies the number of groups (>2) that samples fall into. Genes will be considered significant if they are significantly different in expression across some combination of the groups.
4) where each sample is associated with a time and a state (censored or dead). Censored samples are those for which the subject was alive at the time the data were collected, and no further data are available for those subjects.
5) in which the user specifies a value against which the mean expression of each gene is tested. A gene is considered significant if its mean log2 expression ratio over all included samples is significantly different from the user-specified mean. To exclude a sample from the analysis, uncheck the box next to that sample’s name in the left pane of the one-class screen.
controls for this model allow the inclusion or exclusion of particular experiments using the check boxes to the left of the experiment names. For those experiments included a corresponding time and a state is selected (Censored, or Dead).
: This integer number indicates the number of times each vector should be permuted and have a d-statistic computed.
: SAM handles missing data by constructing or imputing missing values using one of two available methods. The This option imputes a value based on the k nearest neighbors (using Euclidean distance) to the vector which is missing the value. The k nearest neighbors are selected such that each should have a value for the missing vector element. The imputes by taking the mean of the other elements in the vector which is missing the value.
, if checked, performs hierarchical clustering on the elements in each cluster created.
The data for each gene are permuted, and a test statistic d is computed for both the original and the permuted data for each gene. In the two-class unpaired design, d is analogous to the t-statistic in a t-test, in that it captures the difference among mean expression levels of experimental conditions, scaled by a measure of variance in the data. Missing values in the input data matrix are imputed by one of two methods: 1) replacing missing expression measurements with the mean expression of a row (gene) across all columns (experiments), OR 2)where the “K” most similar genes (using Euclidean distance) to the gene with a missing value are used to impute the missing value.
SAM generates an interactive plot of the observed vs. expected (based on the permuted data) d-values. The user can change the value of the tuning parameter delta using either the slider bar or the text input field below the plot. is a vertical distance (in graph units) from the solid line of slope 1 (i.e., where observed = expected).
If SAM has been used at least once during a run of MeV, the input parameters and SAM graph of the last run can be called up by default, thus bypassing the need to run SAM again for that set of parameters.
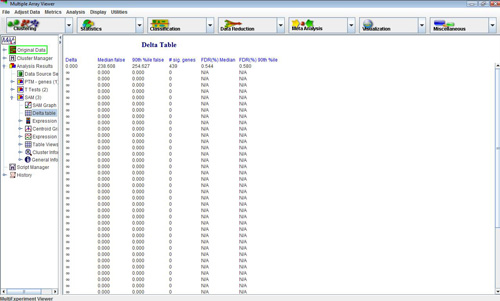
In addition to the standard viewers and information tabs, SAM also outputs a SAM graph viewer, as well as a Delta table viewer, which contains output information for a range of SAM values. This information can be saved as a tab-delimited text file by right-clicking on the table. The clusters saved from the other viewers will store gene-specific SAM statistics in addition to the annotation and expression measurements stored in clusters from most other modules.
: Typical SAM runs provide an interactive graph and delta slider for selection of a delta value and associated false discovery rate. During SAM parameter selection for script creation this dialog permits the user to enter a delta value directly. This eliminates the interactive graph which can be desirable during long script executions.
Alternatively, one can select the check box to enable the SAM graph interaction. If this is selected the script will execute up until the graph is displayed. Once the graph is used for delta selection and dismissed, the algorithm and subsequent algorithms in the script will be executed.