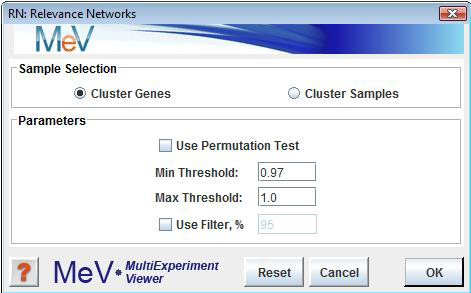
RN Initialization Dialog
(Butte et al. 2000)
A relevance network is a group of genes whose expression profiles are highly predictive of one another. Each pair of genes related by a correlation coefficient larger than a minimum threshold and smaller than a maximum threshold (assigned in the initialization dialog box) is connected by a line. Groups of genes connected to one another are referred to as networks.
Sample Selection
The sample selection option indicates whether to cluster genes or samples.
Use Permutation Test
This check box is used to indicate that the minimum threshold R2 value should be selected based on a distribution constructed from element to element R2values derived following permutation of the expression vectors.
Min Threshold
This value ranging from 0 to 1.0 indicates the smallest R2possible between two elements to permit a link between the elements in a subnet.
Max Threshold
This value ranging from 0 to 1.0 indicates the greatest R2possible between two elements to permit a link between the elements in a subnet.
Use Filter
This option allows the user to filter out elements with little dynamic change thus removing flat or uninteresting elements. A measure of entropy is used to rank the elements. The percentage value entered (1 to 100) indicates what percentage of the elements to retain for the construction of the network. A value of 25 will retain the 25% of elements having the greatest entropy.
: Pearson squared
: None. Changing the metric in the Distance menu will not affect the calculations done by this module.
The module calculates the correlation coefficient between genes by comparing the expression pattern of each gene to that of every other gene. The ability of each gene to predict the expression of each other gene is measured as a correlation coefficient. Genes are represented as nodes in a network and edges are drawn between them if their correlation coefficient falls between the minimum and maximum thresholds specified in the initialization dialog.
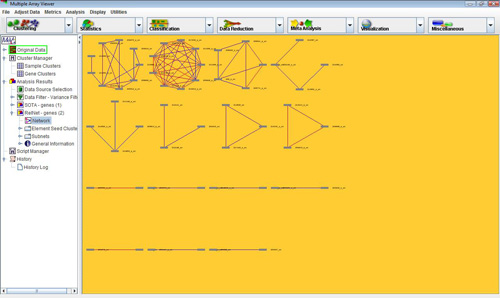
The experiment subtree created by this module contains information regarding the networks predicted. Under the tab is a graph of all of the subnets generated. A subnet is a group of genes in which each gene is connected to at least one other gene. The tab contains network diagrams for each of the individual subnets, and the folder contains expression views for the genes in each of them.
Several options can be launched from the network viewer to enhance the view or to better characterize the results by using a right click context menu. Note that links colored in red represent elements that are positively correlated while links colored in blue represent elements that are negatively correlated. Options from the menu to enhance the view include the ability to zoom in and out on the subnets, alter the color of the background, alter the element shape, and alter the thickness of the links for better visibility.
Other options reveal the nature of the subnets. You can select to alter the threshold to make it more stringent. Using this option under the the viewer is instructed to only show links for elements correlated with R2 greater that the new threshold. Selection of elements in the network can be done by using the option in the right click menu. Two options are offered for selecting elements, one by providing a gene identifier label (), and the second option by specifying all elements with a specified minimum number of links (). As in other viewers selected elements may be assigned a color ().