| Contents | About the Program |
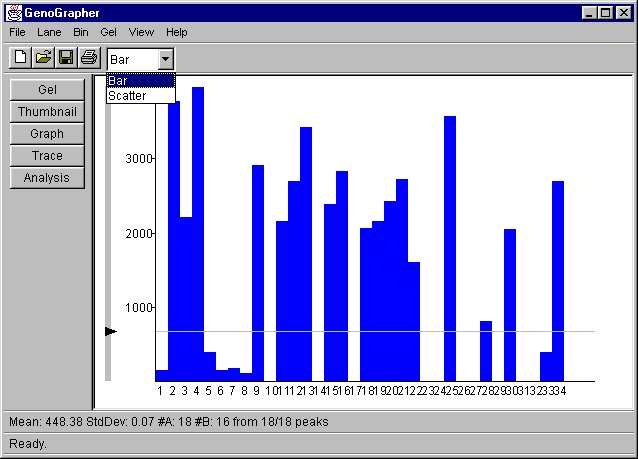
Displays a graph of the bin currently selected in the gel view. The type of graph can be selected from the button bar. Cutoffs are manipulated in a manner identical to that used for the thumbnails.
Each bar represents a lane. The height of the bar is proportional to the height of the highest peak in the lane (and within the bin). If more than one peak appear per lane in the bin, then the bar is black. If only one peak is defined for a lane, then the bar is blue.
A mark is plotted for the maximum peak in a lane and in the bin, giving the peak distributions for the bin. If more than one peak in a given lane is defined in the bin, then the mark is drawn in red, otherwise it is drawn in black.
The buttons have the same function as they do in the thumbnail view.
| Contents | About the Program |