| Contents | About the Program |
This provides a walk through of the program and introduces some of it's features.
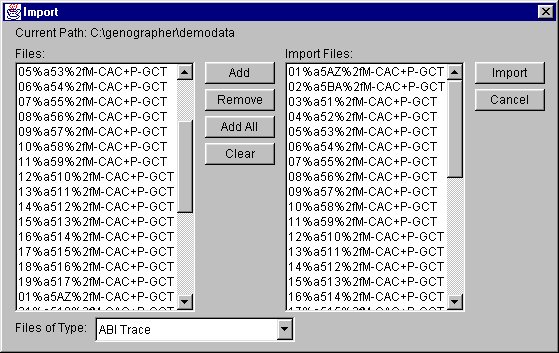
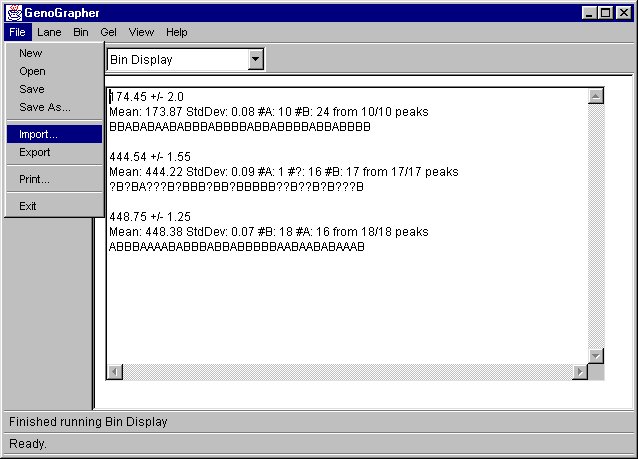
Once the program is running (see Running and Installing), select "File|Import...". Locate the "demodata" diretory and double-click on it, the click on "Add All" and then click "Import".
Options for the ABI Trace file format will now be shown, since the data color is blue, nothing has to be changed, so simply click "Ok". Wait of the lanes to load. As they are loading, information will be displayed at the bottom of the screen.
Next, adujust the view. On the button bar, type in the numbers "50" and "500", so the bar reads "Size: 50 to 500" and change the intensity to 2.0, then click the button with the green arrows going in a circle to the right of the intensity field. This is the "Redisplay" button and it will update the gel so that it shows the changes. Note that 50 to 500 is the range between the size standards defined for this data. Be patient since updating the gel can take a little while.
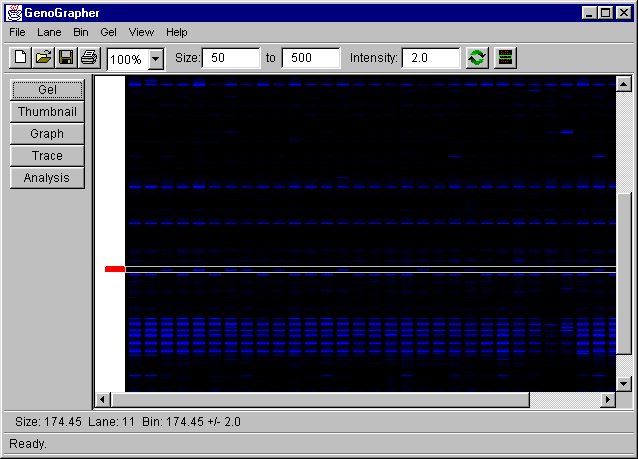
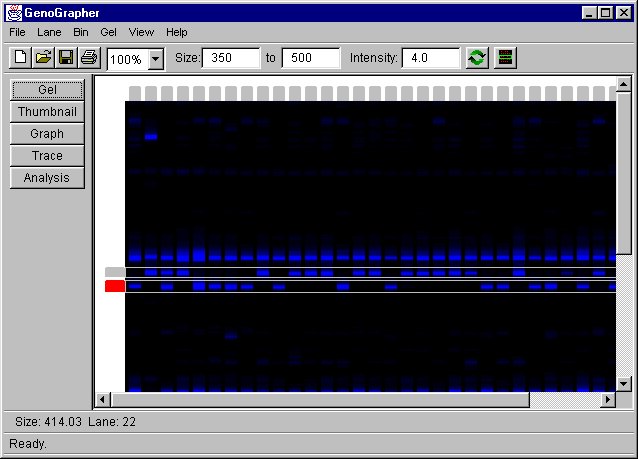
As the mouse is moved, the lane and size are shown at the bottom of the screen. Look at the 174 bp area. You will notice a region that looks like it is segregating. Click the mouse at 174.45 bp and a bin will be created. Now look at the 450 bp region. There appear to be two segregating bands, but they are dim and somewhat close to eachother. Take a closer look by setting the gel to view size 350 to 500 at an intensity of 4.0. This technique is useful for finding band that are hard to distinguish. Now click to add bins around the two segregating bands. Dragging the border of the bin will adjust it's size. The result should look something like the picture below.
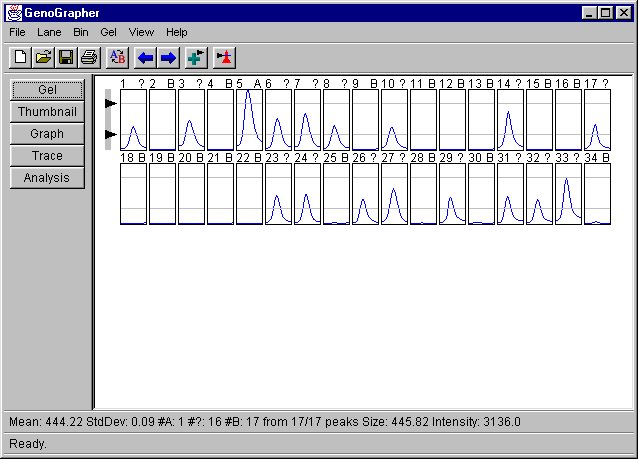
Now change the size back to 50 to 500 and then select the bin at 174bp by clicking on the tab to the left. It should turn red. Then click on the "Thumbnail" button on the left of the screen. Drag the arrow down so that it catches all of the peaks. You will notice the scoring labels above each lane trace change as the cutoff level moves. The bottom of the screen will show more infomation about the bin.
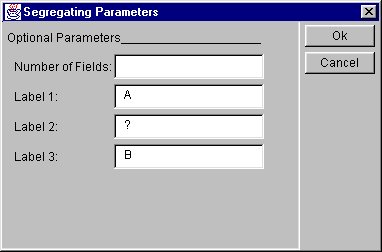
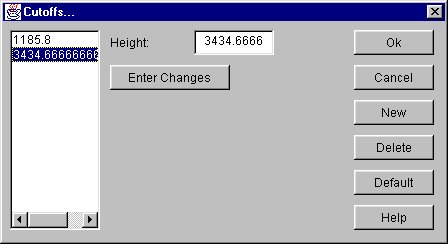
Next, click on the "Next" button, the blue arrow pointing to the right. This will display the next bin in the gel. We will add another cutoff to this bin. Click on the "Add Cutoff" button, the one with the plus sign and an arrow. The program will say "The number of cutoff levels does not match the expected number of 1" because the bin is set to score with only one level. Click "Ok" and the program will automatically prompt you to adjust the bin. Enter the values shown below and click "Ok"
The bin will be rescored when one of the cutoffs is moved. Move the upper level by dragging the arrow up or clicking above it. If it does not rescore, click and then release on one of the arrows. You should have something like this:
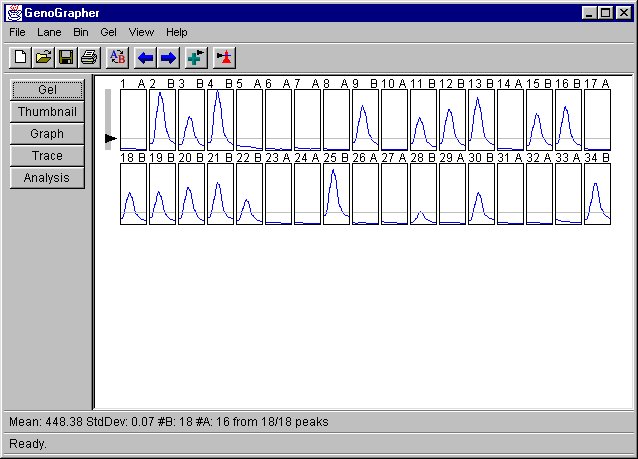
Again click the "Next" button to view the final bin. This data has the parents in lanes one and two. In many cases, one would like the lanes like parent 1 to be A and those like parent 2 to be B. However, the program currently has it backwords. First, remove the additonal cutoff by selecting the right-most button. This will bring up the Cutoff Dialog box. Select one of the levels, and then click "Delete" Click "Ok" to close the dialog box.
Move the remaining cutoff so that it catches all of the peaks. When the program prompts you to enter labels, just enter "A" and "B". Move the arrow so that the bin is rescored. To adjust the scoring so that it recognizes the correct parent, click the "Invert" button, which has an "A" and a "B" on it. The result should look something like this:
The bins can be scored manually if neccessary. Pick any lane and click above the cutoff, the click below. You should see the label change at some point. See the description of the thumbnail view for more information.
Save the project so that you can come back to it later by selecting "File|Save" The file can be opened later with "File|Open"
| Contents | About the Program |