Windows and Linux View. Click to enlarge
|
Windows and Linux View. Click to enlarge |
|
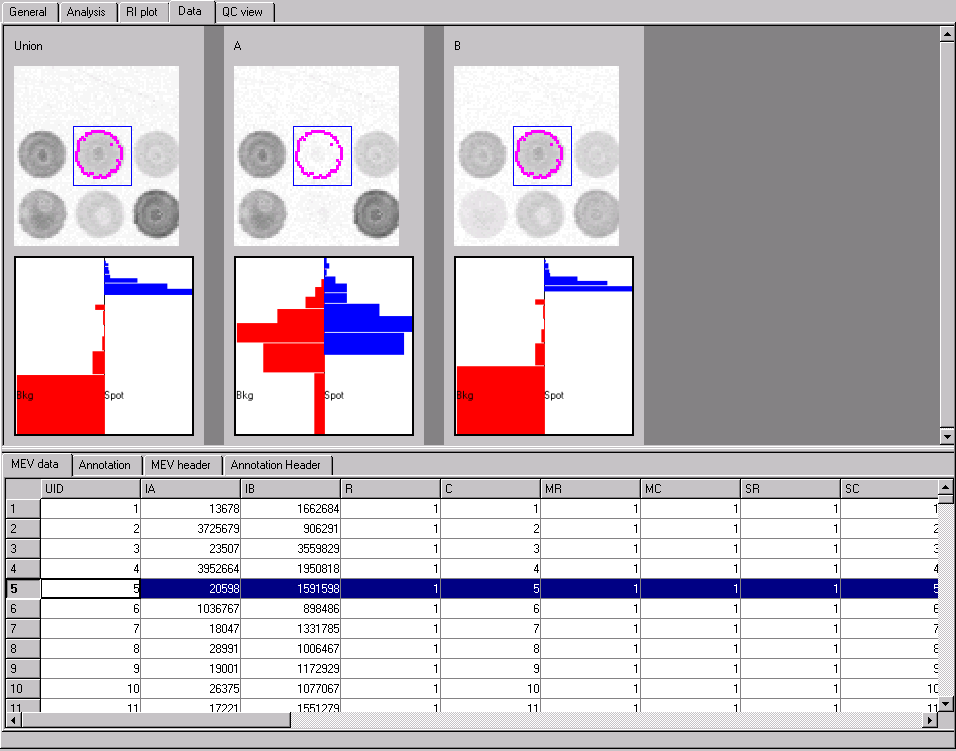
Data Page was designed to dislpay spots data after processing. The dispalyed data include spatial information about detected spot shape and its numerical parameters shown below on spreadsheet like control. Data Page is a splitted display. The vertical location of the splitter can be adjusted by user. Its upper part consistes of a number of panels with selected spot view and spot/background histogram in all channels. The lower part is a Table View.
Table View is a set of the interactive tables for viewing processed data in MEV file format shown as if it is opened in spreadsheet. The Data Page depictes MEV file header and body separately in two different tables: MEV header and MEV data. These two tables give user complete view of the future mev file, which program creates when user stores data in mev file. Before to store data to MEV file user may add comments to MEV header. The last line of MEV header can be used for this. If annotation file is available it can be loaded and displayed in tables Annotation and Annotation header. All tables are read only ( above mentioned comment line in MEV header is the only exception) and interactive. For more details on MEV file or Annotation file click appropriate link.
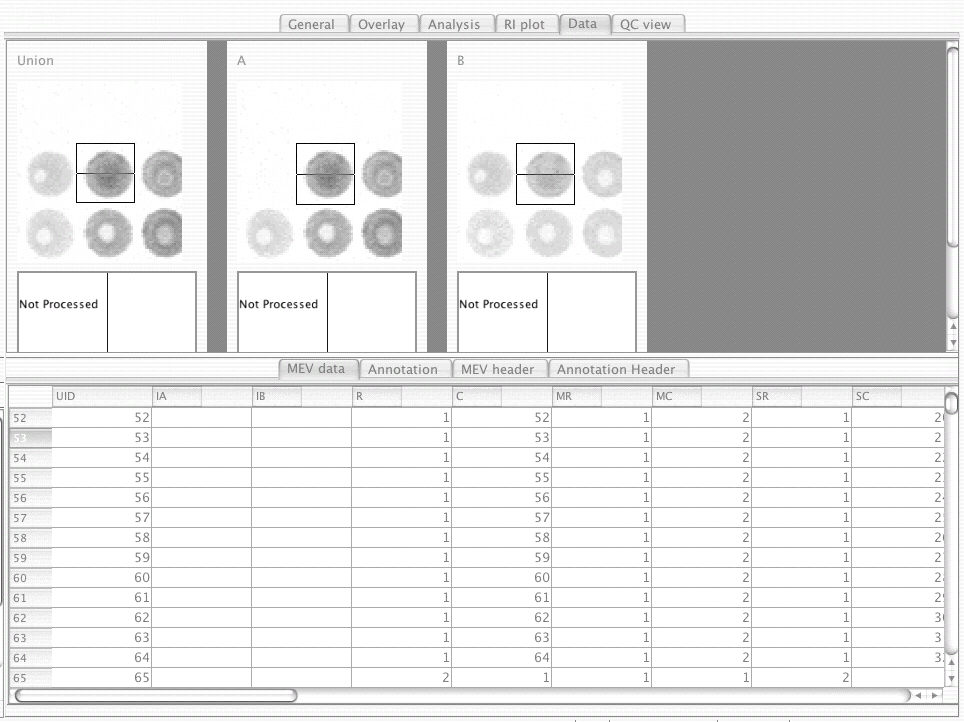
Note: Because of the interactive functionality Data Page can consume a lot of memory resources and be very slow when deals with large data sets ( high density arrays ). User may choose to display the reduced size of MEV data file on Data Page to improve program performance and optimize memory use. In this mode only the first ten columns will be shown in MEV table view. This visualization mode does not affect the size of output MEV file. The settings can be changed from Program Settings dialog.
Interaction assumes that user can click on any row in the table and select a spot/cell for viewing:
|
|
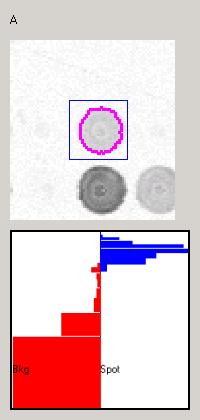
Spot ViewThe selected spot is displayed in the vicinity of its close eight neighboring spots. The selected spot cell is editable in the same way as on Cell Editor.Selected spot cell can be edited, i.e. moved and resized. Spot cell flagging is implemented in this control in the same way as in Cell Editor Dialog. To move cell just make left mouse click and hold it while moving mouse to the new location. To change the cell rectangle size right click mouse and hold at the bottom right corner of the cell, than drag the corner to a new position. Move cell after that if needed. Spot cell flagging is implemented in this control in the same way as on Cell Editor. Histogram PlotThe Histogram Plot helps user to visualize the spot/background separation performed by the segmenation procedure. The spot and background pixels histograms are displayed on the same panel for every channel. The histograms for both background and spot pixels are plotted vertically, with minimum pixel at the bottom and maximum pixel at the top of the panel. Vertical middle line devides pane in two halves: left for background pixels set, right one for spot pixels set. On the right side of the panel the blue color displays the spot pixels histogram in log scale. On the left side red color dislays the background pixels histogram in log scale. The spot pixels histogram peak is at the extreme right side, while background pixel histogram maximum is at the extreme left side. Location of the blue histogram on the right above the red one on the left means a good separation between a spot and surrounding background. In this case we may tell about real spot detection with a perfect separation between spot and background pixels. When both red and blue histogram peaks are at the same vertical level or close to each other one cannot say about difference betweeen spot and background: the spot cannot be considered as real. |