Left Pane

click to enlarge

The Left Pane is a home for the dialogs and controls that are permanently visible to user.

The top part of Left Pane is occupied by Thumbnail View and the sliders for settings Brightness and Contrast. The bottom part is a toolbox control that is a container for three dialogs: Gridding and Processing Dialog, Post-Processing Dialog, and Cell Editor Dialog. Only one of these dialogs can be shown at once. User can switch from one dialog to another by clicking the horizontal tab with the name of dialog.


Thumbnail View and Image Control Sliders

Thumbnail View

The Thumbnail View is a small image view showing the Union image. In addtion the blue overlaping rectangle shows user the location of current visible image area on Analysis Page and QC View Page. The position and size of the blue rectangle are changed when user scrolls though the image or zoom it in or out on those pages.

Brightness and Contrast slide controls

Contrast and Brightness slider bars help to adjust the appearance of the grayscale image. The initial settings are: contrast is in the middle of its range while brightness is set to zero (top position). These controls change only the Spotfinder display image views but do not effect the original image data.


Tool Box Control

Tool Box control is a container for many dialogs. Only one of these dialogs can be shown at the time. User can switch from one dialog to another by clicking the horizontal tab with the name of selected dialog.

Gridding and Processing Dialog

This dialog helps user to set parameters for automatic grid alignment and spot finding.

Auto Grid Adjustment Settings

Mask Size is the only parameter needed to be set for auto grid adjustment. The automatic adjustment procedure uses the mask to set grid in place. The mask value has to be set equal or slightly higher than the expected spot size. This parameter is measured in pixels. Default value is 10. The button Adjust All starts auto alignment for all grids (blocks).

Segmentation Method Settings

In image processing the identification of regions within an image is called segmentation. Hence, the segmentation in microarray image analysis is simply means the spot detection: the search for the line (boundary) between spot and surrounding background. Spotfinder currently uses three segmentation methods. One is Histogram thresholding method, which requires one input parameter: an estimated spot size measured in pixels. Another method is Otsu thresholding method, which needs two parameters from user to entry: maximum and minimum spot size. The default maximum value is limited by to the cell size. The default minimum spot size equals to 3 pixels across the spot. The last segmentaion method is Fixed Circle method. It takes as a spot the area inside a circle centered in the cell. The only parameter user can set for this method is the circle diameter in pixels. The button Process all launches the processing loop; segmentation is a key task of this processing.

Post-Processing Dialog

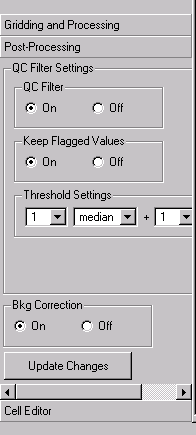
This dialog is a container for the controls that can be used to set parameters for QC filter. These settings change the parameters that does not require reprocessing and for this reason is referred as post-processing dialog.

Group of radio buttons QC Filter can be used to turn on and off QC filter. Default value is on.

Radio button group Keep Flagged Values allows user to set the reported intensities of flagged bad spots to zero (default). As option user can keep bad spot values in output data set.

When QC Filter is enabled the threshold settings can be selected from dialog. The threshold is defined in the form of n* (background median) + m*(background standard deviation). Default values are n=1, and m=1. User may adjust this thershold cuttoff level by changing parameters n and m.

Also user can set background correction on and off by using button group Bkg Correction.

Non of these settings require data reprocessing, however user have to click button Update Changes to take all changes into effect.

Note that non of those settings change raw data in the program internal dataset.

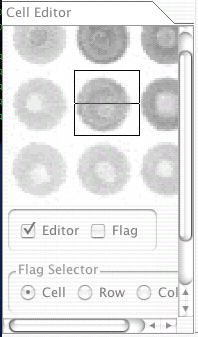
Post-Processing dialog can be shown with vertical or/and horizontal scroll bar depending on the current computer screen resolution. Adding scrolling functionality gives user a possibilty to view all dialog controls without distortion.

Cell Editor Dialog

This dialog can be used to to view, align, and process selected spot. The channel of the selected spot is controlled by the Image Selector combo box on Analysis Page. The check box Editor must be checked to make Cell Editor active. When active Cell Editor displays the spot clicked by user on the Analysis Page the selected spot cell. In addition the spot can be selected from RI plot or from MEV table on Data Page. To diaplay the spot contour in Cell Editor view user should check Draw Contour check box. When Flag check box is checked user may set processing flag for spot, row or column by mouse click on the selected object on Analysis Page or Cell Editor itself (spot only). The processing flag sets to certain spot prevent this spot be processed at the processing step. The Flag Selector defines what object flagging apply to: spot, row or column. Default Flag Selector setting is Spot. The color of the cell or cells in row/column is changes from blue to green (Windows and Linux only) or set cell crossed (MacOSX) for processor flagged cells. Flagged cells are not processed during processing. Flagging can be turned back by repeated clicking on cell, row or column.

The button Process Cell initiates processing for selected cell only.

The selected spot cell can be edited, i.e. moved and resized. To move cell user should point the mouse pointer inside the cell on Cell Editor, make left mouse click and hold it while moving mouse to a new location. Release the mouse button to drop a cell at new position.

To change the cell rectangle size user should right click mouse when mouse pointer at the right bottom corner of the cell and hold at the bottom right corner of the cell, then drag the corner to a new position. Move cell after that if needed.

Cell Editor Dialog can be scrollable depending on the current computer screen resolution. Adding scrolling functionality gives user a possibilty to view all controls without distortion. The shown dialog has vertical scroll bar.

Note: the small image view on this dialog is impelemented in self-scaling mode. It won't show selected cell in full view at the first time after program loaded. Select any spot/cell few times to get full view scaling.

This is how Cell Editor Dialog appears on Mac platform. Because coloring of movable objects is not supported on MacOSX we use horizontal crossing line to label flagged cells.