( 1 ) Click to enlarge
( 2 ) Click to enlarge
( 3 ) Click to enlarge
QC View Page is a set of the quality control views. Currently there are implemented two types of the views: View A and ViewB.
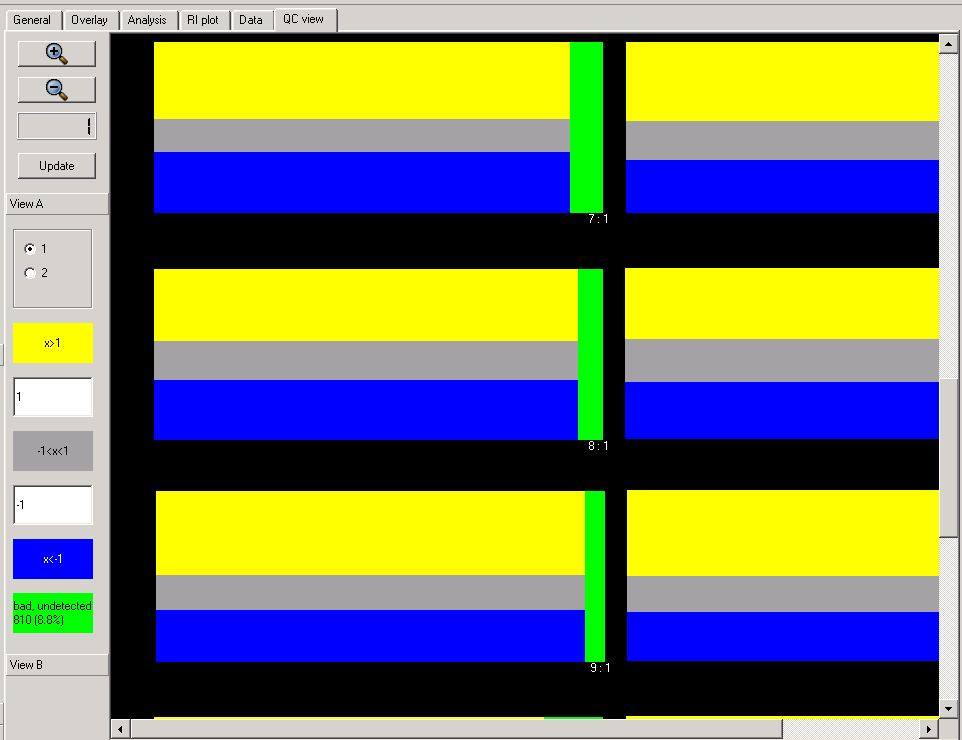
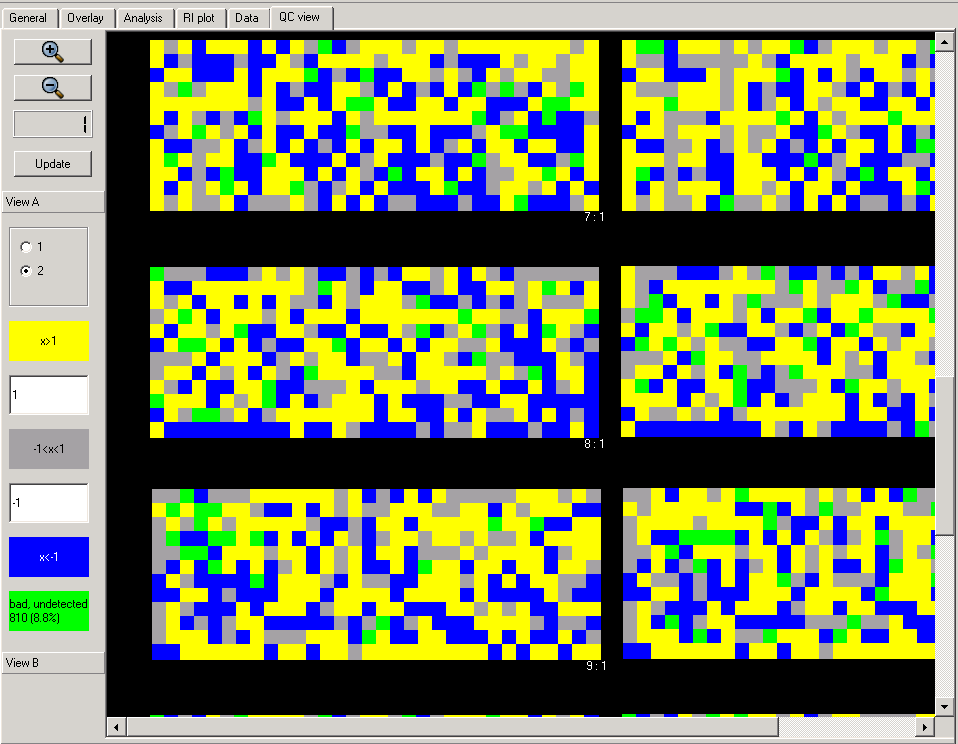
View A is color display that shows the spots painted in different colors depending on there expression ratio relatively to two preset threshold levels and flag value. Using two thresholds subdivides all spots in three categories: below low threshold, above high threshold, and between these two. After applying total slide normaliztion the spots with log2 expression ratio above high thresholdl (1 is defalut) shown in yellow, below low threshold (-1 is default) - in blue, and between these two threshold painted in gray color. Addtionaly bad and non-detected spots forms the forth category and are shown in green color. View A has two flavors . One of them (1) shows all spots in grid with expression ratios in the same category as one colored rectangle for every grid. The rectangle area is proportional to the number of spots in the category. As result the grid rectangle looks like the superposition of four big color rectangles. Another flavor (2) of View A displays spots colored by using the same schema but located in there original positions. View A has a number of controls described below.
The quality control function of QC Page can be demonstrated when use it for visual comparative analysis of the relative number of bad/undetected spots in individual grids on array. Under assumption that all grids on array have approximately the same number of the bad spots we can quickly locate the grid with abnormaly high or low number of bad/undetected spots. These grids have to be chacked for the proper alignment at first.
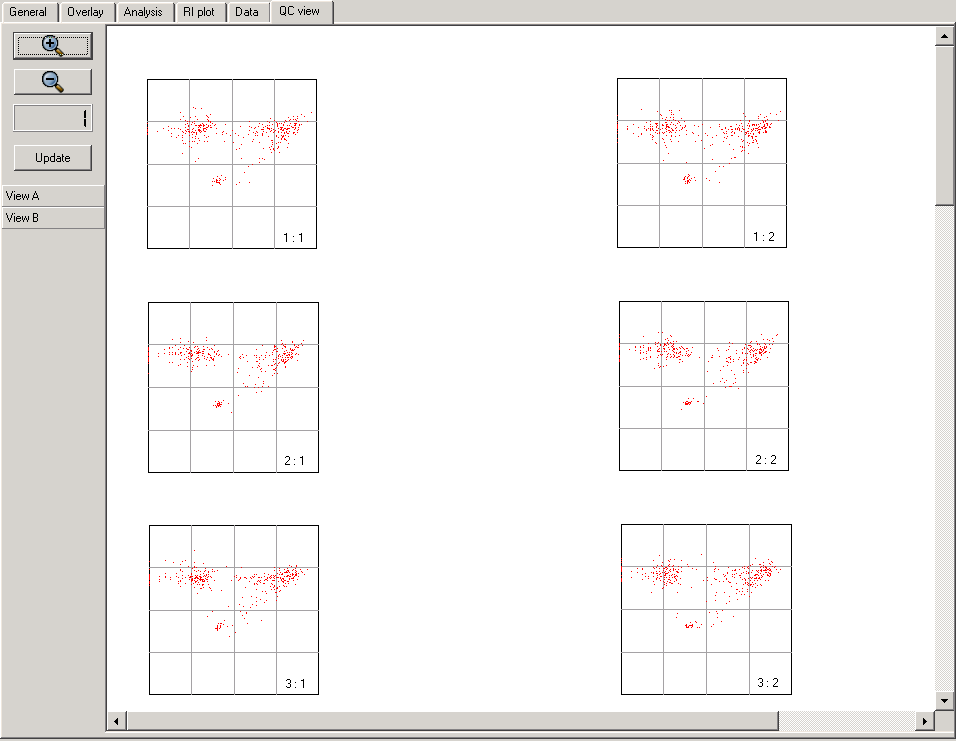
View B shows the Intensity B vs. Intensity A for every grid or block. In this view grid are shown in there original location and labeled by indices in the same way as on View A. View B (3) has no controls currently.
|
( 1 ) Click to enlarge |
( 2 ) Click to enlarge
|
( 3 ) Click to enlarge
|
 Zoom In and
  Zoom Out buttons can be used for zooming image in and out.
 Zoom factor indicator shows the zooming factor relatively to the original image scale.
All zooming and scrolling actions on QC View Page are synchronized with Analysis Page and Overlay Page.
Zoom factor indicator shows the zooming factor relatively to the original image scale.
All zooming and scrolling actions on QC View Page are synchronized with Analysis Page and Overlay Page.
 The push button Update forces to redraw the whole QC View Page.
It should be used to update changes made by using any control in Control Panel at this page.
The push button Update forces to redraw the whole QC View Page.
It should be used to update changes made by using any control in Control Panel at this page.
|
|
The Control Panel currently is implemented as a holder for only one dialog with controls that allow to set two thresholds.
It might be extended in future to manage more QC views.
|
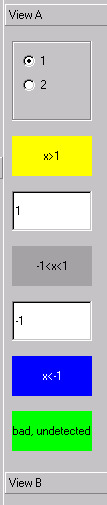
 Radio button selector swicthes between View 1and View 2
 Yellow legend label with number in it shows the upper expression ratio threshold.
Spots with log ratio above this value are shown in yellow.
Yellow legend label with number in it shows the upper expression ratio threshold.
Spots with log ratio above this value are shown in yellow.
 Text entry box can be used for setting the upper threshold.
 Gray legend label holds the expression with the range between upper and low threshold.
Spots in this range of expession ratio are painted in gray color.
Gray legend label holds the expression with the range between upper and low threshold.
Spots in this range of expession ratio are painted in gray color.
 Text entry box can be used for entering the low expression threshold.
 Blue legend label with number in it shows the low threshold of expression ratio.
Spots with log ratios below this threshold are shown in blue color.
Blue legend label with number in it shows the low threshold of expression ratio.
Spots with log ratios below this threshold are shown in blue color.
 Green legend label with text reminding that the bad and undetected spots are shown in green.
The numbers show the total number of bad/ undetected spots and there percentage relatively to the total number of spots on the slide.
The numbers give correct information only after the full slide is processed since always uses the total number of spots as reference.
The number of bad/undetected spots is reported in MEVheader of
Green legend label with text reminding that the bad and undetected spots are shown in green.
The numbers show the total number of bad/ undetected spots and there percentage relatively to the total number of spots on the slide.
The numbers give correct information only after the full slide is processed since always uses the total number of spots as reference.
The number of bad/undetected spots is reported in MEVheader of