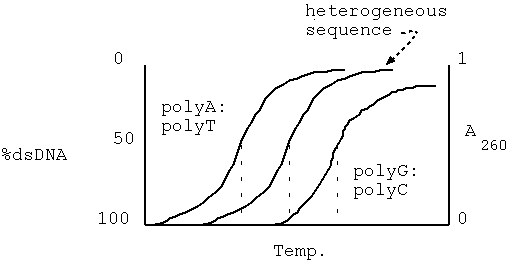
A:T < heterogeneous < G:C
eg. polyA:polyT AAAAAAAAAA
                TTTTTTTTTT

 heterogeneous  GGTACTACCAT
                CCATGATGGTA

 polyG:polyC    GGGGGGGGGGG
                CCCCCCCCCCC
Chapter 4 of The Cell: A Molecular Approach provides good background for this material.
Up to this point, we have been studying eukaryotic genomes from a very structural and mechanistic perspective. We have largely ignored the whole purpose for its existence, that being the storage and expression, and replication of genetic information. For the next four readings, we will focus on the information contained in the genome, and its organization within the chromosomes.
Purine and pyrimidine bases have a peak absorbance at 260 nm.
For ssDNA, the absorbance of the DNA molecule is about the same as
would be predicted by adding up the absorbances of each individual
nucleotide. In duplexed DNA, the total A260 is less than the sum
of the absorbances of the constituent nucleotides, due to
electronic interactions between the stacked bases. This is
referred to as the hypochromic effect. As the
DNA melts (or denatures), the amount of single-stranded DNA
increases, relative to the amount of double-stranded DNA.
Consequently, the absorbance also increases.
|
A:T < heterogeneous < G:C
eg. polyA:polyT AAAAAAAAAA
TTTTTTTTTT
|
|
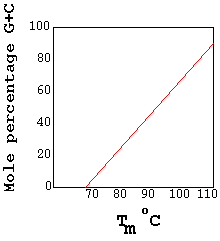
When melting DNA in experimental conditions, a quantity called TM
is observed. TM is the temperature at which
half of the DNA is denatured, or has become
single-stranded. Since TM is directly related to base
composition, it can be used to estimate the composition of an
unknown DNA sequence.
|
Tm
- temperature at which half of the DNA is denatured.
Used to quantify base composition. |
|
Just as DNA melting can tell us something about the sequences
present, so can reassociation.
Protocol:
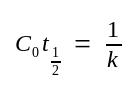
Under these conditions, the reassociation of DNA molecules in solution is described by the equation:
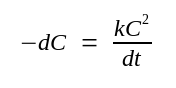
Where:
The equation can be rearranged to a more convenient form by
defining dC as C/C0:
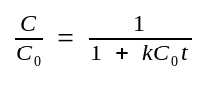
C0 ::= the initial[ssDNA] at time 0.
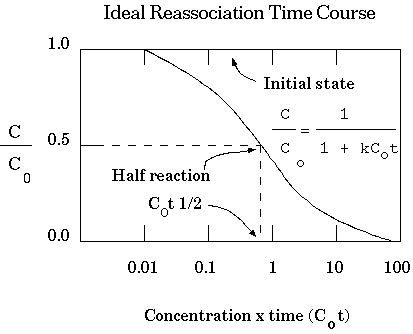
C0t½ ::= the value of C0t at which annealing has proceeded to half completion (C/C0=0.5).
|
 |
 |
| Semi-log plots Remember semi-log plots? They're used for lots of things, including pH. http://www.tiem.utk.edu/~gross/bioed/webmodules/phbuffers.html |
Complexity (X) is defined as the longest
non-repetitive sequence that can be derived
from a sequence.
| sequence | complexity |
| AAAAAAAAAA TTTTTTTTTT |
1 |
| ATATATATAT TATATATATA |
2 |
| ATGATGATG TACTACTAC |
3 |
| ATGCATGC TACGTACG |
4 |
| ATGCCATGCC TACGGTACGG |
5 |
The complexity (X) of a population of uniformly sized DNA molecules can be measured with the following equation:
X=KC0t½
where K has been determined under standard conditions (0.18M cations [eg. Na+], 400 nucleotide fragment size) as approximately 5 x 10⁵ L bp mole-1 sec-1. Rearranging the equation, we see that:
C0t½=X/K
| Therefore, C0t½
increases with the complexity of the DNA. We can use this
relation to measure genome size as shown in the figure at
right. |
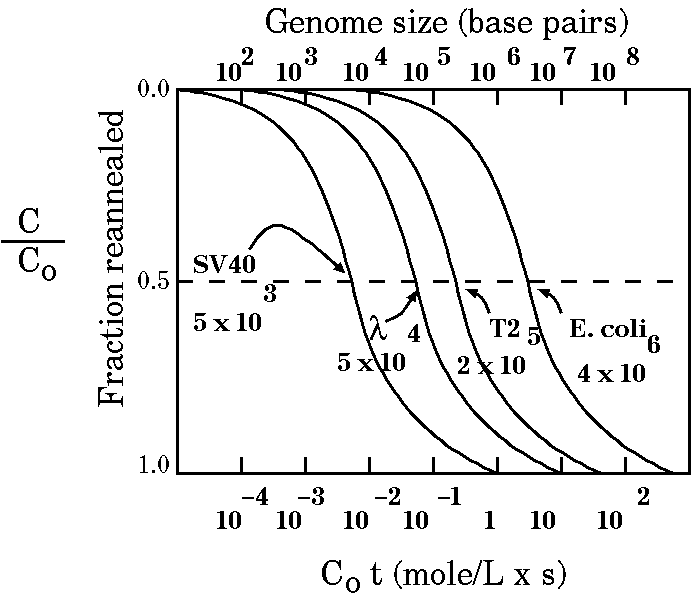 |
In the figure above, all the graph lines take roughly the same shape. Something different happens when we compare prokaryotes (like E. coli) and eukaryotes:
|
Redrawn from Russel,P.J. (1986 )Genetics Fig. 7-25b. Kinetics of renaturation of DNAfrom calf thymus and E. coli as seen in a Cot plot. The E.coli DNA consists almost entirely of unique sequences. However, the shape of the Cot curve for the calf DNA is very different from that of E. coli and indicates that there are some sequences (toward the right of the curve) that renature much more slowly and some (toward the left of the curve) that renature much more quickly than the bacterial DNA sequences. |
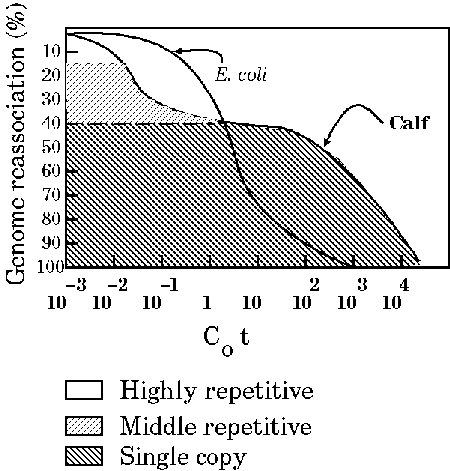 |
The E. coli DNA consists almost entirely of unique sequences. However, the shape of the C0t curve for the calf DNA is very different from that of E. coli and indicates that there are some sequences (toward the right of the curve) that renature much more slowly and some (toward the left of the curve) that renature much more quickly than the bacterial DNA sequences. The C0t curves for Calf thymus and E. coli DNA indicate that, while E. coli DNA anneals at a relatively sharp inflection point, Calf DNA contains three major kinetic classes:
The term "single-copy" is a bit misleading, in that it refers to 1 - 10 copies per haploid genome. In fact, any distinction between single copy and middle repetitive forces you to draw an arbitrary line. They are useful concepts because they bring out something of the content of genomes, but the definitions of highly repetitive, middle repetitive and single-copy shouldn't be pushed too far. Another point to mention is that although most protein coding genes are found in the single copy fraction, not all of the single copy fraction is protein coding genes. There appears to be a lot of non-coding single copy "junk" in many eukaryotic genomes
C0t½(pure) = f C0t½(mixed)
Where pure indicates a purified fraction and mixed indicates whole genomic DNA. This value can be plugged into the equation for complexity:
X = KC0t½(pure)
By combining data for the different kinetic classes, the complexity and size for a wide range of genomes has been measured, as shown in the following table:
| Species | Common Name | Genome Size (kb) | Genome Complexity (kb) |
|---|---|---|---|
| A. thaliana | - | 7.0 x 10⁴ | 5.5 x 10⁴ |
| Gossypiumm hirsutum | Cotton | 7.2 x 10⁵ | 5.1 x 10⁵ |
| Linum usitatissimum | Flax | 1.5 x 10⁵ | 6.8 x 10⁴ |
| Zea mays | Maize | 5.7 x 10⁶ | 2.3 x 10⁶ |
| Vigna radiata | Mung bean | 4.7 x 10⁵ | 2.6 x 10⁵ |
| Petrosalinum sativum | Parsley | 3.8 x 10⁶ | 1.3 x 10⁶ |
| Pisum sativum | Pea | 4.5 x 10⁶ | 1.3 x 10⁶ |
| Pennisetum americanum | Pearl Millet | 3.8 x 10⁵ | 1.0 x 10⁵ |
| Glycine max | Soybean | 1.3 x 10⁶ 1.8 x 10⁶ |
6.9 x 10⁵ 7.3 x 10⁵ |
| Nicotiana tabacum | Tobacco | 1.5 x 10⁶ 2.4 x 10⁶ |
6.4 x 10⁵ 1.0 x 10⁶ |
| Triticum aestivum | Wheat | 5.2 x 10⁶ | 6.2 x 10⁵ |
| Homo sapiens | Human | 3.0 x 10⁶ | 1.0 x 10⁶ |
| Mus musculus | Mouse | 1.6 x 10⁶ | 9.1 x 10⁵ |
| Drosophila melanogaster | Fruit fly | 1.5 x 10⁵ | 1.1 x 10⁵ |
| Caernorhabditis elegans | Nematode worm | 8.0 x 10⁴ | 7.0 x 10⁴ |
| Achyla bisexualis | Water mold | 4.2 x 10⁴ | 3.4 x 10⁴ |
| Escherichia coli | - | 4.2 x 10³ | 4.2 x 10³ |
| Table 1 from Okamuro & Goldberg p8 in The Biochemistry of Plants Vol. 15 | |||
We've briefly introduced the three kinetic classes of genomic DNA: "single" copy (1 - 10), middle repetitive, and highly repetitive. Now it's time to investigate which kinds of DNA fall into those categories. Remember, we measure the complexity of DNA based on how long it takes to reanneal. To classify (as much as we can) different parts of DNA, the basic idea is to first perform a reassociation experiment, then calculate the C0t value for that part of DNA. Then we can sort portions of DNA based on those values.
It is possible to determine the distribution of mRNA sequences
in the kinetic classes of DNA by hybridizing labeled polyA+ RNA
with an excess of unlabeled DNA. The C0t value at which
a given fraction of RNA hybridizes with unlabeled DNA indicates
the kinetic fraction into which that RNA falls. Most genes coding
for mRNAs fall into the single copy class (~1-10 copies/haploid
genome).
Note: The exact definition of "single-copy" DNA varies from author to author.
| This labeling experiment takes place in a
HAP column as follows: Hydroxyapatite (HAP) = crystalline Ca10(PO4)6(OH)2 1) Bind DNA & probe to HAP at low salt. 2) Elute with increasing quantites of salt. ssDNA, unhybridized probe elutes first. At high salt, the duplexed material elutes. This method could also be used to isolate DNA from specific kinetic classes. It also tells you the fraction of probe that is in double-stranded or single-stranded:
|
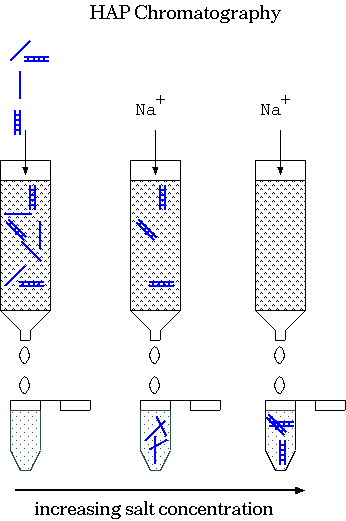 |
| When you add trace quantities of radioactively-labeled RNA to an excess of ssDNA, most of the radioactive probe anneals to DNA (becomes ds) at high C0t values. This indicates that most of the RNA was transcribed from single copy DNA. That is, most genes are present in single copy DNA. | 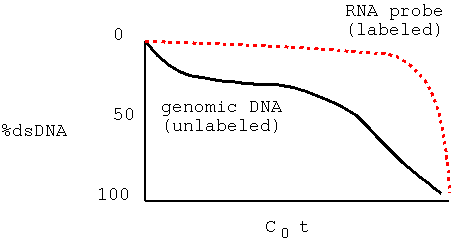 |
This is a very heterogeneous class of sequences, ranging from 101 to 10 5 repeats per haploid genome. Some examples of DNA that fall into this category are:
Note: rRNAs for eukaryotic 18S, 5.8s and 26S rRNAs are transcribed as a single transcript and cleaved into the mature rRNAs. The rRNA genes are present as tandemly-repeated units at the nucleolar organizer regions (NOR). One or more NOR's may be located of different chromosomes.
SINES - short interspersed repeats
| One of the families of repeated sequences that falls into this class is called SINEs, which stands for short interspersed elements. One of the most prominent SINE families in primates is called the Alu1 family. The Alu1 family in primates is a 300 bp retrotransposon (we'll talk more about transposons later on). These sequences have been shown to be transcribed into RNA, reverse transcribed into DNA, and inserted randomly into thousands of locations throughout the genome. Alu1 family sequences were discovered by annealing genomic DNA to low C0t and then treating the DNA with the single-stranded nuclease S1. S1 degrades single-stranded DNA, leaving double stranded DNA intact. When loaded on a gel, the dsDNA exhibited a 300 bp band, against a background of thousands of other bands. When the DNA products were digested with the restriction enzyme Alu1, most of the 300 bp band was shifted to two bands of 170 and 130 bp. This indicates that most of the copies of the 300 bp sequence contain an internal Alu1 site. Hence the name, "Alu1 family". | 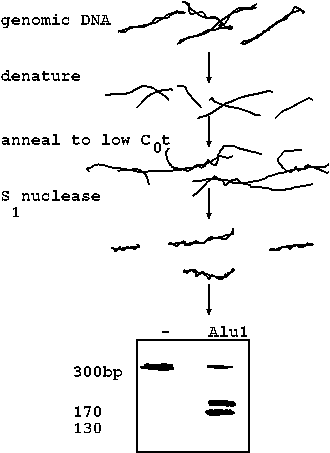 |
| FISH of human chromosomes using an AluI family probe (green), and counterstained with the DNA-specific dye TOPRO3 (red). These data indicate that members of the AluI family can be found on all human chromosomes, dispersed among thousands of chromosomal locations. From: Three-Dimensional Maps of All Chromosomes in Human Male Fibroblast Nuclei and Prometaphase Rosettes Bolzer A, Kreth G, Solovei I, Koehler D, Saracoglu K, et al. PLoS Biology Vol. 3, No. 5, e157 (2005) doi:10.1371/journal.pbio.0030157 | 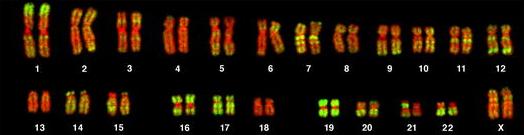 |
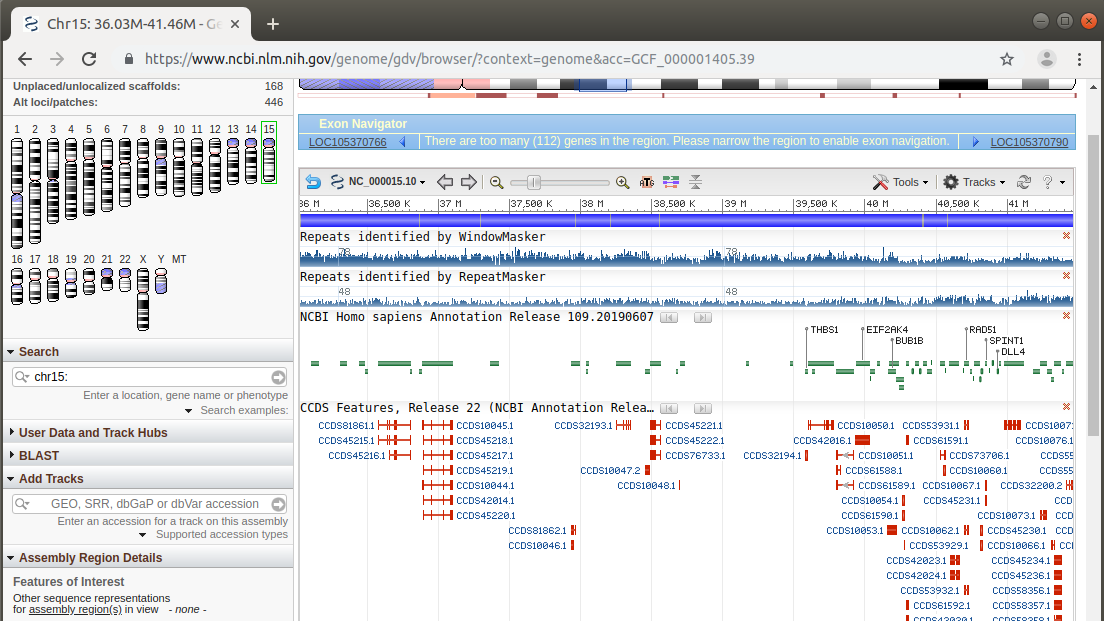
A six million nucleotide region of chromosome 15 is shown in the NCBI Genome Data Viewer. Middle repetitive sequences are superimposed above maps for transcripts in which exons are thick red boxes and introns are thin red lines. We can see that repetitive sequences are found both in intergenic regions as well as within introns.
This fraction consists largely of satellite DNA, and in particular the motifs that make up centromeric and telomeric DNA. These sequences are repeated more than 105 times per haploid genome.
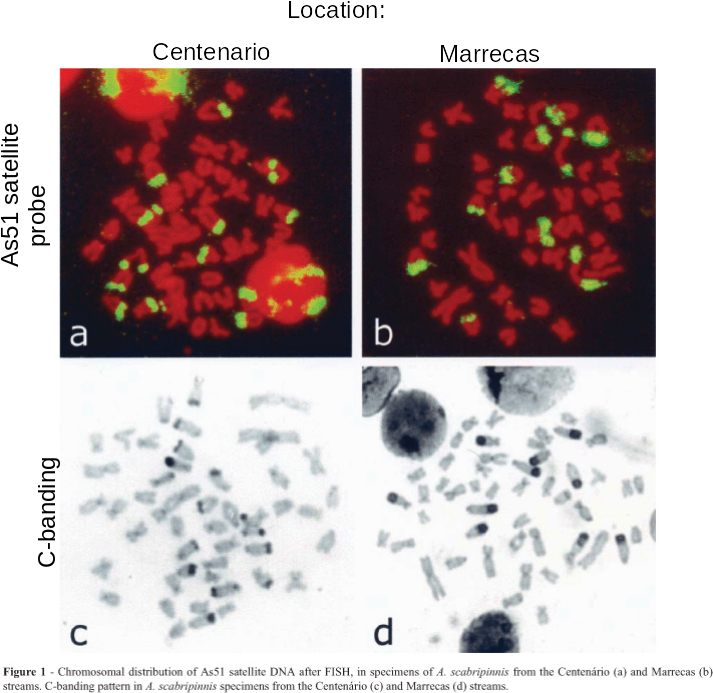
There are many families of satellite sequences in eukaryotic
genomes. An example is the As51 class of satellite sequences found
in several species of charachid fishes. Note that this family of
sequences is seen on several chromosomes, both at centromeric and
telomeric regions.
| from Abel LDdS, Mantovani M,
Moreira-Filho O (2006) Chromosomal distribution of the
As51 satellite DNA in two species complexes of the genus
Astyanax (Pisces, Characidae) Genet. Mol. Biol.
29:448-452. doi: 10.1590/S1415-47572006000300008 Link As51 satellite (GB:U87962) 5'GGTCAAAAAGTCGAAAAAATGACTA- AGTCCCACTTGGTCTACCATTGGTAC3' |
 |
Further reading: Lewis, R. 2002. C0t
analysis stages a revival: a three-decade-old technique finds
new life in the genomicists' tool chest. The Scientist 16
(16): 49 - 50.