Aquatic Botany
Typha Burn Experiment
Updated: 30 November 2008
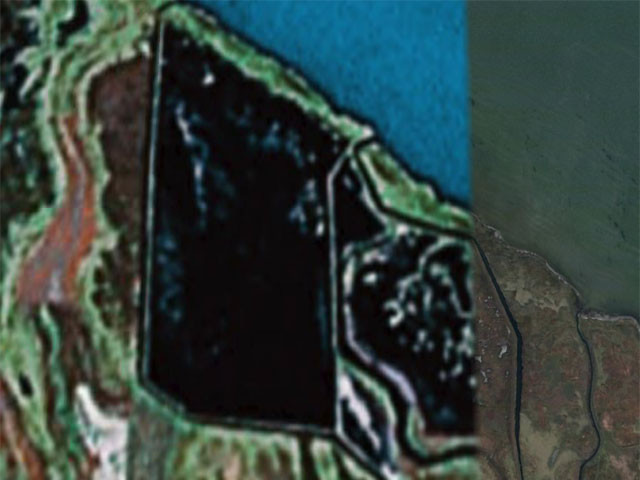
Above: The two marsh cells on the shore of Lake Manitoba, near Lynchs Point, can be seen in this image from Google Earth. In the year that photography was acquired, the west (left) cell had been flooded to kill emergent macrophytes. The east (right) cell had not been flooded but there was still considerable areas of open water. By 2007, both cells were mostly overgrown by hybrid cattail (Typha X glauca).
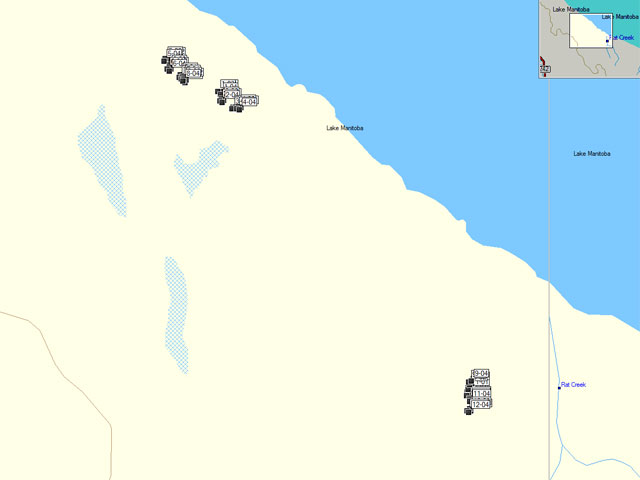
Above: Twelve sites were established in the cells, four in the east cell (sites 9 to 12) and eight in the west cell (sites 1 to 8). Each site measured 10 m by 10 m.
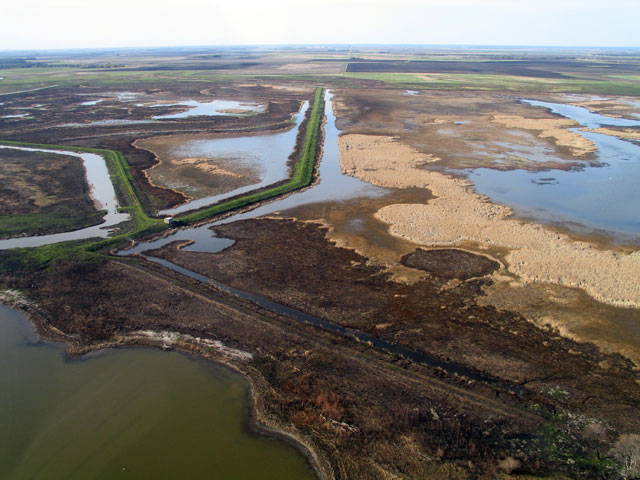
Above: In spring 2007, most of the area within both cells burned when a fire started by a nearby farmer went awry. This aerial photo taken soon after the fire is looking south from over Lake Manitoba (visible in the left front of the photo). The dike separating the two cells is visible in the center of the photo -- it is bright green because marsh vegetation had already begun to regrow at this point, just a short time after the fire. Also visible in the photo is a light-brown, unburned area in the west (right) cell. This is where sites 1 to 8 were located.
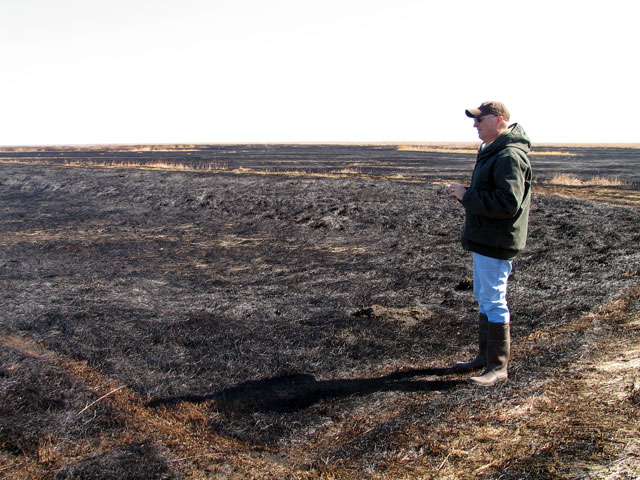
Above: Dr. Dale Wrubleski (Ducks Unlimited Canada) surveyed the burned marsh vegetation in the east cell in the spring of 2007. In most places, the fire had burned all standing vegetation, along with litter on the ground, leaving only a small amount of ash.
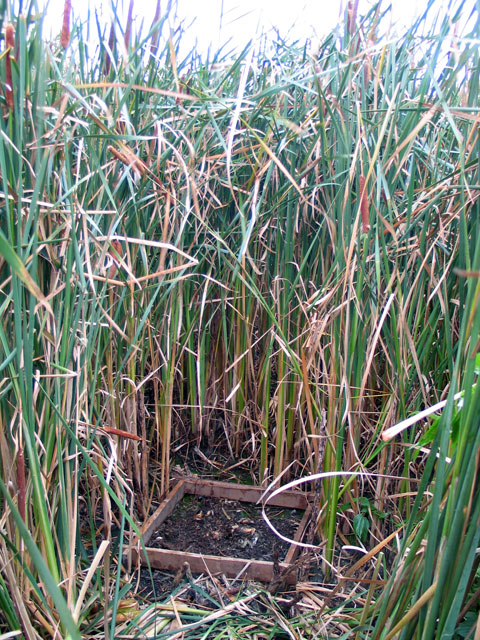
Above: This view at a site in the east cell was taken in the summer of 2007. The site had burned earlier that year, so there was little or no remaining standing dead vegetation from the previous year (2006). The cattails here were over 2 meters tall. We see a plot at the bottom of the photo, one of 12 that was measured at each site. The plot was a 0.5 m by 0.5 m wood quadrat that enclosed an area of 0.25 m2. In six of the 12 plots within a site, we simply counted the number of cattail stems (live flowering, live vegetative, standing dead). In the other six plots, we cut everything at the sediment surface and removed it, as seen in this photo.
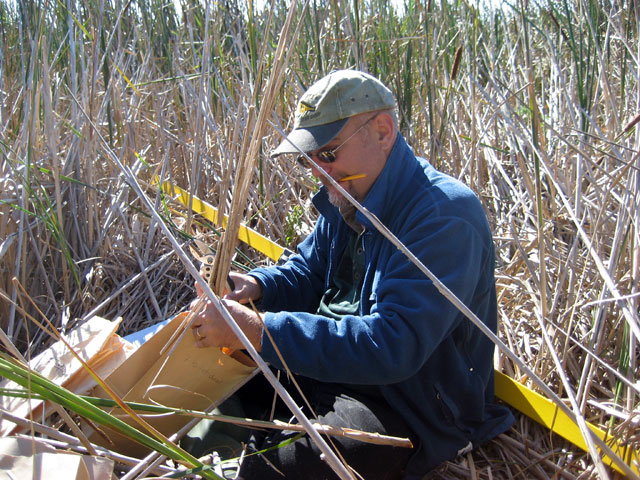
Above: Here I am putting vegetation removed from a plot into a paper bag. These were taken back to the lab at the Field Station and dried at 100°C for several days then weighed. For each bag, we recorded its total weight (that is, the weight of the bag and its contents) then discarded the contents and reweighed the empty bag. (This was the Tare weight.) The difference between the Total and Tare weights gives us the weight of the contents. This amount comes from 0.25 m2 so, to calculate Typha biomass as g/m2, we multiply this value by 4.
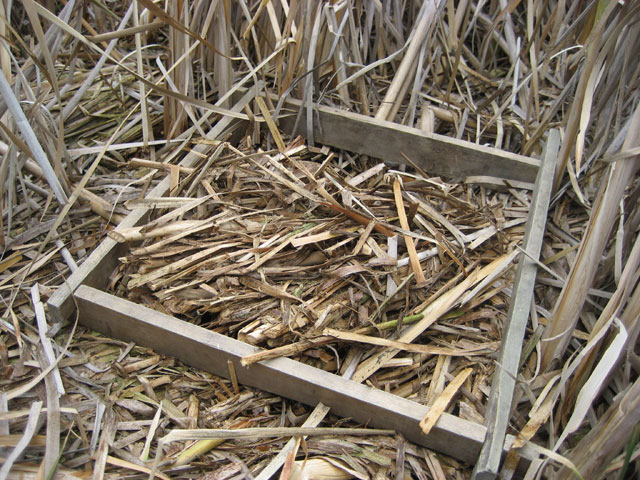
Above: In this photo we see abundant litter on the sediment surface. In 2007, litter occurred only at sites where no fire had occurred. The litter was collected within the plot, bagged, dried and weighed in the same way as the biomass of standing plants.
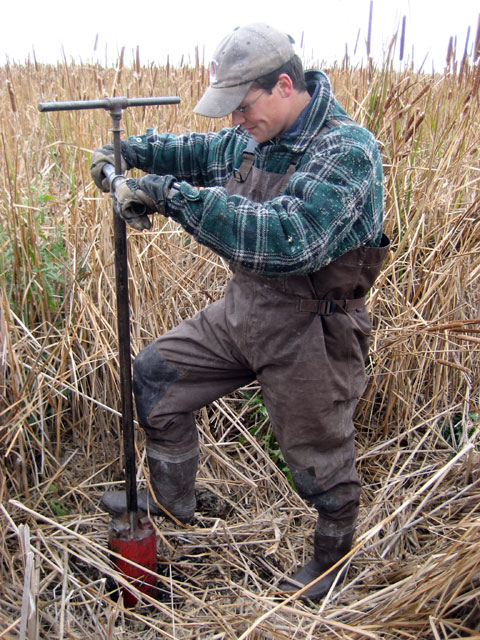
Above: In plots were litter was sampled, we then used a soil corer shown here to collect samples of below-ground Typha biomass. These samples were taken back to the Field Station and the soil was removed using a specially-designed washing machine. Then the plant matter was dried and weighed as for the other plant samples. You will NOT be using these data in your report.
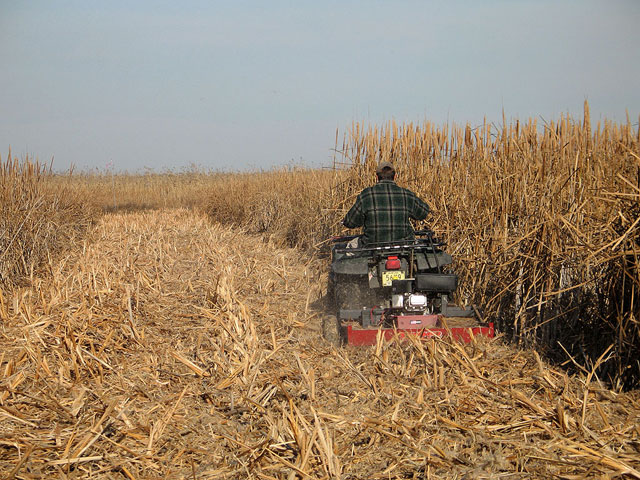
Above: When all vegetation sampling had been completed in 2007, the sites selected for the control burn were surrounded by a fire break intended to prevent the fire from burning outside the prescribed area. We used a brush cutter pulled by a quad shown here to cut a wide lane between areas to be burned and areas to remain unburned.
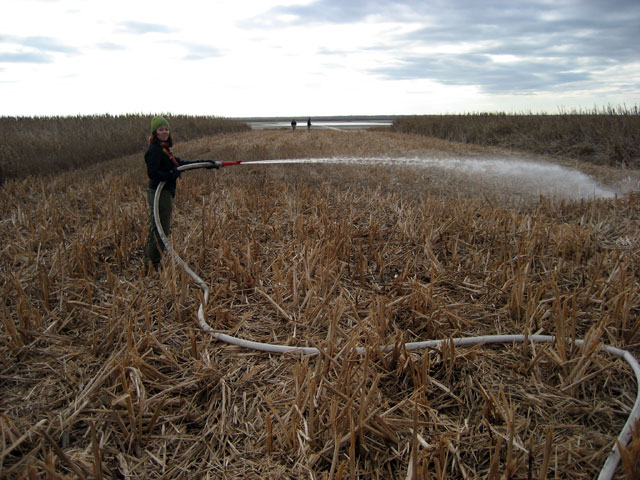
Above: As a final precaution, the fire breaks were wetted down using water pumped up from Lake Manitoba.
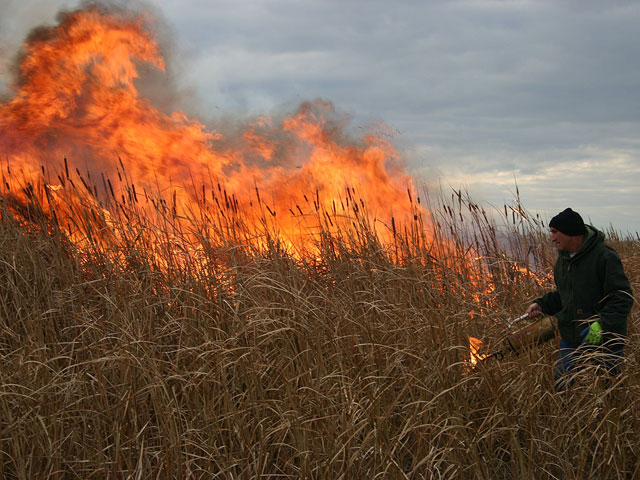
Above: Then, we used torches containing a mixture of gasoline and diesel fuel to light the cattails. They burned intensely and quickly. The whole burning was completed in less than 30 minutes.
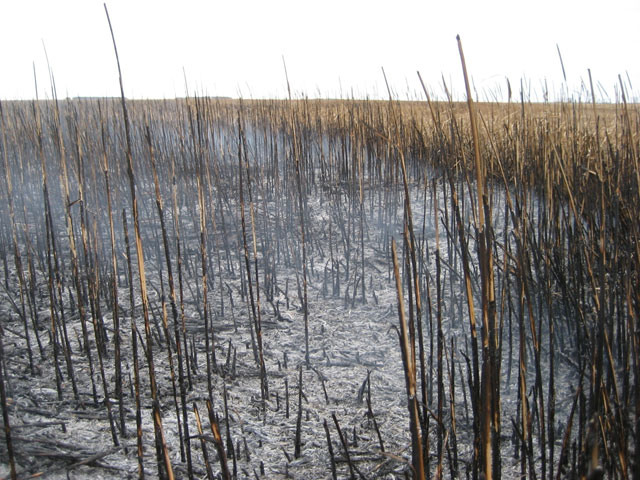
Above: This is one of the burned sites immediately after the fire. Notice that some of the green stems did not burn but the litter on the ground was completely consumed, leaving only gray ash.
So, in summary, the burn treatments were as follows:
Sample calculations (Excel spreadsheet) - right-click and select "Save as ..." to save a copy.
In this worked example, I have done the calculations for site 1 in 2008. I have calculated means of the six plots in the site which will be a useful basis for comparison with the same site in 2007. It can also be used to calculate a treatment mean (the mean of sites 1 to 4) that would be used, in you wish, in a statistical evaluation of change.